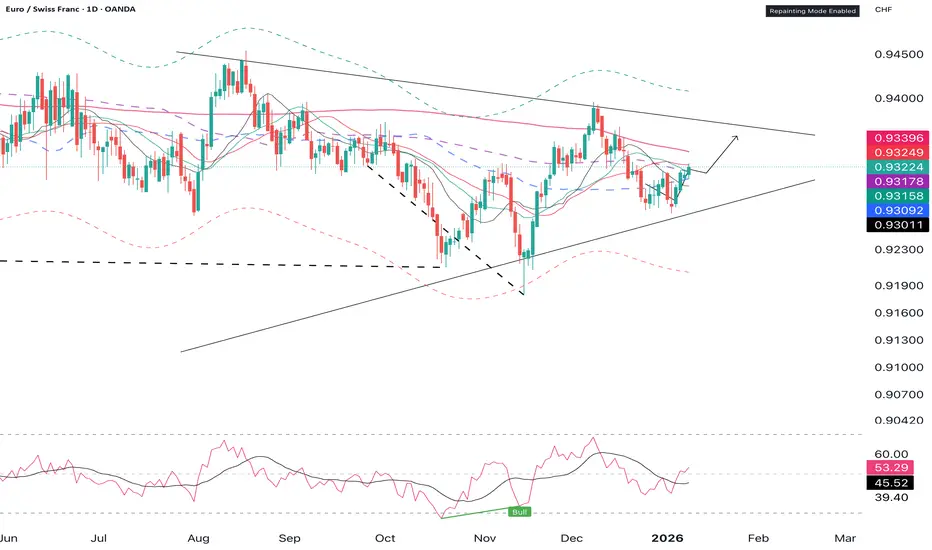
EURCHF: Growth & Bullish Continuation
Looking at the chart of EURCHF right now we are seeing some interesting price action on the lower timeframes. Thus a local move up seems to be quite likely.
Disclosure: I am part of Trade Nation's Influencer program and receive a monthly fee for using their TradingView charts in my analysis.
❤️ Please, support our work with like & comment! ❤️
EURCHF

EURCHF Set To Grow! BUY!
My dear subscribers,
This is my opinion on the EURCHF next move:
The instrument tests an important psychological level 0.9162
Bias - Bullish
Technical Indicators: Supper Trend gives a precise Bullish signal, while Pivot Point HL predicts price changes and potential reversals in the market.
Target - 0.9174
My Stop Loss - 0.9155
About Used Indicators:
On the subsequent day, trading above the pivot point is thought to indicate ongoing bullish sentiment, while trading below the pivot point indicates bearish sentiment.
Disclosure: I am part of Trade Nation's Influencer program and receive a monthly fee for using their TradingView charts in my analysis.
———————————
WISH YOU ALL LUCK

EUR-CHF Bearish Bias! Sell!
Hello, Traders!
EURCHF clean downside breakout from a well-defined supply zone confirms bearish intent. Liquidity was swept above highs, followed by displacement, opening room toward lower liquidity pools. Time Frame 12H.
Sell!
Comment and subscribe to help us grow!
Check out other forecasts below too!
Disclosure: I am part of Trade Nation's Influencer program and receive a monthly fee for using their TradingView charts in my analysis.

EURCHF bearish continuation below 0.9250 The EURCHF currency pair continues to display a bearish outlook, in line with the prevailing downward trend. Recent price action suggests an oversold bounce back, potentially setting up for a spike higher and a retest of the resistance zone ahead of another move lower if resistance holds.
Key Level: 0.9250
This zone, previously a consolidation area, now acts as a significant resistance level.
Bearish Scenario (rejection at 0.9250):
A failed test and rejection at 0.9250 would likely resume the bearish momentum.
Downside targets include:
0.9190 – Initial support
0.9170 – Intermediate support
0.9160 – Longer-term support level
Bullish Scenario (breakout above 0.9250):
A confirmed breakout and daily close above 0.9250 would invalidate the bearish setup.
In that case, potential upside resistance levels are:
0.9270 – First resistance
0.92900 – Further upside target
Conclusion
EURCHF remains under bearish pressure, with the 0.9250 level acting as a key inflection point. As long as price remains below this level, the bias favours further downside. Traders should watch for price confirmation around that level to assess the next move.
This communication is for informational purposes only and should not be viewed as any form of recommendation as to a particular course of action or as investment advice. It is not intended as an offer or solicitation for the purchase or sale of any financial instrument or as an official confirmation of any transaction. Opinions, estimates and assumptions expressed herein are made as of the date of this communication and are subject to change without notice. This communication has been prepared based upon information, including market prices, data and other information, believed to be reliable; however, Trade Nation does not warrant its completeness or accuracy. All market prices and market data contained in or attached to this communication are indicative and subject to change without notice.

EURCHF H4 | Bearish Reaction Off Pullback ResistanceMomentum: Bearish
Price is currently below the ichimoku cloud.
Sell entry: 0.92530
- Pullback resistance
- 61.8% Fib retracement
- Fair value gap
Stop Loss: 0.92986
- Overlap resistance
Take Profit: 0.91913
- Swing low support
High Risk Investment Warning
Stratos Markets Limited (fxcm.com/uk), Stratos Europe Ltd (fxcm.com/eu):
CFDs are complex instruments and come with a high risk of losing money rapidly due to leverage. 69% of retail investor accounts lose money when trading CFDs with this provider. You should consider whether you understand how CFDs work and whether you can afford to take the high risk of losing your money.
Stratos Global LLC (fxcm.com/en): Losses can exceed deposits.
Please be advised that the information presented on TradingView is provided to FXCM (‘Company’, ‘we’) by a third-party provider (‘TFA Global Pte Ltd’). Please be reminded that you are solely responsible for the trading decisions on your account. Any information and/or content is intended entirely for research, educational and informational purposes only and does not constitute investment or consultation advice or investment strategy. The information is not tailored to the investment needs of any specific person and therefore does not involve a consideration of any of the investment objectives, financial situation or needs of any viewer that may receive it. Past performance is not a reliable indicator of future results. Actual results may differ materially from those anticipated in forward-looking or past performance statements. We assume no liability as to the accuracy or completeness of any of the information and/or content provided herein and the Company cannot be held responsible for any omission, mistake nor for any loss or damage including without limitation to any loss of profit which may arise from reliance on any information supplied by TFA Global Pte Ltd.
Stratos Trading Pty. Limited (fxcm.com/au):
Trading FX/CFDs carries significant risks. FXCM AU (AFSL 309763), please read the Financial Services Guide, Product Disclosure Statement, Target Market Determination and Terms of Business at fxcm.com/au

EUR-CHF Will Grow! Buy!
Hello,Traders!
EURCHF swept sell-side liquidity into a higher-timeframe demand zone and showed a sharp displacement. Reaction suggests mitigation in progress, with upside continuation likely toward the overhead supply area. Time Frame 12H.
Buy!
Comment and subscribe to help us grow!
Check out other forecasts below too!
Disclosure: I am part of Trade Nation's Influencer program and receive a monthly fee for using their TradingView charts in my analysis.

EURCHF: Bullish Forecast & Bullish Scenario
The charts are full of distraction, disturbance and are a graveyard of fear and greed which shall not cloud our judgement on the current state of affairs in the EURCHF pair price action which suggests a high likelihood of a coming move up.
Disclosure: I am part of Trade Nation's Influencer program and receive a monthly fee for using their TradingView charts in my analysis.
❤️ Please, support our work with like & comment! ❤️

EUR/CHF SENDS CLEAR BULLISH SIGNALS|LONG
Hello, Friends!
EUR/CHF pair is in the downtrend because previous week’s candle is red, while the price is obviously falling on the 4H timeframe. And after the retest of the support line below I believe we will see a move up towards the target above at 0.926 because the pair oversold due to its proximity to the lower BB band and a bullish correction is likely.
Disclosure: I am part of Trade Nation's Influencer program and receive a monthly fee for using their TradingView charts in my analysis.
✅LIKE AND COMMENT MY IDEAS✅

kvmev - EURCHF FORECAST - 25/01/2026 - 30/01/2026Price may fake out below the support zone before continuing to the upside, or may continue up upon rejection of the zone.

EURCHF Is Bullish! Buy!
Take a look at our analysis for EURCHF.
Time Frame: 4h
Current Trend: Bullish
Sentiment: Oversold (based on 7-period RSI)
Forecast: Bullish
The market is approaching a key horizontal level 0.926.
Considering the today's price action, probabilities will be high to see a movement to 0.930.
P.S
We determine oversold/overbought condition with RSI indicator.
When it drops below 30 - the market is considered to be oversold.
When it bounces above 70 - the market is considered to be overbought.
Like and subscribe and comment my ideas if you enjoy them!

EUR-CHF Bearish Breakout! Sell!
Hello,Traders!
EURCHF has cleanly broken below a well-defined supply band, confirming bearish market structure. A corrective pullback is likely to be sold, with downside liquidity and lower targets now in focus. Time Frame 6H.
Sell!
Comment and subscribe to help us grow!
Check out other forecasts below too!
Disclosure: I am part of Trade Nation's Influencer program and receive a monthly fee for using their TradingView charts in my analysis.

EURCHF: Trading Signal From Our Team
EURCHF
- Classic bullish pattern
- Our team expects retracement
SUGGESTED TRADE:
Swing Trade
Buy EURCHF
Entry - 0.9256
Stop - 0.9250
Take - 0.9269
Our Risk - 1%
Start protection of your profits from lower levels
Disclosure: I am part of Trade Nation's Influencer program and receive a monthly fee for using their TradingView charts in my analysis.
❤️ Please, support our work with like & comment! ❤️

EURCHF corrective pullback support at 0.9236The EURCHF remains in a bullish trend, with recent price action showing signs of a corrective pullback within the broader trend.
Support Zone: 0.9236 – a key level from previous consolidation. Price is currently testing or approaching this level.
A bullish rebound from 0.9236 would confirm ongoing upside momentum, with potential targets at:
0.92900 – initial resistance
0.9320 – psychological and structural level
0.9343 – extended resistance on the longer-term chart
Bearish Scenario:
A confirmed break and daily close below 0.9236 would weaken the bullish outlook and suggest deeper downside risk toward:
0.9215 – minor support
0.9190 – stronger support and potential demand zone
Outlook:
Bullish bias remains intact while the EURCHF holds above 0.9236 A sustained break below this level could shift momentum to the downside in the short term.
This communication is for informational purposes only and should not be viewed as any form of recommendation as to a particular course of action or as investment advice. It is not intended as an offer or solicitation for the purchase or sale of any financial instrument or as an official confirmation of any transaction. Opinions, estimates and assumptions expressed herein are made as of the date of this communication and are subject to change without notice. This communication has been prepared based upon information, including market prices, data and other information, believed to be reliable; however, Trade Nation does not warrant its completeness or accuracy. All market prices and market data contained in or attached to this communication are indicative and subject to change without notice.

EURCHF: Long Trade Explained
EURCHF
- Classic bullish formation
- Our team expects pullback
SUGGESTED TRADE:
Swing Trade
Long EURCHF
Entry - 0.9313
Sl - 0.9310
Tp - 0.9318
Our Risk - 1%
Start protection of your profits from lower levels
Disclosure: I am part of Trade Nation's Influencer program and receive a monthly fee for using their TradingView charts in my analysis.
❤️ Please, support our work with like & comment! ❤️

USDCHF: persistence of buyers🛠 Technical Analysis: On the H4 chart, USDCHF is retesting the key resistance zone around 0.8000, and price action suggests buyers are trying to flip this area into support. The pair is printing a local bullish rebound after the recent base, while the MA cluster (SMA50/200) provides a clear invalidation line if momentum fades. A confirmed hold above the 0.8000–0.8022 area increases the probability of an upside continuation toward the next marked resistance. The breakout target is 0.81093, while a drop back below the 0.79645 level would invalidate the bullish continuation idea.
———————————————
❗️ Trade Parameters (BUY)
———————————————
➡️ Entry Point: Buy on a confirmed breakout and hold above 0.80000 – 0.80222
🎯 Take Profit: 0.81093
🔴 Stop Loss: 0.79645
⚠️ Disclaimer: This is a potential trade idea based on current analysis; market conditions and price direction are subject to change based on news factors and volatility.

EURCHF sideways consolidation supported at 0.9270The EURCHF remains in a bullish trend, with recent price action showing signs of a corrective pullback within the broader trend.
Support Zone: 0.9270 – a key level from previous consolidation. Price is currently testing or approaching this level.
A bullish rebound from 0.9270 would confirm ongoing upside momentum, with potential targets at:
0.9330 – initial resistance
0.9350 – psychological and structural level
0.9370 – extended resistance on the longer-term chart
Bearish Scenario:
A confirmed break and daily close below 0.9270 would weaken the bullish outlook and suggest deeper downside risk toward:
0.9260 – minor support
0.9240 – stronger support and potential demand zone
Outlook:
Bullish bias remains intact while the EURCHF holds above 0.9270 A sustained break below this level could shift momentum to the downside in the short term.
This communication is for informational purposes only and should not be viewed as any form of recommendation as to a particular course of action or as investment advice. It is not intended as an offer or solicitation for the purchase or sale of any financial instrument or as an official confirmation of any transaction. Opinions, estimates and assumptions expressed herein are made as of the date of this communication and are subject to change without notice. This communication has been prepared based upon information, including market prices, data and other information, believed to be reliable; however, Trade Nation does not warrant its completeness or accuracy. All market prices and market data contained in or attached to this communication are indicative and subject to change without notice.

EUR/CHF BEST PLACE TO SELL FROM|SHORT
Hello, Friends!
EUR/CHF pair is in the downtrend because previous week’s candle is red, while the price is obviously rising on the 4H timeframe. And after the retest of the resistance line above I believe we will see a move down towards the target below at 0.930 because the pair is overbought due to its proximity to the upper BB band and a bearish correction is likely.
Disclosure: I am part of Trade Nation's Influencer program and receive a monthly fee for using their TradingView charts in my analysis.
✅LIKE AND COMMENT MY IDEAS✅

EURCHF H4 | Potential Bearish DropBased on the H4 chart analysis, we can see that the price has rejected off our sell entry level at 0.93134m, which acts as an overlap resistance that aligns with the 38.2% Fibonacci retracement.
Our stop loss is set at 0.93324, which is a pullback resistance that aligns with the 50% Fibonacci retracement.
Our take profit is set at 0.92595, which is a pullback support that aligns with the 61.8% Fibonacci retracement.
High Risk Investment Warning
Stratos Markets Limited (

Bearish reversal off key resistance?EUR/CHF has rejected off the resistance that aligns with the 61.8% Fibonacci retracement and could drop from this level to our take profit.
Entry: 0.93257
Why we like it:
There is an overlap resistance that aligns with the 61.8% Fibonacci retracement.
Stop loss: 0.93606
Why we like it:
There is a pullback resistance level.
Take profit: 0.92574
Why we like it:
There is a pullback support level.
Enjoying your TradingView experience? Review us!
Please be advised that the information presented on TradingView is provided to Vantage (‘Vantage Global Limited’, ‘we’) by a third-party provider (‘Everest Fortune Group’). Please be reminded that you are solely responsible for the trading decisions on your account. There is a very high degree of risk involved in trading. Any information and/or content is intended entirely for research, educational and informational purposes only and does not constitute investment or consultation advice or investment strategy. The information is not tailored to the investment needs of any specific person and therefore does not involve a consideration of any of the investment objectives, financial situation or needs of any viewer that may receive it. Kindly also note that past performance is not a reliable indicator of future results. Actual results may differ materially from those anticipated in forward-looking or past performance statements. We assume no liability as to the accuracy or completeness of any of the information and/or content provided herein and the Company cannot be held responsible for any omission, mistake nor for any loss or damage including without limitation to any loss of profit which may arise from reliance on any information supplied by Everest Fortune Group.

USDCHF: post-NFP setup🛠 Technical Analysis: On the H4 chart, USDCHF is rebounding into a key resistance cluster around 0.7990–0.8000, where price meets the prior supply zone and the MA area (SMA200 ~0.7976). The structure still carries a broader bearish tone (global bearish signal), and the current rally looks like a retest rather than a clean trend reversal. It expected that a potential liquidity sweep (renewal of the local high) followed by a reversal — a confirmed close back below 0.79900 would be the trigger for continuation lower. If the rejection is validated, the downside path opens toward the marked support at 0.78787.
———————————————
❗️ Trade Parameters (SELL)
———————————————
➡️ Entry Point: Sell after a sweep higher and a confirmed H4 close back below 0.79900 (approx. 0.79809 – 0.79900)
🎯 Take Profit: 0.78787
🔴 Stop Loss: 0.80488
⚠️ Disclaimer: This is a potential trade idea based on current analysis; market conditions and price direction are subject to change based on news factors and volatility.

EUR-CHF Free Signal! Sell!
Hello,Traders!
EURCHF price taps into a refined horizontal supply zone after a corrective push, showing clear signs of bearish reaction and distribution. Liquidity above recent highs appears engineered, favoring downside continuation toward lower imbalance and resting sell-side liquidity.
--------------------
Stop Loss: 0.9328
Take Profit: 0.9313
Entry: 0.9321
Time Frame: 2H
--------------------
Sell!
Comment and subscribe to help us grow!
Check out other forecasts below too!
Disclosure: I am part of Trade Nation's Influencer program and receive a monthly fee for using their TradingView charts in my analysis.

EURCHF | Strategic BUY Opportunity🟢💼 EURCHF | Strategic BUY Opportunity (Structured Upside Setup)
Overview:
EURCHF is showing bullish continuation potential, with price holding strength near a key demand area, favoring further upside movement.
Buy Zone (Focus Area):
🟢 0.9310 – 0.9315
This zone represents a strong accumulation area where buyers are actively supporting price.
Upside Objectives:
🎯 0.9340 – Primary upside reaction
🚀 0.9360 – Possible extension with momentum
🔍 0.9380 – Level to be re-evaluated based on price behavior
Why This Setup Works:
✔ Price holding above a clear demand zone
✔ Bullish structure remains intact
✔ Upside momentum supported by controlled price action
Trade Management Insight:
Partial profit-taking at initial targets helps protect capital while allowing room for extended upside moves.
Execution Guidance:
Enter only after price shows acceptance or bullish confirmation within the buy zone. Patience improves precision.
Final Note:
As long as price respects the demand area, upside continuation remains the higher-probability scenario.
⸻
✨ Special Note for Serious Traders
If you value structured levels, calm execution, and professional risk control over emotional trading, feel free to connect. I work with traders who focus on consistency, not noise.
🔒 Professional approach. Disciplined risk. Sustainable growth.
EURCHF BEARISH CORRECTION AHEAD|SHORT|
✅EURCHF reacts inside a premium ICT supply, showing bearish displacement and rejection. Market structure favors downside as smart money distributes, with price likely to seek sell-side liquidity below recent lows. Time Frame 5H.
SHORT🔥
✅Like and subscribe to never miss a new idea!✅
