EUR/JPY | Between NWOGs! (READ THE CAPTION) As it can be seen in the 2H chart of EURJPY, it opened the week with a massive NWOG, and it has been testing and retesting the NWOG since the beginning of the week. It also has been stuck in the last week's NWOG, going through it then coming back to it like magnet several times. Currently it is being traded at 183.400, just barely above last week's NWOG high.
I expect EURJPY to retest this weeks NWOG relatively soon.
Targets for EURJPY: 183.440, 183,600, 183.760 and 183.920.
EURJPY

EURJPY H1 | Bullish Bounce Off Key SupportMomentum: Bullish
Price is currently above the ichimoku cloud.
Buy entry: 182.836
- Pullback support
- 78.6% Fib retracement
- 100% Fib projection
Stop Loss: 182.123
- Multi-swing low support
Take Profit: 183.602
- Multi-swing high resistance
High Risk Investment Warning
Stratos Markets Limited (fxcm.com/uk), Stratos Europe Ltd (fxcm.com/eu):
CFDs are complex instruments and come with a high risk of losing money rapidly due to leverage. 69% of retail investor accounts lose money when trading CFDs with this provider. You should consider whether you understand how CFDs work and whether you can afford to take the high risk of losing your money.
Stratos Global LLC (fxcm.com/en): Losses can exceed deposits.
Please be advised that the information presented on TradingView is provided to FXCM (‘Company’, ‘we’) by a third-party provider (‘TFA Global Pte Ltd’). Please be reminded that you are solely responsible for the trading decisions on your account. Any information and/or content is intended entirely for research, educational and informational purposes only and does not constitute investment or consultation advice or investment strategy. The information is not tailored to the investment needs of any specific person and therefore does not involve a consideration of any of the investment objectives, financial situation or needs of any viewer that may receive it. Past performance is not a reliable indicator of future results. Actual results may differ materially from those anticipated in forward-looking or past performance statements. We assume no liability as to the accuracy or completeness of any of the information and/or content provided herein and the Company cannot be held responsible for any omission, mistake nor for any loss or damage including without limitation to any loss of profit which may arise from reliance on any information supplied by TFA Global Pte Ltd.
Stratos Trading Pty. Limited (fxcm.com/au):
Trading FX/CFDs carries significant risks. FXCM AU (AFSL 309763), please read the Financial Services Guide, Product Disclosure Statement, Target Market Determination and Terms of Business at fxcm.com/au

EUR/JPY Market Analysis: Macro + Structure [MaB]1. The Macro Context (The "Why") 🌍
Hi traders! Before looking at the candles, let's look at the money.
My fundamental scoring table speaks clearly: there is a huge differential that we cannot ignore.
Key Factor Analysis:
🏦 Rate Expectations: Explanation: The BCE remains neutral with a trend holding stance and no clear bias in recent decisions, while the BOJ is the only hawkish central bank in the G7 with a recent +25bp hike and an aggressive stance. Score EUR: 0 Score JPY: +2
🎈 Inflation: Explanation: Eurozone inflation is at 2.14%, close to the 2% target, representing a controlled situation. JPY inflation at 2.91% is above target, justifying the BOJ's hawkish stance. Score EUR: 0 Score JPY: +1
📈 Growth/GDP: Explanation: Europe is facing worrying economic stagnation with a GDP of 0.7%. Japan's growth is also weak at 0.5%, which limits the space for overly aggressive rate hikes. Score EUR: -1 Score JPY: -1
🏭 PMI Data: Explanation: EUR PMI is neutral (weighted 50.65). JPY shows manufacturing expansion with a weighted PMI of 52.66. Score EUR: 0 Score JPY: +1
⚖️ Risk Sentiment: Explanation: Market is currently in a neutral regime; EUR is semi-cyclical and JPY is a safe-haven, but no significant risk-off flows are present. Score EUR: 0 Score JPY: 0
🗞️ News Catalyst: Explanation: Recent EUR CPI came in at 1.9% vs 2.0% expected, a moderate negative surprise. JPY benefits from exceptional hawkish policy momentum. Score EUR: 0 Score JPY: 0
Currency Score Summary:
Total Score EUR: -1 ( ) Total Score JPY: +2 ( )
Synthesis:
EUR (Weak, Score -1): The Euro is under pressure due to economic stagnation and a neutral central bank. JPY (Strong, Score +2): The Yen is strong, supported by a hawkish BOJ that stands out as an outlier in the G7. Conclusion: With this scenario, we are only looking for .
Going against this bias would be statistical suicide.
2. The Technical Setup (The "Where") 📉
Timeframe: 4h | Pair: EUR/JPY
The SMC Market Structure + Price Zones indicator gave us the confirmation we needed for our statistical edge.
Here is where the indicator makes the difference. Look at the dashboard on the right, numbers don't lie:
🚀 Continuation Rate (60%): We are exactly at the 60% threshold.
This tells us the market is in a healthy, directional trend.
Statistically, betting on continuation pays off more than looking for a reversal.
🔥 Streak (0) & Streak Pct: 2 We are at the start of a potential new leg after a period of correction.
It's a mature trend (we are in the 2nd percentile of trend extension), so watch those stop losses, but as long as the music plays, we dance.
🔄 Retest (85.4%): The indicator tells us that statistically, when price creates a new Break of Structure (BOS), it retraces into the previous zone 85.4% of the time.
Therefore, it pays to wait for a deep retracement into the supply zone to maximize our Risk/Reward ratio.
💥 BOS/Ret Rate (41.5%): This parameter tells us that once price retraces inside the previous zone, it has a 41.5% probability of reacting and creating a new BOS.
🎯 Extension Rate (1.82x): The algorithm projects an ambitious target.
We expect this move to extend 1.82 times the current pullback leg. That's where we'll take profit.
3. Execution Plan on Chart
Moving to the chart, the SMC Market Structure + Price Zones indicator supports us in pinpointing liquidity to define entry and stop loss:
Entry and Stop Loss: We place a limit entry in the Supply Zone 4h (Red Band) and the stop loss a few pips above the zone.
Take Profit: We leverage the asset's statistical analysis offered by the Extension Rate and place the target by measuring with Fibonacci at 1.8x relative to the pullback leg.
Trade Parameters:
Entry Price: 185.416 Stop Loss: 186.181 Take Profit: 178.850
⚠️ Disclaimer: This analysis is based on a proprietary algorithm and is shared exclusively for educational and didactic purposes.
It does not constitute financial advice or investment solicitation in any way. Trading involves significant risk.

#EURJPY , Gonna be sweet with us ?📊 Morning Market Brief | London Session Prep
🔎 Instrument Focus: #EURJPY
⚠️ Risk Environment: High
📈 Technical Overview:
Not a Quality Setup , if it Moves Perfectly will take it , if not .... just let it go
🚀 Trading Plan:
• Need Valid momentum Structure over the POI
• LTF ENTRY NEEDED
• Just and Only for QuickScalp
🧠 Stay updated with real time news and macro events, visit 👉 @News_Ash_TheTrader_Bot
#Ash_TheTrader #Forex #EURUSD #MarketInsight #PriceAction #TradingPlan #RiskManagement #LondonSession #Scalping #Futures #NQ #Gold

EURJPY Sellers In Panic! BUY!
My dear followers,
I analysed this chart on EURJPY and concluded the following:
The market is trading on 182.77 pivot level.
Bias - Bullish
Technical Indicators: Both Super Trend & Pivot HL indicate a highly probable Bullish continuation.
Target - 183.96
About Used Indicators:
A super-trend indicator is plotted on either above or below the closing price to signal a buy or sell. The indicator changes color, based on whether or not you should be buying. If the super-trend indicator moves below the closing price, the indicator turns green, and it signals an entry point or points to buy.
Disclosure: I am part of Trade Nation's Influencer program and receive a monthly fee for using their TradingView charts in my analysis.
———————————
WISH YOU ALL LUCK

EUR/JPY: Wave 5 Completed, ABC Correction AheadEUR/JPY has completed a strong bullish impulsive move, finishing a full five-wave Elliott Wave structure to the upside. The recent highs suggest that Wave 5 is likely complete, which often signals the end of a trend phase. After such a move, the market usually shifts into a corrective phase, and the chart shows the start of an A-B-C correction. Price is expected to move lower first into Wave (A), followed by a bounce in Wave (B), and then another decline in Wave (C). As long as price remains below the recent high near 186.9, the bias is short-term bearish, with downside targets around the 179–176 zone. This pullback would be a normal and healthy correction after a long rally, not a trend reversal yet.
Targets
Wave (A) target: 179.5 – 178.0
Wave (C) target (if correction extends): 176.0 area
Stop-Loss
Above recent high: 186.90
Invalidation Level
Daily close above 186.90
Stay tuned!
@Money_Dictators
Thank you :)

EURJPY On The Rise! BUY!
My dear followers,
This is my opinion on the EURJPY next move:
The asset is approaching an important pivot point 182.48
Bias - Bullish
Technical Indicators: Supper Trend generates a clear long signal while Pivot Point HL is currently determining the overall Bullish trend of the market.
Goal - 183.75
About Used Indicators:
For more efficient signals, super-trend is used in combination with other indicators like Pivot Points.
Disclosure: I am part of Trade Nation's Influencer program and receive a monthly fee for using their TradingView charts in my analysis.
———————————
WISH YOU ALL LUCK

GBP/JPY | What's ahead? (READ THE CAPTION)As you can see in the 2h chart of GBPJPY, 2 weeks ago it went up high all the way to 214.85 and then a dramatic fall, filling last weeks NWOG completely, and it touched the low of this week's NWOG before dropping again. Currently it's being traded at 210.40 and I expect it to retest last week's NWOG relatively soon.

EURJPY (183.6+ - 184.300)Eurjpy looking to target its highs and reach 183.6+ and then cross (184.000) this is due to it dropping for a very long time now it’s a turn to the upside because of price , we can expect nice bullish momentum to the upside and the expected high for the day is (184.2+)

USD/JPY | retesting! (READ THE CAPTION)As you can see in the 4h chart of USDJPY, it dropped further down to 152.090, hitting all 4 bearish targets from the last USDJPY analysis, to anyone who used it, cheers. 🍻
USDJPY is currently being traded at 153.48, bouncing back up after hitting the high of the Bullish OB.
USDJPY has tested the Bearish Breaker twice now and I expect it to retest it one more time.
The bullish targets are: 153.600, 153.750, 153.90, 154.05 and 154.200.
If it fails at retesting the bearish breaker the next targets would be as follows: 153.400, 153.250, 153.100 and 152.950

50% Fib resistance ahead?EUR/JPY is rising towards the resistance level whihc is a pullback resistance that aligns with the 50% Fibonacci retracement and could reverse from this level to our take profit.
Entry: 184.38
Why we like it:
There is a pullback resistance that aligns with the 50% Fibonacci retracement.
Stop loss: 186.39
Why we like it:
There is a swing high resistance level.
Take profit: 181.42
Why we like it:
There is an overlap support level.
Enjoying your TradingView experience? Review us!
Please be advised that the information presented on TradingView is provided to Vantage (‘Vantage Global Limited’, ‘we’) by a third-party provider (‘Everest Fortune Group’). Please be reminded that you are solely responsible for the trading decisions on your account. There is a very high degree of risk involved in trading. Any information and/or content is intended entirely for research, educational and informational purposes only and does not constitute investment or consultation advice or investment strategy. The information is not tailored to the investment needs of any specific person and therefore does not involve a consideration of any of the investment objectives, financial situation or needs of any viewer that may receive it. Kindly also note that past performance is not a reliable indicator of future results. Actual results may differ materially from those anticipated in forward-looking or past performance statements. We assume no liability as to the accuracy or completeness of any of the information and/or content provided herein and the Company cannot be held responsible for any omission, mistake nor for any loss or damage including without limitation to any loss of profit which may arise from reliance on any information supplied by Everest Fortune Group.

EURJPY H4 | Could We See A Bullish Reversal?Based on the H4 chart analysis, we can see that the price has bounced off our buy entry level at 182.42, which his an overlap support.
Our stop loss is set at 181.36, which is a pullback support.
Our take profit is set at 184.77, which is a pullback resistance.
High Risk Investment Warning
Stratos Markets Limited fxcm.com Stratos Europe Ltd fxcm.com
CFDs are complex instruments and come with a high risk of losing money rapidly due to leverage. 69% of retail investor accounts lose money when trading CFDs with this provider. You should consider whether you understand how CFDs work and whether you can afford to take the high risk of losing your money.
Stratos Global LLC fxcm.com Losses can exceed deposits.
Please be advised that the information presented on TradingView is provided to FXCM (‘Company’, ‘we’) by a third-party provider (‘TFA Global Pte Ltd’). Please be reminded that you are solely responsible for the trading decisions on your account. Any information and/or content is intended entirely for research, educational and informational purposes only and does not constitute investment or consultation advice or investment strategy. The information is not tailored to the investment needs of any specific person and therefore does not involve a consideration of any of the investment objectives, financial situation or needs of any viewer that may receive it. Past performance is not a reliable indicator of future results. Actual results may differ materially from those anticipated in forward-looking or past performance statements. We assume no liability as to the accuracy or completeness of any of the information and/or content provided herein and the Company cannot be held responsible for any omission, mistake nor for any loss or damage including without limitation to any loss of profit which may arise from reliance on any information supplied by TFA Global Pte Ltd.
Stratos Trading Pty. Limited fxcm.com
Trading FX/CFDs carries significant risks. FXCM AU (AFSL 309763), please read the Financial Services Guide, Product Disclosure Statement, Target Market Determination and Terms of Business at fxcm.com

EURUSD: flight from USD🛠 Technical Analysis: On the H1 chart, EURUSD remains in a clean ascending channel, holding a bullish structure after the sharp impulse move higher. Price is now consolidating just under the recent swing high, suggesting a potential continuation if the channel holds. The SMA cluster (50/100/200) sits below price, supporting the uptrend. A pullback into the 1.1866 area can serve as a retest entry for a push toward the upper channel boundary near 1.1923.
———————————————
❗️ Trade Parameters (BUY)
———————————————
➡️ Entry Point: 1.18663
🎯 Take Profit: 1.19235
🔴 Stop Loss: 1.18282
⚠️ Disclaimer: This is a potential trade idea based on current analysis; market conditions and price direction are subject to change based on news factors and volatility.

Stop!Loss|Market View: EURUSD🙌 Stop!Loss team welcomes you❗️
In this post, we're going to talk about the near-term outlook for the EURUSD currency pair☝️
Potential trade setup:
🔔Entry level: 1.19043
💰TP: 1.19701
⛔️SL: 1.18587
"Market View" - a brief analysis of trading instruments, covering the most important aspects of the FOREX market.
👇 In the comments 👇 you can type the trading instrument you'd like to analyze, and we'll talk about it in our next posts.
💬 Description: The US dollar remains under pressure early this week, and this trend is likely to continue until at least mid-week. Against this backdrop, euro buyers are effectively pushing toward resistance at 1.18960, which will likely lead to an upward breakout toward 1.19 and 1.2. A buy entry is being considered through a breakout.
Thanks for your support 🚀
Profits for all ✅

Could we see a reversal from here?EUR/JPY is reacting off the pivot, a pullback resistance slightly below it, which could reverse to the overlap support.
Pivot: 183.52
1st Support: 181.72
1st Resistance: 184.82
The opinions given above constitute general market commentary and do not constitute the opinion or advice of IC Markets or any form of personal or investment advice.
Any opinions, news, research, analyses, prices, other information, or links to third-party sites contained on this website are provided on an "as-is" basis, are intended to be informative only, and are not advice, a recommendation, research, a record of our trading prices, an offer of, or solicitation for, a transaction in any financial instrument and thus should not be treated as such. The information provided does not involve any specific investment objectives, financial situation, or needs of any specific person who may receive it. Please be aware that past performance is not a reliable indicator of future performance and/or results. Past performance or forward-looking scenarios based upon the reasonable beliefs of the third-party provider are not a guarantee of future performance. Actual results may differ materially from those anticipated in forward-looking or past performance statements. IC Markets makes no representation or warranty and assumes no liability as to the accuracy or completeness of the information provided, nor any loss arising from any investment based on a recommendation, forecast, or any information supplied by any third party

GBPJPY: targets at 214 and 216🛠 Technical Analysis: On the H4 chart, GBPJPY remains in a clear ascending channel, keeping the broader bullish structure intact. Price is currently in a pullback toward the 211.8–210.9 support area, where buyers previously defended momentum. The SMA cluster (50/100) is nearby and can act as a pivot—holding above support favors a continuation push. A sustained rebound from this zone opens the path back toward the 214.25 resistance, with the channel top as a potential extension.
———————————————
❗️ Trade Parameters (BUY)
———————————————
➡️ Entry Point: 212.238
🎯 Take Profit: 214.249
🔴 Stop Loss: 210.874
⚠️ Disclaimer: This is a potential trade idea based on current analysis; market conditions and price direction are subject to change based on news factors and volatility.

EURJPY — Textbook Trend Since 2020… Now Reversal Risk Is RisingSince the 2020 local low near 114, EURJPY has been trading in a strong bullish trend. More importantly, from 2022 onward, the pair spent nearly two full years moving inside a clean, textbook ascending channel.
In the summer of 2024, after reaching the upper boundary of that channel, EURJPY corrected aggressively and, in less than a month, dropped into 155.
That level became a major support.
After printing that local low, the pair entered a 1,000-pip range, with a very strong floor around 155 acting as the base of demand.
By late February 2025, EURJPY returned to support again — and from that point, for almost a full year, price resumed the uptrend and eventually printed a new ATH last week at 187.10.
Then Friday hit.
A violent sell-off began, and the pair is now dropping toward the lower boundary of the recent rising channel.
🔎 Why EURJPY Is Now a Short Candidate
As mentioned in my latest JPY Index analysis, I’m expecting the JPY to finally enter a recovery phase — which makes JPY crosses strong candidates for correction.
EURJPY stands out immediately because it’s:
✅ heavily extended
✅ technically stretched
✅ and sitting at potential “end-of-trend” conditions
📌 Key Notes From the Bigger Picture
There are a few important things worth highlighting:
1️⃣ On the higher timeframes, ignoring intraday spikes, EURJPY has respected structure almost perfectly — like something taken from a technical analysis textbook.
2️⃣ I expect this technical behavior to continue going forward.
3️⃣ The first ascending channel had roughly a 1,500-pip width, which is normal for a healthy trend.
4️⃣ The more recent channel is much tighter — almost half the size.
And in my experience, this leads to reversal.
🎯 Outlook & Targets
As long as price remains below the recent ATH, I see the risk shifting toward a broader reversal.
On the bigger picture, the “normal” corrective target becomes:
➡️ 166 zone
At the same time, we must keep in mind the previous key area:
📌 175 zone (old ATH / major reference level)
✅ Conclusion
Even without holding trades all the way to bigger targets, the key here is simple:
👉 a good short entry under ATH can offer excellent risk-to-reward
And even a controlled correction can realistically produce:
✅ 500+ pips
with the right entry and discipline.

JPY Index — Reversal Signal Confirmed. EurJpy&GbpJpy in focusA week ago, I argued that a strong reversal could be next for JPY pairs, based on one key observation:
✅ the JPY Index was trading at an all-time low, but price action was contained inside a falling wedge — a pattern that often signals trend exhaustion and a reversal just around the corner.
And as always, the market did what it does best…
👉 it made one more new low, just to shake everyone out, before reversing.
🔥 Friday: The First Real Confirmation
Friday delivered a very important technical signal: a strong bullish engulfing candle
and even more importantly…
✅ a close above the descending trendline of the falling wedge
That’s a key detail, because wedge breaks matter only when the market accepts above the structure, not when it simply spikes and fades.
📈 Today: Gap Up and Strong Continuation
Today, the market opened with a clear gap above horizontal resistance and is trading strongly to the upside.
This is exactly how a real reversal begins:
- break the structure
- reclaim the level
- continue with momentum
✅ Going Forward: I Expect JPY Strength to Continue
From this point, I expect the JPY recovery / strength to extend further.
Which means my focus shifts to the pairs that can “pay” the best if JPY strengthens:
👉 EURJPY
👉 GBPJPY
📌 Trading Plan
My plan is simple:
✅ Sell rallies in EURJPY and GBPJPY as long as JPY strength remains the dominant theme.
If this reversal continues to develop, these crosses have the potential to deliver powerful downside corrections. 🚀

EURJPY: Long term buy setupEURJPY: Long term buy setup. Enjoy this setup. A sign of weakness in bearish move, is the trigger.
Cheers

kvmev - EURJPY - 25/01/2026 - 30/01/2026Strong pullback on EJ, market structure is overall bullish creating HH's and is respecting the ascending trendline. Looking to take long positions upon strong rejection of zone below current price and trendline.

EURJPY Will Go Higher! Buy!
Take a look at our analysis for EURJPY.
Time Frame: 2h
Current Trend: Bullish
Sentiment: Oversold (based on 7-period RSI)
Forecast: Bullish
The market is approaching a significant support area 184.306.
The underlined horizontal cluster clearly indicates a highly probable bullish movement with target 185.387 level.
P.S
Please, note that an oversold/overbought condition can last for a long time, and therefore being oversold/overbought doesn't mean a price rally will come soon, or at all.
Like and subscribe and comment my ideas if you enjoy them!

EURJPY: Bullish Push to 184.9?FX:EURJPY is eyeing a bullish continuation on the 4-hour chart , with price consolidating near major resistance levels after rebounding from support, converging with cumulative sell liquidation that could fuel upside momentum if buyers break through amid recent volatility. This setup indicates a potential rally opportunity post-pullback, targeting higher levels with risk-reward exceeding 1:2 .🔥
Entry between 182.6–183.0 for a long position (entry at current levels with proper risk and capital management is recommended). Target at 184.9 . Set a stop loss at a daily close below 182.1 , yielding a risk-reward ratio of more than 1:2 . Monitor for confirmation via a bullish candle close above entry with increasing volume, capitalizing on the pair's upward bias near key levels.🌟
Fundamentally , EURJPY is trading around 183 in late December 2025, with thin holiday markets this week due to Christmas (December 25) leading to low volumes and potential volatility. For the Euro, no major high-impact events, though the holiday closure could amplify moves. For the Yen, Tuesday December 23 at 11:50 PM UTC brings BoJ October Meeting Minutes, which may provide insights into recent rate hike decisions and future policy, potentially pressuring JPY if dovish. Overall, holiday dynamics and BoJ signals could favor volatility favoring EUR upside if no surprises. 💡
📝 Trade Setup
🎯 Entry (Long):
182.6 – 183.0
(Entry at or near current levels is valid with strict risk & capital management.)
🎯 Target:
184.9
❌ Stop Loss:
• Daily close below 182.1
⚖️ Risk-to-Reward:
• > 1:2
⚠️ Risk Warning:
This is a high-risk trade due to the high probability of BoJ intervention aimed at strengthening the yen.

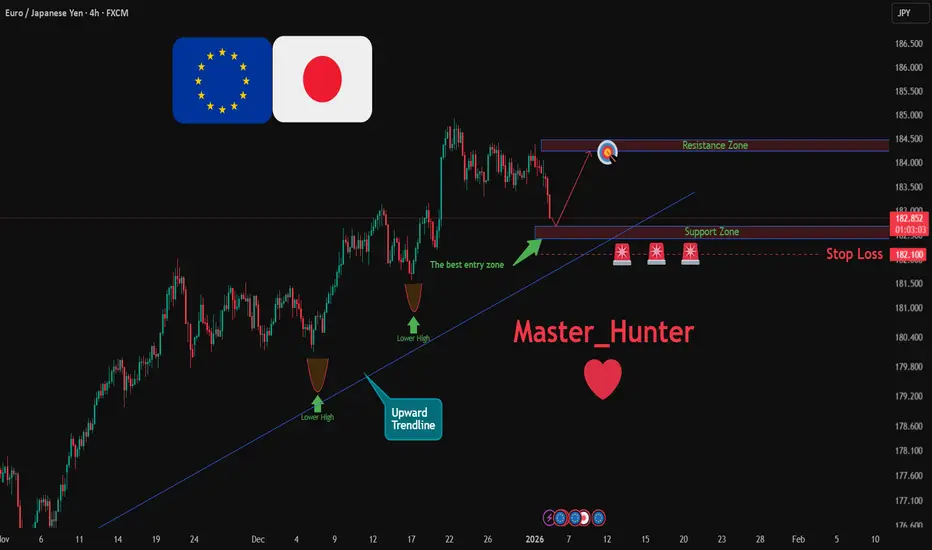
EURJPY: Bullish Push to 184.24?FX:EURJPY is eyeing a bullish continuation on the 4-hour chart , with price bouncing from an upward trendline near lower high, converging with a potential entry zone at support that could fuel upside momentum if buyers hold amid recent consolidation. This setup indicates a rally opportunity post-pullback, targeting higher resistance levels with risk-reward exceeding 1:2.5 .🔥
Entry between 182.43–182.69 for a long position (entry from current price with proper risk management is recommended). Target at 184.24 . Set a stop loss at a daily close below 182.1 , yielding a risk-reward ratio of more than 1:2.5 . Monitor for confirmation via a bullish candle close above entry with increasing volume, capitalizing on the pair's upward bias near key levels.🌟
Fundamentally , EURJPY is trading around 182.9 in early January 2026, with key events this week including Wednesday's Eurozone HICP Flash (Dec) for preliminary inflation data that could strengthen EUR if higher than expected, signaling ECB hawkishness; and Thursday's ECB SCE (Spring Consensus Expectations) for economic projections that may boost EUR on positive outlooks. For JPY, Monday's Japanese PMI Final (Dec) could weaken the yen if revised lower, indicating manufacturing contraction. Overall, stronger Euro data versus soft JPY readings could favor upside in EURJPY amid low holiday volume. 💡
📝 Trade Setup
🎯 Entry (Long):
182.43 – 182.69
(Entry from current price is valid with proper risk & position sizing.)
🎯 Target:
• 184.24
❌ Stop Loss:
• Daily close below 182.10
⚖️ Risk-to-Reward:
• > 1:2.5
💡 Your take?
Does EURJPY extend toward 184.24, or do you expect deeper consolidation before the next push higher? 👇