EURJPY Sell Trading Opportunity SpottedH1 - Strong bearish momentum followed by a pullback
Two Solid Resistance Levels
Trend continuation very likely after pullback.
👉 If you enjoy this analysis, please Like, Follow, and Support the profile! Your engagement motivates us to share more quality setups.
Eurjpyidea

EURJPY - Looking To Sell Pullbacks In The Short TermH1 - Strong bearish move.
No opposite signs.
Currently it looks like a pullback is happening.
Expecting bearish continuation until the two strong resistance zones hold.
If you enjoy this idea, don’t forget to LIKE 👍, FOLLOW ✅, SHARE 🙌, and COMMENT ✍! Drop your thoughts and charts below to keep the discussion going. Your support helps keep this content free and reach more people! 🚀

EUR/JPY Price Outlook – Trade Setup📊 Technical Structure
TICKMILL:EURJPY EUR/JPY staged a sharp rebound after briefly breaking below the 183.20–183.30 support zone, forming a clear false breakdown structure. Price was quickly rejected from the downside and recovered back above the support area, indicating strong buying interest at lower levels.
Currently, the pair is holding above 183.50, suggesting a short-term bullish recovery phase is underway. As long as price remains supported above the key demand zone, the technical structure favours a continuation toward the upper resistance band rather than a renewed sell-off.
🎯 Trade Setup (Bullish Bias)
Entry Zone: 183.20 – 183.35
Stop Loss: 183.17
Take Profit 1: 183.75
Take Profit 2: 183.88
Risk–Reward Ratio: Approx. 1 : 2.42
📌 Invalidation
A sustained break and close below 183.00 would invalidate the bullish rebound setup and shift the short-term bias back to the downside.
🌐 Macro Background
On the macro side, the Euro has found near-term support after the European Union signalled coordinated efforts to counter potential U.S. tariff actions, helping stabilize sentiment toward the single currency.
Meanwhile, the Japanese Yen remains vulnerable despite repeated verbal warnings from Japanese officials regarding potential intervention. Weak Japanese industrial production data has also weighed on JPY fundamentals, reducing downside pressure on EUR/JPY and allowing technical rebounds to develop more easily at key support levels.
Overall, the macro backdrop does not contradict the current technical rebound structure.
🔑 Key Technical Levels
Resistance Zone: 183.75 – 183.88
Support Zone: 183.20 – 183.30
Bullish Invalidation: Below 183.17
📌 Trade Summary
EUR/JPY has rejected the lower support zone and regained upward traction. As long as price holds above 183.20, the short-term bias favours a buy-on-dips approach, targeting a rebound toward the upper resistance area.
⚠️ Disclaimer
This analysis is for reference only and does not constitute investment or trading advice. Financial markets involve risk, and traders should manage positions according to their own risk tolerance.

TheGrove | EURJPY Buy | Idea Trading AnalysisEURJPY is moving on Resistance zone..
The chart is above the support level, which has already become a reversal point twice.
We expect a decline in the channel after testing the current level.
We expect a decline in the channel after testing the current level
Hello Traders, here is the full analysis.
I think we can soon see more fall from this range! GOOD LUCK! Great SELL opportunity EURJPY
I still did my best and this is the most likely count for me at the moment.
-------------------
Traders, if you liked this idea or if you have your own opinion about it, write in the comments. I will be glad ⚜️

EUR /JPY Ready To Go Up And Give Us 150 Pips , Fake Or True ?Here is my 4H Chart on EUR /JPY , We Have A Clear Breakout and the price closed above my old res and new support and we have a very good bullish Price Action on 1 And 2 And 4 Hours T.F Also , the price will try to retest the area and if it give us a good bullish price action on smaller time frames we can enter a buy trade and we can targeting from 100 to 150 pips . and i prefer to have a daily closure above the broken res to be sure that it`s not a fake breakout , and if we have a daily closure again below my new res then this idea will not be valid anymore .
Entry Reasons :
1- Clear Breakout
2- Many T.F Confirmations .
3- Perfect Price Action

EURJPY S C A L P Eurjpy Buy @ 182.970
TP1 : 183.050
TP2 : 183.100
TP3 : 183.180
TP4 : 183.222
SL : 182.490
Trade Requirements : (50/50 + Partials)

EUR/JPY Bullish Setup Ahead – Are You Riding the YUPPY Wave?💶 EUR/JPY “YUPPY” Profit Pathway Setup (Swing/Day Trade)
📊 Market Outlook
The EUR/JPY (YUPPY) pair is showing a bullish structure, confirmed by a HULL Moving Average pullback and a Triangular Moving Average breakout. Momentum is clearly shifting north — the bulls are loading up, and the market looks ready to dance higher. 🎯
🧠 Thief’s Plan
Our Thief Strategy uses a layering-style entry system — meaning multiple limit orders stacked across different price levels for better precision and reduced risk.
Here’s the playbook:
Buy Limit Layers:
🟩 176.200
🟩 176.400
🟩 176.800
🟩 177.000
(You can extend your limit layers based on your own risk appetite or conviction.)
Stop Loss (Thief SL): 📉 175.800
⚠️ Note: Dear Ladies & Gentlemen (Thief OG’s) — I’m not recommending you to use my SL. Trade responsibly and set your own protection based on your risk plan.
Target Zone: 🎯 178.700
The 179.000 level is a police barricade zone 🚧 — strong resistance, overbought signals, and potential trap area. So, take profits before the “market cops” show up! 👮♂️
⚠️ Note: Dear Ladies & Gentlemen (Thief OG’s) — same applies here! Take profits wisely at your own discretion.
🧩 Key Technical Highlights
Bullish bias confirmed by HULL MA + Triangular MA crossover.
Price structure forming higher lows — classic accumulation before expansion.
Momentum divergence fading — bullish pressure regaining strength.
Ideal for swing or day trading strategies.
🔄 Related Pairs to Watch
These pairs often correlate with EUR/JPY movements — keep an eye for confirmation or divergence:
💵 USD/JPY ( FX:USDJPY ) → Yen sentiment indicator; if JPY weakens, EUR/JPY tends to rise.
💶 EUR/USD ( FX:EURUSD ) → Tracks Euro strength; helps validate bullish bias.
💰 GBP/JPY ( OANDA:GBPJPY ) → Cross-check risk sentiment in other JPY pairs.
DXY ( TVC:DXY ) → Dollar Index; a stronger DXY can dampen Euro moves, so watch inverse correlation.
🧭 Thief’s Professional Take
The “YUPPY” is preparing for a northbound joyride 🚀 — but patience is key! Let price come to your layered entries. Manage your risk like a professional thief: smooth, smart, and stealthy. 🎭
✨ “If you find value in my analysis, a 👍 and 🚀 boost is much appreciated — it helps me share more setups with the community!”
#EURJPY #ForexAnalysis #SwingTrade #DayTrade #ThiefStrategy #TechnicalAnalysis #FXMarket #HullMA #TriangularMA #LayeredEntries #SmartMoney #PriceAction #TradeSetup #MarketOutlook #TradingViewCommunity #ForexTraders #RiskManagement

EURJPY Breaks Structure: The Key Pullback Level I’m Waiting For📊 I’m currently watching EUR/JPY closely. The pair has broken structure to the upside, showing clear bullish intent 🔼. However, when we compare price to the VWAP, it’s noticeably overextended 📈.
📉 On the volume profile, price has pushed through a major resistance level — the Point of Control — which has now flipped into an important value area acting as support 🟩.
🔍 Because price is stretched, I want to see a pullback into this support zone, hold firmly there, then deliver a fresh bullish break followed by a retest of the current range. If EUR/JPY stabilises and holds above the volume profile levels, I’ll be watching for a long opportunity 💰.
⚠️ Not financial advice.

EURJPY - Looking To Sell Pullbacks In The Short TermH4 - Strong bearish move.
Bearish convergence.
No opposite signs.
Expecting bearish continuation after pullback until the strong resistance zone holds.
If you enjoy this idea, don’t forget to LIKE 👍, FOLLOW ✅, SHARE 🙌, and COMMENT ✍! Drop your thoughts and charts below to keep the discussion going. Your support helps keep this content free and reach more people! 🚀

EUR/JPY Gave Fake Breakout , Short Setup Valid To Get 200 Pips !Here is my 2H Chart on EUR/JPY , We Have A Fake Breakout and then the price Back below my old res and we have a very good bearish Price Action on 2 And 4 Hours T.F Also the price playing very good around my res and i`m waiting the price to retest the broken area and giving me a good bearish price action on smaller time frames to can get a confirmation to enter , So i see it`s a good chance to sell this pair if it go up a little to retest the broken area and then we can sell it and targeting 100 to 200 pips . and if we have a daily closure again above my new res then this idea will not be valid anymore .
Reasons To Enter :
1- Perfect Breakout .
2- Clear Bearish Price Action .
3- Bigger T.F Giving Good Bearish P.A .
4 - Perfect 15 Mins Closure .
5- The Price Respect The Res Again .

EURJPY - Looking To Sell Pullbacks In The Short TermH1 - Strong bearish move.
Bearish convergence.
No opposite signs.
Expecting bearish continuation after pullback until the strong resistance zone holds.
If you enjoy this idea, don’t forget to LIKE 👍, FOLLOW ✅, SHARE 🙌, and COMMENT ✍! Drop your thoughts and charts below to keep the discussion going. Your support helps keep this content free and reach more people! 🚀

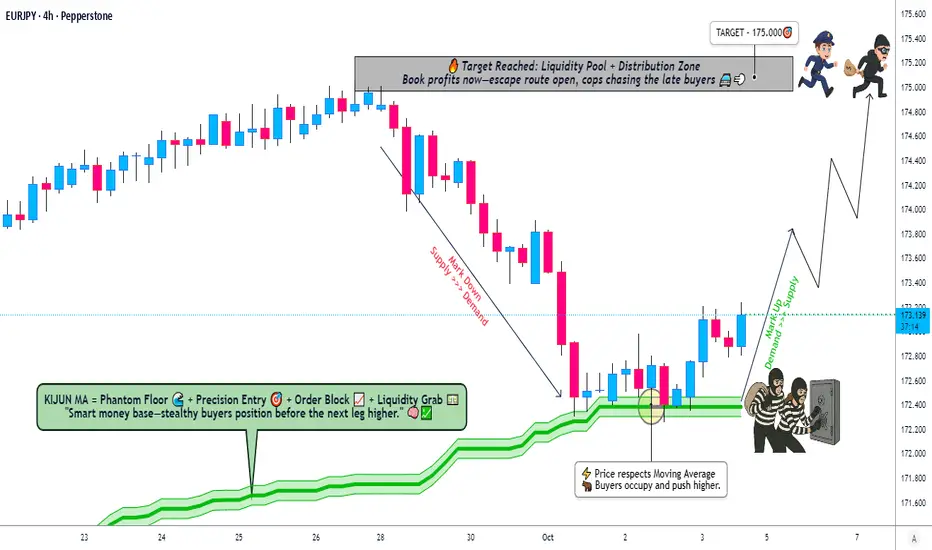
Is EURJPY Setting Up for a Powerful Bullish Run?🎯 EUR/JPY: "Euro vs. Yen" Wealth Heist Strategy 🤑 (Swing/Day Trade)
🚨 Thieves aka (Smart traders) of the Forex Market, Assemble! 🚨Get ready to pull off a slick bullish heist on EUR/JPY with this Thief-Style Trading Plan! We're leveraging a Kijun-Sen pullback to spot a juicy demand zone where the bulls are loading up to push prices higher. Let’s break into the market with style, precision, and a sprinkle of humor! 😎
📈 The Setup: Bullish Breakout Plan 🐂
Asset: EUR/JPY (Euro vs. Japanese Yen)
Market Context: The Kijun-Sen moving average (Ichimoku Cloud) has confirmed a bullish pullback, creating a demand zone at key support levels. Bulls are gathering strength to drive prices upward! 🚀
Trend: Swing/Day Trade with a bullish bias.
🕵️♂️ The Thief’s Entry Plan (Layered Limit Orders)
Our Thief Strategy uses multiple buy limit orders to layer entries like a mastermind stacking the deck. Here’s the plan:
Entry Levels:
🧳 172.400 (First layer, dip-buying opportunity)
🧳 172.600
🧳 172.800
🧳 173.000
Pro Tip: Feel free to add more layers based on your risk appetite and account size. Stack those orders like a pro! 📊
Entry Flexibility: You can enter at any price level within this demand zone, but layering ensures you maximize your position while managing risk.
🛑 Stop Loss: The Thief’s Escape Route
Stop Loss: Set at 172.000 (a tight, calculated exit to protect your loot).
Note: Dear Thieves (OGs and newbies alike), this SL is my suggestion, but it’s your heist, your rules. Adjust based on your risk tolerance and don’t get caught by the market police! 👮♂️
🎯 Take Profit: The Grand Getaway
Target: 175.000 (just shy of a strong resistance zone at 175.200).
Why?: The 175.200 level is a Police Barricade—a combo of strong resistance, overbought conditions, and a potential bear trap. Grab your profits at 175.000 to escape safely! 💰
Note: This TP is my call, but you’re the mastermind here. Take profits at your own discretion and secure the bag! 🤑
💡 Related Pairs to Watch (Correlations & Opportunities)
To make this heist even smoother, keep an eye on these correlated pairs for confirmation or additional setups:
FX:USDJPY : A strong bullish move in USD/JPY often supports EUR/JPY strength due to JPY weakness. Watch for similar demand zones or breakout patterns.
FX:EURUSD : If EUR is strong across the board, EUR/USD breakouts can reinforce our bullish bias on EUR/JPY. Check for alignment in trend direction.
OANDA:GBPJPY : Another JPY pair with high volatility. If GBP/JPY is also showing bullish momentum, it could signal broader JPY weakness, boosting our EUR/JPY play.
Key Correlation Insight: JPY tends to weaken in risk-on environments, so monitor global risk sentiment (e.g., equity indices like S&P 500 or Nikkei 225) for clues.
🔍 Key Points to Understand the Setup
Demand Zone Strength: The Kijun-Sen pullback aligns with historical support, making this a high-probability zone for bulls to step in.
Layered Entries: Using multiple limit orders reduces risk by averaging your entry price, perfect for volatile forex markets.
Risk Management: The tight stop loss at 172.000 keeps your downside limited, while the 175.000 target offers a solid risk-reward ratio (~1:10).
Market Traps: Be cautious at 175.200—overbought conditions and resistance could trigger a reversal. Exit early to avoid getting caught!
⚠️ Disclaimer
This is a Thief-Style Trading Strategy designed for fun and educational purposes. Trading involves risks, and you’re responsible for your own decisions. Always do your own analysis and manage your risk like a pro! 😎
✨ If you find value in my analysis, a 👍 and 🚀 boost is much appreciated — it helps me share more setups with the community!
#EURJPY #ForexTrading #SwingTrading #DayTrading #ThiefStrategy #BullishBreakout #TradingView
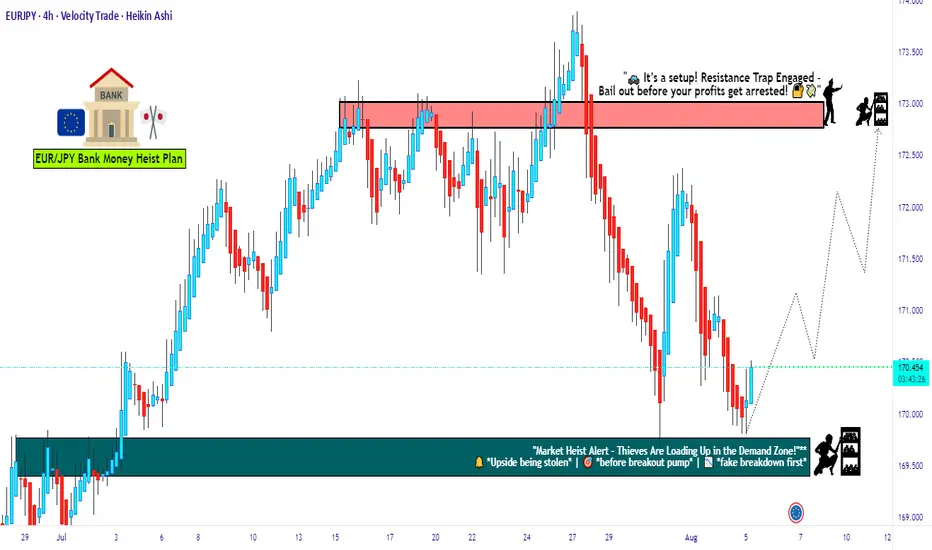
EUR/JPY Price Action Alert: Are Buyers Dominating?💰 EUR/JPY “EURO VS YEN” FOREX Market Wealth Strategy Map 🚀💹
Asset: EUR/JPY
Plan: Bullish confirmed ✅ with ACCUMULATION Zone and higher high Major Resistance Breakout.
Entry:
You can enter at any price level using the Thief layering strategy 💎:
Multiple buy limit layers: 173.700, 174.000, 174.300 (adjust your layers based on your own discretion).
This method allows flexible entries and maximizes profit potential.
Stop Loss (SL):
Thief SL @ 173.000 ⚡
Note: I recommend using your own SL based on your risk tolerance. Trading is always your responsibility.
Target (TP):
Electric shock fence ahead ⚡ acts as strong resistance + overbought trap.
Our suggested target is 176.000, but feel free to lock profits according to your own strategy.
Trading Style:
Swing / Day trade strategy
Thief OG layering style — multiple limit orders to maximize entries and risk management.
Pairs to Watch & Correlations:
FX:EURUSD – Strong correlation with EUR/JPY bullish moves; confirm strength in EUR first.
FX:USDJPY – Watch for Yen weakness; can accelerate EUR/JPY bullish breakout.
OANDA:GBPJPY – Often mirrors EUR/JPY trend in short-term swings; useful for confirmation.
OANDA:EURCHF – Supports Euro strength analysis; weaker CHF can boost EUR pairs.
Key Points / Notes:
Market structure is accumulation → breakout → trend continuation.
Keep an eye on resistance clusters and overbought levels.
Layering entries allow maximized profit and controlled risk.
Always trade responsibly; profits come with risk management.
✨ “If you find value in my analysis, a 👍 and 🚀 boost is much appreciated — it helps me share more setups with the community!”
#EURJPY #ForexTrading #SwingTrade #DayTrade #ForexStrategy #ThiefStyle #TradingViewIdeas #ForexAnalysis #LayeringStrategy #ForexSignals #EuroYen #FXTrade #ProfitPlanning

Ready To Raid The EUR/JPY? Bullish Breakout Plan Inside!🌟 ATTENTION ALL YEN YAKUZA & EURO EAGLES! 🌟
Dear Ladies & Gentleman of the High-Finance Underworld, 🕴️💎
Based on the 🔥ULTIMATE THIEF TRADING HEIST MANUAL🔥, here is the master plan to rob the EUR/JPY "The Yuppy" bank blind! This is a BULLISH pending order assault. Our aim is the luxurious 175.000 VIP Money Vault. 🏦💰✨
Entry: The Grand Heist Begins! ⚡
The Trigger: We wait for the BREAKOUT & HOLD above 173.000. This is when the guards change shifts! 🚨
The Layering Strategy (The Genius Move): The Thief doesn't just kick the door down; he picks all the locks at once! Place MULTIPLE BUY LIMIT ORDERS on any dip or retest to create a powerful average entry. Think like a pro!
1st Layer (The Decoy): @173.000 (After breakout confirm)
2nd Layer (The Bag Filler): @172.700
3rd Layer (The Masterstroke): @172.500
4th Layer (The Insurance Policy): @172.300
🤑 YOU CAN ADD MORE LAYERS BASED ON YOUR RISK APPETITE! 🤑
Stop Loss: The Escape Route! 🛑
"Yo, listen up! 🗣️" Do NOT set your stop loss until AFTER the 173.000 breakout is confirmed! The Thief's ultimate safety net is placed at @171.500. This is our emergency exit if the heist goes sideways.
⚠️ WARNING: You OG's can adjust this SL based on your own risk tolerance and number of layers. But remember, a real thief always has an exit plan! 👊😎
Target: The Getaway! 🎯
The police have set up a barricade at 175.500. We are not greedy! Our escape chopper is waiting at @175.000. GRAB THE STOLEN CASH AND GO! Don't wait for the cops! 🚁💵💨
⚠️TRADING ALERT: News Releases & Managing the Loot 📰🗞️
News can bring swat teams (volatility). To protect your stolen profits:
Avoid placing new layers during high-impact news.
Use a TRAILING STOP once we're in profit to lock in those stacks! 🔒💰
💖SUPPORT THE HEIST CREW!
💥SMASH THAT BOOST BUTTON!💥 It fuels our next grand robbery! Let's make stealing from the market look easy every single day. 🏆💪🤝❤️🎉🚀
I'll be back with another flawless plan. Stay sharp, stay profitable! 🤑🐱👤🤗🤩

EURJPY Resistance Ahead!
HI,Traders !
#EURJPY keeps going up
And the pair is locally oversold
So after it hits the horizontal
Resistance of 173.756 we
Will be expecting a local
Bearish correction !
Comment and subscribe to help us grow !

EURJPY - Short Term Sell IdeaM15 - Strong bearish move.
No opposite signs.
Currently it looks like a pullback is happening.
Expecting bearish continuation until the two Fibonacci resistance zones hold.
If you enjoy this idea, don’t forget to LIKE 👍, FOLLOW ✅, SHARE 🙌, and COMMENT ✍! Drop your thoughts and charts below to keep the discussion going. Your support helps keep this content free and reach more people! 🚀
-------------------------------------------------------------------------------------------------------------------

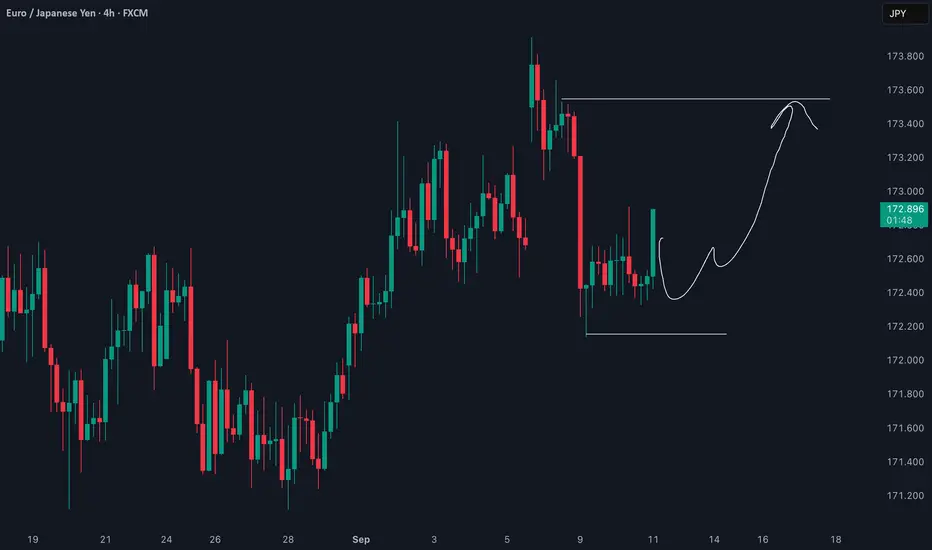
Bullish Structure Holds for EUR/JPY on the 4-Hour ChartEUR/JPY Technical Analysis
What we're looking at on this 4-hour chart is a classic example of a bullish trend undergoing a healthy correction and potentially preparing for its next move higher. The market is giving us some very clear clues. 🧐
1. Market Structure & Dominant Trend 📈
Overall Trend: The dominant, overarching trend is clearly bullish. Looking at the price action from late August through early September, the market has been consistently printing higher highs and higher lows. This is the primary context, and we generally want to trade in the direction of the main trend.
Corrective Phase: After reaching a peak around $173.80, the price experienced a sharp and aggressive sell-off. This is a typical corrective move or profit-taking phase after a strong impulse leg up.
Consolidation / Accumulation: Price has now stopped falling and is moving sideways, contained within a well-defined range. This is often a sign of accumulation, where buyers are absorbing selling pressure and building positions for a potential move higher.
2. Key Levels to Watch 🎯
Resistance 🛡️: The upper boundary of the current range is at approximately $173.55 - $173.60. This is the immediate ceiling that buyers need to break through to confirm a continuation of the uptrend. It's the "line in the sand" for the bears.
Support: The lower boundary is clearly defined around $172.15 - $172.20. This level has been tested and has held firm, showing that buyers are stepping in to defend this price. As long as we stay above this level, the bullish case remains intact.
Potential Double Bottom / Inverse Head & Shoulders: The price action within the consolidation range is carving out what looks like a Double Bottom or a potential Inverse Head and Shoulders pattern.
Bullish Intention: These are classic bullish reversal/continuation patterns. They signal that the downward momentum of the correction has been exhausted and that buyers are regaining control. The recent strong green candles moving away from the support zone reinforce this buying pressure.
4. Potential Scenarios 🚀 vs. 📉
Bullish Scenario (High Probability): This aligns with your projection. The price continues to respect the support level, completes the right side of the pattern, and breaks through the minor resistance within the range (around $173.00). A confirmed break and close above this level would likely propel the price towards the main resistance at $173.55. A break of that level would signal a full continuation of the bullish trend, with sights on new highs.
Bearish Scenario (Lower Probability): We must always consider the alternative. If buyers fail to push the price higher and we see a strong, decisive 4-hour candle close below the support at $172.15, the bullish setup would be invalidated. This would suggest that the correction is not over and could lead to a deeper move down towards the next major structural support levels.
This is a potential setup that favors the buyers. Patience and risk management are key.
EUR /JPY Near Strongest Res Area , Short Valid To Get 200 Pips !Here is my opinion on 4H EUR/JPY Chart , the price touch a very strong res area that forced the price to respect it and go down for more than 400 pips for 2 times , and Last Week the price touch it and moved 150 pips to downside so now i`m waiting the price to go back to retest the same area again and give me a good bearish price action to can enter a sell trade and we can targeting from 100 : 200 pips . if we have a daily closure above my res area this idea will not be valid anymore .
Entry Reasons :
1- Very Strong Daily Res Area .
2- Perfect Bearish Price Action .
3- Bigger Time Frames Confirmed .

EURJPY Is Overbought!
HI,Traders !
#EURJPY is trading in a
Strong uptrend and the pair
Will soon hit a horizontal
Resistance of 173.756
So after the retest a
Local bearish pullback
Is to be expected !
Comment and subscribe to help us grow !

EUR/JPY Setup: Thief Trader's Stealth Bull Run to 173.000🔥💶 EUR/JPY Bullish Heist Plan 💶🔥
🧠 New Plan Unlocked – The EUR/JPY Bullish Mission is LIVE!
Thief Trader style means: No noise, no fluff — just pure sniper precision with layered limit orders. 🧤🔫
This isn’t trading… it’s a planned market robbery 💼💣
🧩 Asset: EUR/JPY
📊 Strategy: Bullish Bias with Stealth Layered Entries (Limit Order Gameplan)
🎯 Target: 173.000 — That’s the vault we’re cracking!
🛑 Stop Loss: 169.100 — Tight security, keep your escape route clean.
📍 Entry: No fixed door — we’re setting traps (limit orders) across key levels. Patience pays thieves.
Watch for pullbacks on lower timeframes: 15m, 30m, or even 1H — strike near support bounces & fakeout wicks. 🐍💥
🔍 Thief Logic:
This ain’t random — price is setting up for a high-stakes move north with JPY weakness fueling the getaway car.
Think smart, layer deep — sniper entries, not shotgun chaos. 🎯🔍
📌 Notes from the Safe House:
Trade with position sizing discipline – the market doesn’t owe you.
News events are motion sensors — avoid them or stay light! 🕵️♂️📉
Use trailing SLs once in profit — secure the bag and vanish. 💼💨
💣 Ready to steal pips, not hope? Hit that 👍, drop a 💬, and join the crew.
This is Thief Trading — we don’t follow markets, we outsmart them. 🧠💵
Stay sharp, stay silent… profit loud. 🐱👤📈💸
🔥 Tap Boost. Support the Heist. Run the Charts. #ThiefTrader 🧤💰
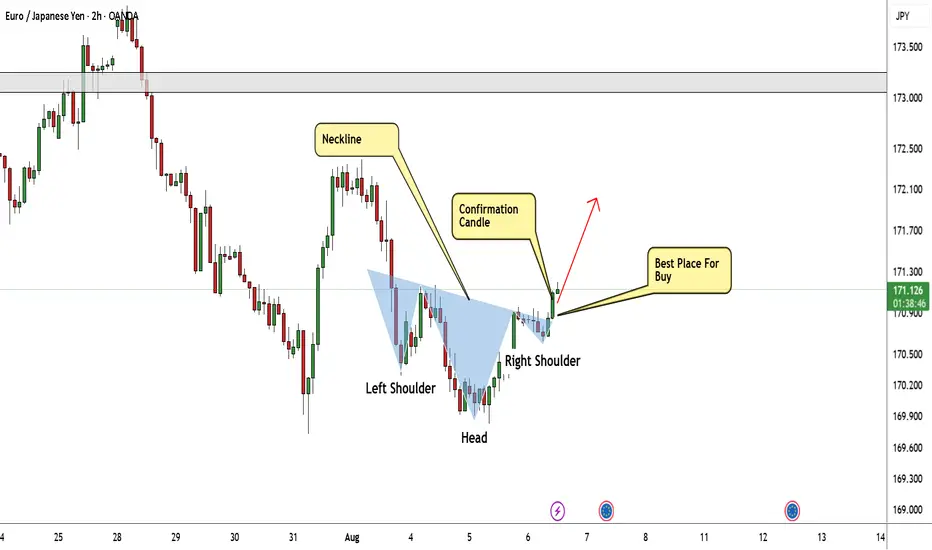
EUR/JPY Made Inverted H&S Pattern , Time To Buy And Get 150 PipsHere is my 2H Chart On EUR/JPY , The price created a very clear reversal pattern ( inverted head and shoulders pattern ) and the price closed above neckline so the pattern confirmed and we can buy it and targeting from 100: 200 pips , if we have a daily closure above 171.000 it will be a great confirmation telling us the price will continue to upside .
Trading the Pullback on EURJPY My Trade PlanThe EURJPY is clearly in a strong bullish trend 📈, as shown by a consistent pattern of higher highs and higher lows on the 1H timeframe ⏱️. In this video, I’m looking to capitalize on a pullback as a potential buy opportunity 🎯.
We dive into my entry strategy, explore how to align with the prevailing trend, and break down key concepts such as price action, market structure, and smart pullback zones 🧠📊.
⚠️ As always, this is for educational purposes only — not financial advice.

How I’m Trading the EURJPY Break of Structure Setup📈 EURJPY Analysis Update 🔍
I'm currently watching EURJPY closely. On the weekly timeframe, the pair is clearly in a strong bullish trend 🚀. Price has recently tapped into a previous daily bullish order block 🧱 — a key zone of interest.
Now, I’m watching for a break of structure (BoS) 📉 followed by a bullish continuation, especially if price pulls back into the fair value gap (FVG) 📊 near the current low.
As always, this setup — along with all key details and trade considerations — is fully broken down in the 🎥 video.
⚠️ This is for educational purposes only and not financial advice.
