EJ Scalp Trade IdeaEURJPY Trade Analysis
Pair: EUR/JPY
Exchange: FXCM
Timeframe: Unspecified (please add if needed)
Current Price: 182.450
Open: 182.465
High: 182.467
Low: 182.450
Close: 182.450
Change: -0.015 (-0.01%)
Date/Time: 05:03:37 AM UTC-5
Observations:
The price movement during this period was very tight, with a high of 182.467 and a low of 182.450, showing minimal volatility.
The close price matched the session low, which may signal minor bearish pressure.
Overall change for this interval is practically flat, indicating indecision in the market at this time.
Next Steps:
Monitor for a breakout from this consolidation range.
Keep an eye on larger timeframes for confirmation before entering new trades.
Consider risk management due to low volatility, which could lead to a spike soon.
Disclaimer: This is not financial advice. Please conduct your own research before making any trading decisions.
Eurjpyshort

Short OPP on EUR JPY According to Breakout of Uptrend line
According to Fibo Retracement
According to Convergence
According to Gap

EUR/JPY 30M: High-Probability Short Setup & Supply Reversal Zone📉 EUR/JPY 30M: High-Probability Short Setup at Supply Reversal Zone
📝 Market Overview and Trend Context
The EUR/JPY pair is currently in a phase of strong recovery following a significant drop from a prior high established around the 181.400 level. This sharp, corrective rally (indicated by the upward price action starting December 2nd) is now approaching a critical area of unmitigated institutional supply.
The analysis focuses on exploiting the expected resumption of the selling pressure from this proven zone, treating the current bullish move as a deep retracement into an area where prior sellers initiated their positions.
🔑 Key Zones for Institutional Order Flow
The chart highlights two confluent zones that form the basis of the short hypothesis:
1. Reversal Zone / Volume Burst 🔴
Zone Location: This is the combined area (green and light-red boxes) spanning approximately 181.250 to 181.400.
Significance: This area is the precise origin of the prior sharp move down, making it a high-quality Supply Zone where a large concentration of selling orders is expected to reside.
The lower part, labeled "Reversal Zone", is the critical price level where resistance is first expected.
The upper part, "Volume Burst", represents the last opportunity for sellers to defend the price before the structure is broken.
Technical Confluence: The prior structural high is situated just above this zone, making it a key area of defense for existing sellers and a target for liquidity grabs.
2. Order Flow Origin (OFR)
Location: The level around 180.400.
Significance: This marks the point from which the previous aggressive move originated. While not an immediate target, a successful short trade from the supply zone would ultimately aim to break this lower structural point, confirming a shift in market control back to the bears.
📊 Trading Hypothesis: Shorting the Supply Test
The trade plan anticipates a rejection from the institutional supply zone:
Direction: Short (Sell)
Entry Strategy: Entry is optimal upon price tapping the Reversal Zone (starting around 181.250). Crucially, the chart demands a "Bearish Pattern Must" confirmation. This means traders should drop to a lower timeframe (e.g., 5M or 15M) and wait for a clear bearish reversal pattern (e.g., bearish engulfing candle, a double top on the smaller timeframe, or a break of minor structure) before initiating the short trade.
Stop Loss (S/L): The Stop Loss must be placed securely above the entire Volume Burst area (e.g., above 181.450). This placement protects the trade against a clear invalidation of the supply structure.
Take Profit (T/P) 1 (Initial Target): A strong initial target is the current swing low or the next clean demand zone, typically in the 180.700 area.
Take Profit (T/P) 2 (Continuation Target) : If price aggressively breaks T/P 1, the ultimate target is a run towards the OFR low around 180.400, confirming a full reversal of the recent bullish momentum.
⚠️ Risk Management and Invalidation
The greatest risk to this setup is the continuous bullish momentum breaking the prior high. A confirmed close above the Volume Burst zone (181.400) would signal a continuation of the bullish trend and invalidate the short setup. Adherence to the "Bearish Pattern Must" entry condition is paramount for reducing risk and avoiding false early entries.

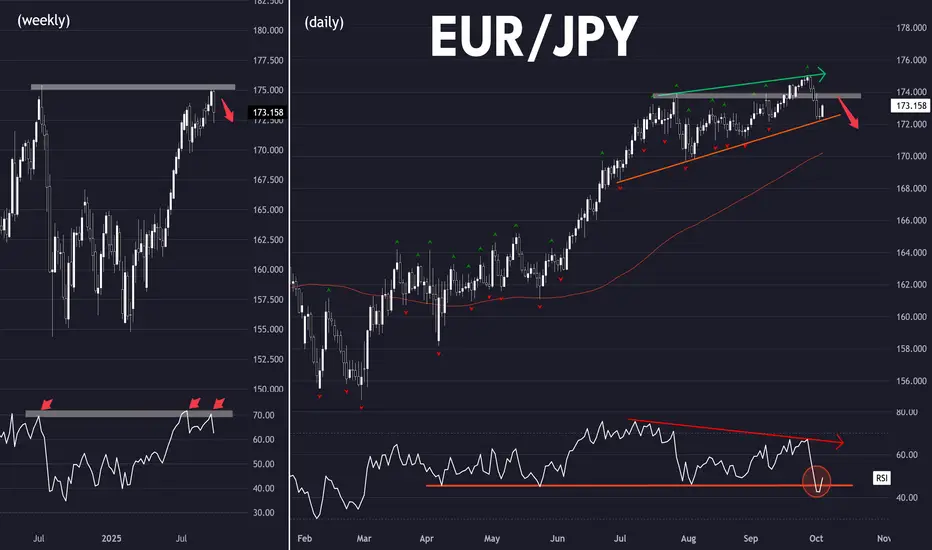
1,000 Pip End Of Year Tumble Anyone??EURJPY – Is an End-of-Year Reversal on the Cards?
The EURJPY has been on a relentless run this year, but things might be about to change.
Looking at the weekly charts, the pair is extremely overextended, trading far above the 20MA — a classic sign that a mean reversion could be coming soon.
To confirm this, I’ve zoomed into the daily charts, and what’s forming now looks like a distribution phase. After setting a new all-time high last week, price has started to move sideways — grinding slightly higher, followed by quick sell-offs. That’s textbook exhaustion behavior.
Here’s what I’m watching for confirmation:
If price breaks slightly above the ATH and then snaps back down, closing the week under 181, that’s my cue to enter short.
If the false breakout doesn’t happen, I’ll instead wait for the daily trendline (marked on the chart) to break and close below — another strong confirmation of momentum shifting.
Targets:
First target: the previous ATH support/buy zone between 175–176 — expect a bounce here.
If momentum continues, I’ll look for a full drop to around 172, which would also fill October’s gap.
As I mentioned in the video, the best risk-to-reward setup right now is on the short side. I’m not interested in buying this high after such an extended run — the weekly chart clearly shows signs of exhaustion.
If price does break higher and then stalls with slowing momentum, we could see one final push up — but for now, I’ll be patiently waiting for the sell signal.
Let me know what you think below 👇

3rd time lucky? (EUR/JPY)Setup
Bullish trend is overbought - short term bearish
Bearish Shooting star pattern on weekly chart (this is the 3rd one - the previous two didn't work out - 3rd time lucky?)
Bearish Evening star pattern on daily chart
Daily RSI down from very overbought reading
Price well above 20/50 day moving average zone
Commentary
There have been no meaningful corrections since the bullish trend began at 155. A large reversal from above 180 could be the start of one.
Strategy
Sell rebound towards supply zone starting at 182
Sell on break below last week’s low price (179.80)

SHORT ON EUR/JPYEJ has formed bearish divergence at a major supply area.
I will be selling EJ to the previous swing low looking to make 150-200 pips

EURJPY ANALYSISAfter seeing the previous daily candle close bearish as a LH area for the 4hr structure we could expect price to continue lower into 176.250 area of support or into the moving average area on the daily timeframe..

EURJPY – Yen Strength Builds as Euro Momentum FadesEURJPY is showing signs of exhaustion after a strong October rally, with lower highs forming as yen demand rebuilds on growing expectations that the Bank of Japan could slowly move toward policy normalization. The euro, while still supported by relatively higher yields, is beginning to lose its edge as growth in the Eurozone cools and traders rotate into safer assets. The pair now looks poised for a measured pullback toward key support zones around 175.90 and 175.10.
Current Bias
Bearish in the short term, with the potential for a deeper correction if the yen continues to attract safe-haven demand and BOJ expectations remain firm.
Key Fundamental Drivers
BOJ Policy Shift: Governor Ueda’s subtle hawkish tone has kept market participants cautious, as inflation remains near target and policymakers hint at a gradual reduction of yield curve control.
Eurozone Data: Growth remains stagnant and inflation continues to moderate, reducing the likelihood of any further ECB tightening.
Global Risk Sentiment: Heightened geopolitical and trade tensions (tariff headlines, global policy uncertainty) are reviving JPY demand as a defensive asset.
Macro Context
The macro picture increasingly favors JPY stability. Japanese bond yields have risen modestly as the BOJ signals more flexibility, narrowing the interest rate gap that previously supported EURJPY. Meanwhile, Eurozone industrial output is slowing, and Germany’s manufacturing data continues to drag regional growth expectations lower.
Commodity flows are neutral, though risk-sensitive currencies like the AUD and NZD remain under pressure, indirectly benefiting the yen. Europe’s reliance on external energy imports and weaker export activity keep the euro capped.
Interest rate expectations:
BOJ: Market pricing leans toward an early 2026 policy adjustment or an incremental tightening if inflation holds above 2%.
ECB: Rates are expected to remain unchanged well into 2026, but forward guidance has turned notably neutral.
Primary Risk to the Trend
A reversal could occur if BOJ policymakers emphasize patience or dismiss near-term tightening expectations, weakening the yen. On the flip side, any stronger-than-expected Japanese inflation data could accelerate JPY gains and deepen the EURJPY correction.
Most Critical Upcoming News/Event
BOJ policy meeting minutes and Governor Ueda’s upcoming comments
Eurozone GDP and inflation revisions
Global equity and bond yield direction (key risk sentiment drivers)
Leader/Lagger Dynamics
EURJPY typically acts as a leader among yen crosses due to its liquidity and yield sensitivity. It often influences moves in GBPJPY and CADJPY, while loosely following the broader EURUSD trend during high-volatility sessions.
Key Levels
Support Levels: 175.90 / 175.10
Resistance Levels: 177.50 / 178.80
Stop Loss (SL): 178.90
Take Profit (TP): 175.90 (initial), 175.10 (extended)
Summary: Bias and Watchpoints
EURJPY’s structure suggests a bearish bias, with potential for a measured move lower as market sentiment tilts toward the yen. The focus remains on 175.90 as the first key target, followed by 175.10 if downside momentum accelerates. The stop-loss at 178.90 allows for short-term volatility while protecting against false reversals.
Fundamentally, BOJ policy dynamics and Eurozone growth stagnation remain the dominant forces. Unless the BOJ backtracks sharply or Eurozone data surprises to the upside, the path of least resistance points lower. Traders should monitor upcoming BOJ commentary and Eurozone inflation figures as key catalysts for confirming continuation or reversal signals.

EURJPYLooking for a bearish move on EURJPY towards Tuesday Low. We can look for 15min confirmation or enter direct for shorts,

EURJPY - Looking To Sell Pullbacks In The Short TermH4 - Strong bearish move.
Bearish convergence.
No opposite signs.
Expecting bearish continuation after pullback until the strong resistance zone holds.
If you enjoy this idea, don’t forget to LIKE 👍, FOLLOW ✅, SHARE 🙌, and COMMENT ✍! Drop your thoughts and charts below to keep the discussion going. Your support helps keep this content free and reach more people! 🚀

EURJPY Reaction Zone AheadOANDA:EURJPY is showing signs of weakness after a strong rally.
The pair is now approaching a key support zone, which also aligns with an unfilled gap.
A retest of this area could attract buyers, but if it fails to hold, we might see a deeper pullback in the short term.
DYOR, NFA

EURJPY WEEKLY CONFLUENCEAfter seeing the previous week spike down into 178.750 key level and a sharp rejection from there , the daily also showing signs of bearish power we could see this pair push down for a few more pips especially with the 4hr structure making LL and LH and the price trading below the moving average

EUR/JPY Gave Fake Breakout , Short Setup Valid To Get 200 Pips !Here is my 2H Chart on EUR/JPY , We Have A Fake Breakout and then the price Back below my old res and we have a very good bearish Price Action on 2 And 4 Hours T.F Also the price playing very good around my res and i`m waiting the price to retest the broken area and giving me a good bearish price action on smaller time frames to can get a confirmation to enter , So i see it`s a good chance to sell this pair if it go up a little to retest the broken area and then we can sell it and targeting 100 to 200 pips . and if we have a daily closure again above my new res then this idea will not be valid anymore .
Reasons To Enter :
1- Perfect Breakout .
2- Clear Bearish Price Action .
3- Bigger T.F Giving Good Bearish P.A .
4 - Perfect 15 Mins Closure .
5- The Price Respect The Res Again .

EURJPY - Looking To Sell Pullbacks In The Short TermH1 - Strong bearish move.
Bearish convergence.
No opposite signs.
Expecting bearish continuation after pullback until the strong resistance zone holds.
If you enjoy this idea, don’t forget to LIKE 👍, FOLLOW ✅, SHARE 🙌, and COMMENT ✍! Drop your thoughts and charts below to keep the discussion going. Your support helps keep this content free and reach more people! 🚀

EURJPY: Pullback or Pause? Eye 178.40 as Yen Stays DefensiveEURJPY has pulled back after hitting fresh highs near 178, but the underlying momentum still favors the euro. With the Bank of Japan maintaining its ultra-loose stance while the ECB holds rates high, the policy divergence continues to support upside pressure. As long as buyers defend the 175–176 zone, the pair looks set to resume its push toward the 178.40 region.
Current Bias
Bullish – Recent dip is corrective, not a full reversal, while fundamentals favor further euro strength over yen.
Key Fundamental Drivers
ECB Policy: Rates remain elevated, with officials stressing caution on premature cuts. This supports the euro.
BOJ Policy: Despite rising Japanese yields, the BOJ is still dovish compared to peers, leaving JPY weaker.
Risk Sentiment: Political risk in Europe tempers gains slightly, but yen safe-haven demand has been muted.
Macro Context
Interest Rate Expectations: ECB is expected to keep rates restrictive longer than the BOJ, reinforcing policy divergence.
Economic Growth Trends: Eurozone growth is sluggish but inflation concerns keep policy tight; Japan is facing rising wage expectations but not enough to force the BOJ into tightening aggressively.
Commodity & Trade Flows: Stronger European trade resilience supports EUR, while JPY continues to weaken with capital outflows tied to low yields.
Geopolitical Themes: Political risks in Europe (French fiscal strains, EU cohesion) are factors, but global macro risk still weighs more on JPY than EUR.
Primary Risk to the Trend
If BOJ signals a surprise tightening or wage growth accelerates more than expected, the yen could stage a sharp rebound.
Most Critical Upcoming News/Event
ECB speeches and Eurozone PMIs – signals on inflation and growth will guide EUR.
BOJ rhetoric – any policy shift hint could shock the market.
Leader/Lagger Dynamics
EURJPY acts as a leader in cross-yen moves, often setting the tone for GBPJPY and AUDJPY. It reflects global risk appetite and monetary divergence, making it a benchmark pair for yen crosses.
Key Levels
Support Levels:
175.10
173.70
Resistance Levels:
176.45
178.40
Stop Loss (SL): 173.70
Take Profit (TP): 178.40
Summary: Bias and Watchpoints
EURJPY remains bullish, with the current pullback offering a potential entry zone if support near 175.10 holds. Policy divergence between the ECB and BOJ continues to drive upside bias. A stop loss sits at 173.70 to protect against deeper reversals, while take profit is targeted at 178.40. Watch ECB communications and BOJ rhetoric closely, as either could provide the catalyst for the next leg of movement.

EURJPY ANALYSISAfter seeing the previous daily candle close as a doji rejecting the moving average and key support areas.. we could expect further sells into the gap area below

EURJPY bearish signalFrom the current structure, EUR/JPY has completed a bearish harmonic pattern, which often signals exhaustion of the bullish move. This pattern strengthens the case for a potential downside scenario.
If the price also breaks below the supporting trendline, my view is that it could move directly down to the highlighted support zone.
📉 Conclusion: My bias is bearish — with the harmonic pattern completed and a possible trendline break, I expect EUR/JPY to head toward support. Still, markets remain unpredictable, and this is only my analysis.
👉 For more structured market insights and professional analysis, follow along.

Getting in early on a trend reversal (EUR/JPY)Setup
Bearish: Potential long term top.
Bearish engulfing candlestick from multi-year highs
RSI has dropped from 70 overbought
Signal
Fakeout: Looking for rebound to stall near the former resistance at 174.
RSI bearish divergence, taken out support
Caution: uptrend line has held so far. A break would confirm trend reversal.
Too early to trade the reversal?
Would you weait for a breakdown first ?
Let's discuss
Ta, Jasper
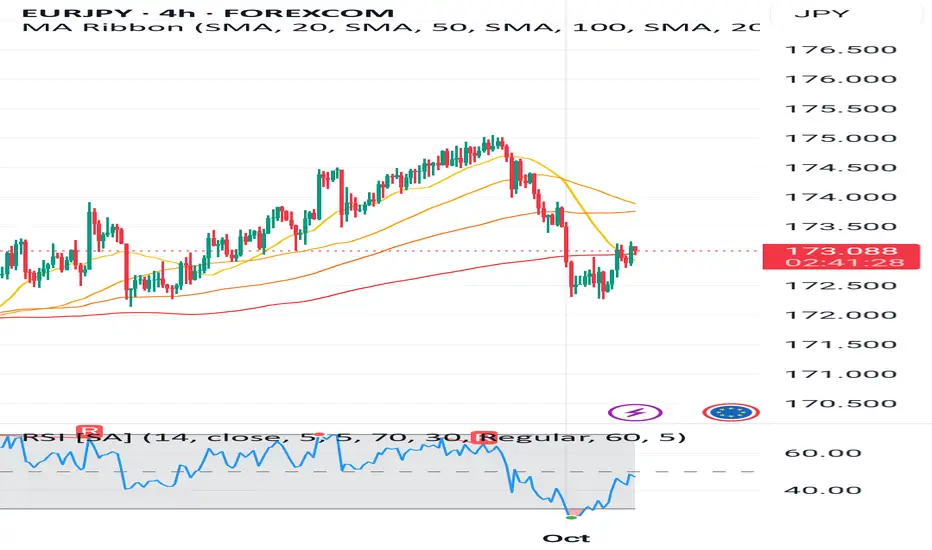
EUR/JPY Trade signal show downtrendBearish Scenario:
Failure to break above 50 SMA → price may retest 200 SMA at ~172.300.
A break below 172.300 opens the path to 171.500–171.000.
Summary
EUR/JPY is in short-term bearish correction after a recent uptrend.
Immediate support: 172.300, resistance: 173.500.
RSI rebound suggests a minor recovery, but major trend remains cautious until price clears 50–100 SMA.
Trading Signal Suggestion:
Conservative Buy: Near 172.300–172.500 with tight stop-loss below 172.200, target 173.500.
Aggressive Sell: Below 172.300 for continuation of bearish correction toward 171.500.
EURJPY Resistance Ahead!
HI,Traders !
#EURJPY keeps going up
And the pair is locally oversold
So after it hits the horizontal
Resistance of 173.756 we
Will be expecting a local
Bearish correction !
Comment and subscribe to help us grow !

EURJPY - Short Term Sell IdeaM15 - Strong bearish move.
No opposite signs.
Currently it looks like a pullback is happening.
Expecting bearish continuation until the two Fibonacci resistance zones hold.
If you enjoy this idea, don’t forget to LIKE 👍, FOLLOW ✅, SHARE 🙌, and COMMENT ✍! Drop your thoughts and charts below to keep the discussion going. Your support helps keep this content free and reach more people! 🚀
-------------------------------------------------------------------------------------------------------------------

EURJPY Bulls Eye 175 as Yen Weakness PersistsEURJPY continues to grind higher, fueled by persistent yen weakness and relative euro strength. The pair has broken through consolidation zones and is now pressing against higher resistance. With the Bank of Japan sticking to ultra-loose policy while the ECB maintains a comparatively tighter stance, buyers remain in control. The question now is whether the rally has enough momentum to test the next key levels around 175.
Current Bias
Bullish – momentum favors buyers as yen remains fundamentally weak.
Key Fundamental Drivers
Bank of Japan: Still hesitant to tighten policy meaningfully, keeping JPY on the back foot.
European Central Bank: Policy remains less dovish than the BoJ, offering EUR support.
Yield Differentials: Eurozone yields remain far more attractive compared to near-zero JGB yields, attracting capital flows into EUR over JPY.
Macro Context
Interest Rates: ECB rate expectations are anchored at restrictive levels, while BoJ remains ultra-dovish.
Growth Trends: Eurozone faces slower growth but still steadier than Japan, where corporate profits and consumer spending remain weak.
Commodity & Trade Flows: Japan’s reliance on energy imports weighs on JPY when oil prices are elevated.
Geopolitics: Rising global risk has not given JPY its usual safe-haven lift, showing structural weakness in its haven appeal.
Primary Risk to the Trend
A sudden BoJ policy shift, verbal intervention from Japanese officials, or a sharp global risk-off shock could send JPY sharply higher and cap EURJPY’s rally.
Most Critical Upcoming News/Event
BoJ commentary or intervention headlines
ECB policy updates and speeches
Eurozone inflation data
Leader/Lagger Dynamics
EURJPY is often a leader among yen pairs, as it reflects both European policy dynamics and yen weakness. Its moves frequently set the tone for other JPY crosses like GBPJPY and AUDJPY.
Key Levels
Support Levels: 173.50, 172.55
Resistance Levels: 174.50, 175.35
Stop Loss (SL): 172.55 (below key structural support)
Take Profit (TP): 174.50 (first target), 175.35 (extended target)
Summary: Bias and Watchpoints
EURJPY maintains a bullish bias, underpinned by yield spreads and ECB-BoJ policy divergence. Buyers are eyeing 174.50 and 175.35, with a stop loss below 172.55 to guard against reversals. The pair is a leader among yen crosses, meaning any sharp shifts in its direction could spill over into GBPJPY and AUDJPY. Traders should watch for BoJ intervention risks and eurozone inflation data as the most likely catalysts for near-term volatility.

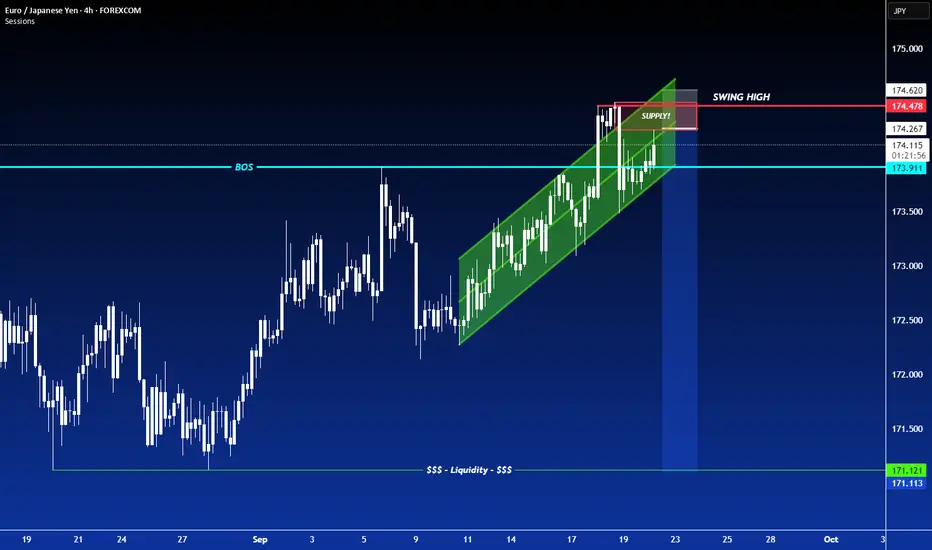
SHORT ON EUR/JPYEUR/JPY has created a beautiful rising channel (bearish reversal pattern) at a major resistance area/zone.
It has also given us a CHOC (change of character) from up to down on the lower timeframe.
I will be selling EJ looking to make 200-300 pips.