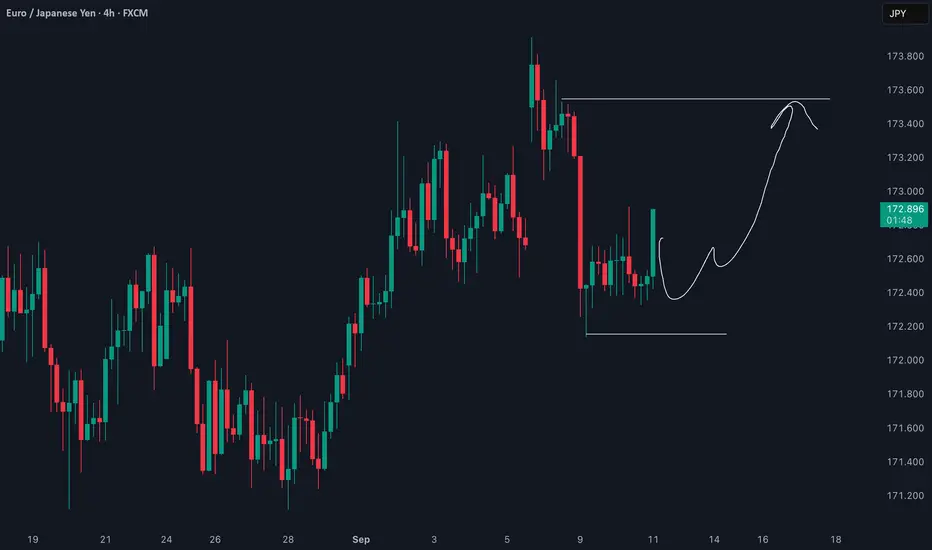
Bullish Structure Holds for EUR/JPY on the 4-Hour ChartEUR/JPY Technical Analysis
What we're looking at on this 4-hour chart is a classic example of a bullish trend undergoing a healthy correction and potentially preparing for its next move higher. The market is giving us some very clear clues. 🧐
1. Market Structure & Dominant Trend 📈
Overall Trend: The dominant, overarching trend is clearly bullish. Looking at the price action from late August through early September, the market has been consistently printing higher highs and higher lows. This is the primary context, and we generally want to trade in the direction of the main trend.
Corrective Phase: After reaching a peak around $173.80, the price experienced a sharp and aggressive sell-off. This is a typical corrective move or profit-taking phase after a strong impulse leg up.
Consolidation / Accumulation: Price has now stopped falling and is moving sideways, contained within a well-defined range. This is often a sign of accumulation, where buyers are absorbing selling pressure and building positions for a potential move higher.
2. Key Levels to Watch 🎯
Resistance 🛡️: The upper boundary of the current range is at approximately $173.55 - $173.60. This is the immediate ceiling that buyers need to break through to confirm a continuation of the uptrend. It's the "line in the sand" for the bears.
Support: The lower boundary is clearly defined around $172.15 - $172.20. This level has been tested and has held firm, showing that buyers are stepping in to defend this price. As long as we stay above this level, the bullish case remains intact.
Potential Double Bottom / Inverse Head & Shoulders: The price action within the consolidation range is carving out what looks like a Double Bottom or a potential Inverse Head and Shoulders pattern.
Bullish Intention: These are classic bullish reversal/continuation patterns. They signal that the downward momentum of the correction has been exhausted and that buyers are regaining control. The recent strong green candles moving away from the support zone reinforce this buying pressure.
4. Potential Scenarios 🚀 vs. 📉
Bullish Scenario (High Probability): This aligns with your projection. The price continues to respect the support level, completes the right side of the pattern, and breaks through the minor resistance within the range (around $173.00). A confirmed break and close above this level would likely propel the price towards the main resistance at $173.55. A break of that level would signal a full continuation of the bullish trend, with sights on new highs.
Bearish Scenario (Lower Probability): We must always consider the alternative. If buyers fail to push the price higher and we see a strong, decisive 4-hour candle close below the support at $172.15, the bullish setup would be invalidated. This would suggest that the correction is not over and could lead to a deeper move down towards the next major structural support levels.
This is a potential setup that favors the buyers. Patience and risk management are key.
Eurjpysignal
DeGRAM | EURJPY reached the resistance area📊 Technical Analysis
● EUR/JPY is rejecting the 173.50 resistance area, with repeated failures near the resistance line signaling exhaustion of bullish momentum.
● Price action shows a likely rotation lower, targeting 172.46 support initially, with further risk toward 171.60 if pressure persists.
💡 Fundamental Analysis
● The yen is supported by stronger JGB yields and renewed BoJ commentary on potential normalization, while the euro faces pressure from softer eurozone trade data.
✨ Summary
Bearish below 173.50; targets 172.46 → 171.60. Invalidation on a close above 173.50.
-------------------
Share your opinion in the comments, and support the idea with a like. Thanks for your support!

EURJPY Is Overbought!
HI,Traders !
#EURJPY is trading in a
Strong uptrend and the pair
Will soon hit a horizontal
Resistance of 173.756
So after the retest a
Local bearish pullback
Is to be expected !
Comment and subscribe to help us grow !

EURJPY Bulls Struggle Near 174, Bears Eye Room to Push LowerEURJPY has been testing the upper resistance near 174.00, but repeated failures to hold above suggest exhaustion. With the euro under pressure from softening European growth data and the yen showing signs of life as BOJ policies evolve, this area looks like a pivot zone. The chart structure points toward potential downside back into the 172.40 and 171.30 supports if sellers step in.
Current Bias
Bearish – Price rejected near 174.00 and is showing signs of topping.
Key Fundamental Drivers
Eurozone: Weakening growth signals (stagnation in Germany and Italy CPI moderation) weigh on the euro.
Japan: Higher JGB yields and BOJ’s quiet policy shift toward tighter conditions give JPY some support.
Global risk sentiment: If equity markets retreat, yen demand could rise as a safe haven.
Macro Context
Interest rate expectations: ECB is unlikely to hike further, with markets leaning toward cuts in 2025; BOJ may gradually tighten through yield control tweaks.
Economic growth: Eurozone is flatlining, while Japan shows modest resilience through services PMI strength.
Geopolitical themes: Energy-driven inflation in Europe and tariff uncertainties continue to cloud EUR outlook.
Primary Risk to the Trend
A sudden rebound in euro sentiment (better PMI data or ECB hawkish signals) could invalidate bearish bias.
Most Critical Upcoming News/Event
Eurozone PMI & inflation updates – key for EUR direction.
BOJ communications and JGB auctions – important for JPY momentum.
Leader/Lagger Dynamics
EURJPY tends to be a lagger, reflecting flows from broader EURUSD and USDJPY moves. However, shifts in Japanese yields can make it temporarily a leader in JPY crosses.
Key Levels
Support Levels: 172.40, 171.30
Resistance Levels: 173.90, 174.30
Stop Loss (SL): 174.30 (above resistance and recent highs)
Take Profit (TP): 171.30 (major support level)
Summary: Bias and Watchpoints
EURJPY bias is bearish with SL at 174.30 and TP at 171.30. The euro is weighed down by stagnant growth and subdued inflation, while the yen is supported by creeping BOJ policy adjustments and higher yields. The main risk is an upside surprise from eurozone data or ECB rhetoric. If sellers hold below 174.00, downside momentum could accelerate toward 171.30.

EURJPY Double-Top Rejection Signals Potential DownsideEURJPY has stalled after testing the 173.80–174.00 resistance zone, with sellers stepping in to defend this multi-week high. The rejection aligns with fading Euro momentum and renewed strength in the yen as safe-haven demand returns. With price action showing a clean rejection candle at resistance, the pair looks vulnerable to a deeper pullback toward key support levels.
Current Bias
Bearish downside favored after rejection at resistance with momentum shifting toward sellers.
Key Fundamental Drivers
Eurozone: Inflation is cooling, and growth remains sluggish, keeping ECB policy dovish in tone.
Japan: Wages and household spending recently turned positive y/y, with BOJ maintaining a cautious stance but under pressure from rising JGB yields.
Risk Sentiment: Ongoing geopolitical tensions (Middle East and Russia sanctions) support yen as a safe-haven.
Macro Context
Interest Rates: ECB leaning dovish with little scope to tighten further; BOJ cautious but rising yields keep pressure for policy adjustment.
Growth Trends: Eurozone faces weak industrial output; Japan showing modest resilience in services.
Commodity Flows: Lower oil prices benefit Japan’s import bill, slightly yen-positive.
Geopolitical Themes: Uncertainty in Israel-Gaza conflict, U.S. tariff battles, and OPEC+ supply risks continue to drive safe-haven demand for JPY.
Primary Risk to the Trend
A sudden ECB hawkish shift or stronger-than-expected Eurozone CPI could flip the bias bullish.
Rapid improvement in global risk appetite would weaken yen demand.
Most Critical Upcoming News/Event
ECB commentary on inflation expectations and growth outlook.
Japan’s wage and CPI data alongside BOJ policy signals.
Leader/Lagger Dynamics
EUR/JPY often acts as a lagger, following EUR/USD direction and broader risk sentiment. Yen moves are highly correlated with USD/JPY and gold, meaning strong flows into havens could amplify downside.
Key Levels
Support Levels: 172.65, 171.36
Resistance Levels: 173.87, 174.38
Stop Loss (SL): 174.38
Take Profit (TP): 172.65 (first), 171.36 (extended)
Summary: Bias and Watchpoints
EURJPY has rejected resistance near 174.00, setting up a bearish bias toward 172.65 and possibly 171.36. A stop above 174.38 protects against upside risk. Fundamentals favor yen strength via safe-haven demand and weaker Eurozone growth momentum. The key watchpoint is whether upcoming ECB commentary reinforces dovish policy; if so, downside pressure should continue. For now, sellers maintain the upper hand as risk-off dynamics align with technical rejection.

DeGRAM | EURJPY rebounded from the boundary of the channel📊 Technical Analysis
● EUR/JPY is trending inside an ascending channel, bouncing from 172.56 support and regaining bullish momentum toward the mid-range.
● Price structure points to continuation higher, with a projected test of 173.90 resistance as long as support holds firm.
💡 Fundamental Analysis
● Euro gains are supported by ECB policymakers reaffirming restrictive stance, while yen remains pressured by widening yield spreads as BoJ stays cautious on policy shifts.
✨ Summary
Bullish above 172.56; targets 173.26 → 173.90. Invalidation on a close below 172.56.
-------------------
Share your opinion in the comments, and support the idea with a like. Thanks for your support!

DeGRAM | EURJPY reached the important resistance📊 Technical Analysis
● EUR/JPY rejected the resistance line near 173.20 after a false breakout in August, confirming sellers’ defense of the upper boundary.
● The current bearish takeover signals downside risk toward 172.46 support, with a deeper slide possible toward 171.60 if momentum accelerates.
💡 Fundamental Analysis
● Renewed demand for the yen is supported by rising JGB yields as the BoJ hints at gradual policy normalization, while euro sentiment is capped by softer eurozone PMI data.
✨ Summary
Bearish below 173.20; targets 172.46 → 171.60. Invalidation on a close above 173.50.
-------------------
Share your opinion in the comments, and support the idea with a like. Thanks for your support!

Fundamental & Technical Analysis: EUR Weakness vs Strong JPY!Today, I want to review the EURJPY ( OANDA:EURJPY ) short position from a fundamental and technical perspective and see if we can profit from this analysis.
Fundamental Analysis:
1. Economic Weakness in the Eurozone
Recent economic data indicate weakness in the Eurozone economy. For instance, retail sales in the Eurozone increased by only 2.2% in July, falling short of expectations. Additionally, inflation rates in the Eurozone are declining, suggesting weak demand in the economy.
Mitrade
2. European Central Bank's Monetary Policies
The European Central Bank is considering interest rate cuts to support the economy. Such policies could lead to a depreciation of the euro, presenting opportunities for short positions.
3. Economic Strength in Japan
In contrast, Japan's economy is showing signs of improvement. Positive economic data, including increased industrial production and exports, indicate economic growth in Japan. This could lead to a strengthening of the Japanese yen and a decline in the EURJPY pair.
4. Bank of Japan's Monetary Policies
The Bank of Japan continues its accommodative monetary policies, including negative interest rates and extensive asset purchase programs. These measures help mitigate downward pressure on the yen, supporting its strength.
Conclusion
Considering the economic weakness in the Eurozone and the economic strength in Japan, the EURJPY pair is likely to experience a downward trend in the short term. This fundamental analysis supports a short position on EUR/JPY.
----------------------------------------------------------------------
Now, let's examine the EURJPY chart on the 4-hour time frame with technical analysis tools .
EURJPY is currently moving in the Resistance zone(173.420 JPY-172.660 JPY) and near the Monthly Resistance(1) .
From the Elliott wave theory perspective , it seems that EURJPY has managed to complete the microwave C of the main wave y of the Double Three Correction(WXY) .
I expect EURJPY to continue its downward trend in the coming hours and at least decline to the Support lines(First Target) .
Second Target: 171.760 JPY
Third Target: Lower lines of the Ascending Channel
Stop Loss(SL): 173.640 JPY
Please respect each other's ideas and express them politely if you agree or disagree.
Euro/Japanese Yen Analysis (EURJPY), 4-hour Time Frame.
Be sure to follow the updated ideas.
Do not forget to put a Stop loss for your positions (For every position you want to open).
Please follow your strategy and updates; this is just my Idea, and I will gladly see your ideas in this post.
Please do not forget the ✅' like '✅ button 🙏😊 & Share it with your friends; thanks, and Trade safe.

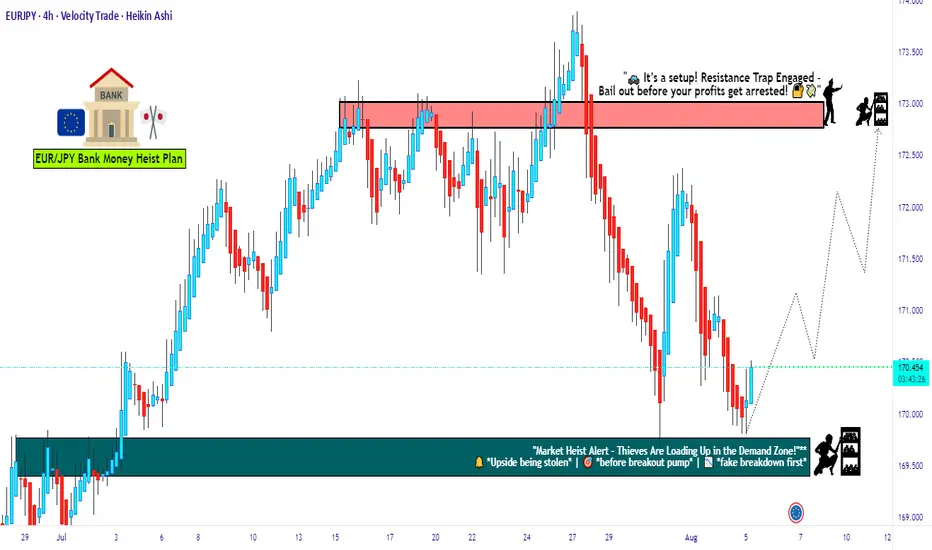
EUR/JPY Bank Heist Is LIVE! Bullish Breakout Plan >>>🚀 EUR/JPY "The Yuppy" Bank Heist Plan (Swing/Scalping Trade) 🚀
Professional Thief Strategy for High-Probability Breakout Trading
🎯 Executive Thief Summary
Asset: EUR/JPY "The Yuppy" (The Euro-Yen Cross)
Strategy: Bullish Hull MA Breakout & Retest with Layered Entry Approach
Timeframe: Swing/Scalping (1H-4H Charts)
Current Price: ¥173.15 | Daily Change: +0.10% (+0.17)
Trade Bias: Mildly Bullish (65% Bullish Score) ✅
Thief Note: This plan combines technical breakout dynamics with fundamental macro drivers for a high-probability heist operation!
📊 Technical Heist Plan
🎮 Entry Strategy (Layered Limit Orders)
The Thief's Multi-Layer Entry Approach for Optimal Positioning:
Layer 1: ¥172.60 (Initial breakout retest zone) ⚡
Layer 2: ¥172.70 (Volume-weighted support area) ⚡
Layer 3: ¥172.80 (Hull MA confluence zone) ⚡
Layer 4: ¥173.00 (Dynamic support & momentum acceleration) ⚡
Thief Tip: You can add additional layers based on your risk appetite and capital allocation strategy!
🛡️ Risk Management
Stop Loss: ¥172.20 (Below 100-day EMA & key support) ❌
Position Sizing: Risk no more than 1-2% per trade layer
Adjustment Note: Dear Thief OG's - Modify your SL based on your individual risk tolerance and strategy parameters
🎯 Profit Targets
Primary Target: ¥174.30 (High-voltage resistance zone) ✅
Context: RSI showing overbought conditions likely at this level - escape with stolen money before potential reversal!
🌍 Fundamental & Macro Context
🇪🇺 Eurozone Factors (EUR Strengths)
ECB Rate Policy: Hold at 2.15% (Hawkish Stance) 🦅
Inflation (HICP): 2.1% (Above ECB's 2% target - supportive for EUR)
Market Impact: Rate differentials favor EUR strength
🇯🇵 Japan Factors (JPY Weaknesses)
BoJ Policy: Dovish (Uncertain Timing for Hikes) 🕊️
Real Wages: Turned Positive (First Time in 7 Months - but gradual impact) ✅
Trade Deal: US-Japan Auto Tariff Reduction (JPY Positive but limited impact)
📅 Economic Calendar Watch
Eurozone GDP Data Today (09:00 GMT) - Potential short-term volatility driver
Risk: GDP miss could cause EUR pullback - monitor news flow
📊 Market Sentiment & Positioning
😰 Fear & Greed Index
Stock Market Sentiment: Greed (Score: 57/100) 📈
Crypto Sentiment: Neutral (Score: 50/100)
Key Drivers:
S&P 500 above 125-day moving average → Greed
Low put/call ratio → Optimism
Stable volatility (VIX) → Confidence
👥 Trader Sentiment
Retail Traders: Bullish (60% Long) 🟢 vs. Bearish (40% Short) 🔴
Institutional Traders: Bullish (55% Long) 🟢 vs. Bearish (45% Short) 🔴
Primary Reason: Carry trade appeal due to rate differentials
⚠️ Risk Factors & Considerations
🚨 Key Risks
Eurozone GDP Miss → EUR Pullback (Monitor 09:00 GMT release)
BoJ Surprise Hike → JPY Rally (Low probability but high impact)
Geopolitical Tensions → Safe-Haven JPY Demand (Always monitor global headlines)
📋 Trade Management Tips
Scale In: Use the layered entry approach to improve average entry price
Scale Out: Consider partial profits at ¥173.40 and ¥174.00 if momentum slows
News Awareness: Monitor ECB and BoJ speaker comments for unexpected guidance changes
📊 Related Pairs to Watch
EUR
Correlations:
EUR/USD - Direct EUR exposure
EUR/CHF - European cross rate
EUR/GBP - European monetary policy differentials
JPY
Correlations:
USD/JPY - Dollar-Yen dynamics
GBP/JPY - Risk-sensitive yen cross
AUD/JPY - Commodity-yen relationship
Thief Insight: Monitor these pairs for confirmation of broader EUR/JPY moves!
✨ Final Thief Notes
Why This Plan Works Now:
Technical breakout confirms bullish bias
Fundamental rate differentials favor EUR strength
Market sentiment supports risk-on environment
Layered entry approach provides optimal risk-reward
Trade Duration Expectation:
Swing Trade: 3-7 days for full target
Scalping Opportunities: 1-4 hour moves within the trend
✨ "If you find value in my analysis, a 👍 and 🚀 boost is much appreciated — it helps me share more setups with the community!"
📌 Hashtags
#EURJPY #ForexTrading #TechnicalAnalysis #SwingTrading #Scalping #BreakoutStrategy #HullMA #TradingSetup #ForexSignals #TradingView #BankHeistPlan #ThiefStrategy #RiskManagement

EURJPY Testing Supply Zone Can Bears Regain Control?EURJPY has climbed back into a key resistance area near 172.40–172.50, a zone that previously triggered sharp selling pressure. Price action suggests exhaustion at these highs, with a possible rotation back toward support if sellers defend this zone again. Given the yen’s safe-haven role and the euro’s sensitivity to ECB policy shifts, this setup is primed for a potential reversal play.
Current Bias
Bearish – The pair is showing rejection signs at resistance, favoring downside toward lower support levels.
Key Fundamental Drivers
ECB Outlook: The ECB is cautious, with slowing eurozone growth limiting room for further tightening, reducing euro strength.
BOJ Policy & Yen Flows: Yen remains supported by safe-haven demand and speculation around BOJ gradually tightening, even if modestly.
Risk Sentiment: Global equity volatility and tariff/geopolitical risks support yen buying when risk-off flows emerge.
Macro Context
Interest Rates: ECB is holding policy steady but leans dovish relative to other central banks. Japan remains ultra-loose, but any hint of normalization sparks yen strength.
Economic Growth: Eurozone growth is fragile, with Germany’s industrial sector under pressure. Japan’s economy is steady, though export-driven, making it vulnerable to global demand.
Geopolitics: Trade tariffs, US-China tensions, and Middle East risks all lean supportive for the yen as a safe haven.
Primary Risk to the Trend
A hawkish ECB surprise or strong eurozone inflation rebound could shift bias back to the upside, invalidating the bearish setup.
Most Critical Upcoming News/Event
ECB Minutes & Eurozone CPI Flash Estimate
BOJ Commentary on Yield Curve Control (YCC)
Leader/Lagger Dynamics
EURJPY tends to act as a lagger, following flows in broader yen crosses like USDJPY (as a leader) and EURUSD (for euro sentiment). Movements in EURJPY often confirm rather than lead directional bias in FX markets.
Key Levels
Support Levels: 171.42, 170.99, 170.65, 170.08, 169.73
Resistance Levels: 172.47, 173.31
Stop Loss (SL): 173.31 (above resistance zone)
Take Profit (TP):
TP1: 171.42
TP2: 170.65
TP3: 170.08
Summary: Bias and Watchpoints
Bias on EURJPY is bearish, with sellers looking to defend the 172.40–172.50 resistance area. A stop loss is best placed above 173.31, while downside targets stretch toward 171.42 → 170.65 → 170.08. Fundamentally, the euro faces growth headwinds while the yen benefits from safe-haven demand, though BOJ policy risks remain in play. The most important watchpoint is ECB and Eurozone CPI data, which could either reinforce the bearish case or shift sentiment sharply. For now, EURJPY looks vulnerable to a deeper correction, with price action aligned to favor sellers.

DeGRAM | EURJPY is trying to break through resistance📊 Technical Analysis
● EUR/JPY is ascending within a rising channel and has rebounded off support near 172.20–172.30, forming a fresh higher low (green arrow).
● Price is now approaching a tight wedge toward the downward-sloping resistance. A break above ~172.63 opens the path toward 173.01—and potentially further up toward the rising channel top near 173.90.
💡 Fundamental Analysis
● EUR/JPY remains steady above 172.00, holding its recent range amid calm sentiment.
● The cross also benefits from buoyant market sentiment and sustained optimism in risk assets, leading to continued yen weakness. Bullish momentum is reinforced by its position above the 100-day EMA and an RSI elevated above the 50 level.
✨ Summary
Long above 172.60–172.63; first target 173.01, with extension toward 173.90. Invalidation only upon break below 172.20.
-------------------
Share your opinion in the comments, and support the idea with a like. Thanks for your support!

EURJPY - LongI expect price to push lower toward the 172.000 support level, From that zone, my bias shifts to long, targeting the 172.800 – 173.000 area as the next supply/resistance zone.

EURJPY BUYING Eurjpy has been moving great lately and now can expect it to keep it’s structure and head to the up side , will be scalping it and taking partials

EURJPY – Bearish Reversal Looming from Key Resistance ZoneAfter a strong recovery rally, EURJPY has once again hit the 172.30 resistance zone a level that has repeatedly acted as a ceiling for price action. This latest retest comes with signs of momentum fading, and I’m eyeing a potential reversal that could send the pair back toward key support zones. With broader yen strength creeping in on safe-haven flows and the euro’s upside capped by a cautious ECB, this setup is looking primed for sellers to step in.
Current Bias
Bearish – The pair is struggling to break and hold above the 172.30 resistance zone. Price action is showing rejection wicks on the H4 chart, indicating potential distribution before a move lower.
Key Fundamental Drivers
Euro Side: The ECB remains cautious on further tightening, with growth concerns in the eurozone limiting the upside for EUR. Recent industrial production softness and muted inflation expectations cap bullish momentum.
Yen Side: The BoJ’s shift toward a slightly less accommodative stance, combined with safe-haven demand amid global trade tensions and Trump’s tariff rhetoric, supports JPY strength.
Risk Sentiment: Ongoing uncertainty around global growth and trade flows benefits JPY as a defensive asset, putting downside pressure on EURJPY.
Primary Risk to the Trend
A surprise hawkish tilt from the ECB or strong eurozone economic data could fuel renewed buying pressure, forcing a breakout above 172.98.
A sudden drop in risk-off sentiment or a rebound in global equities could weaken JPY demand and negate the bearish bias.
Most Critical Upcoming News/Event
Eurozone GDP and Industrial Production data – Any significant beat could temporarily lift EUR.
Japan CPI and BoJ commentary – Inflation beats or hawkish language could accelerate JPY gains.
Geopolitical headlines – Trade tensions between the US and China remain a key driver for yen demand.
Leader/Lagger Dynamics
EURJPY is acting as a lagger in the current yen move, with USDJPY leading the direction for JPY crosses. Any decisive move in USDJPY—especially a break lower—would likely spill over into EURJPY. The pair also tends to mirror risk sentiment shifts seen in equity indices like US500, making global sentiment a secondary driver.
Summary: Bias and Watchpoints
I’m maintaining a bearish bias on EURJPY as long as price stays below the 172.30 resistance zone. My stop-loss is placed just above the 172.98 swing high to protect against a bullish breakout. First targets sit at 171.43, then 170.65, with an extended downside target near 169.73 if momentum builds. A clean break below 170.65 would open the path for deeper declines, while any sustained break above 172.98 would invalidate this setup. In short, I’m watching for rejection confirmation from resistance and will be tracking USDJPY closely as the leader for yen sentiment.

EUR/JPY – Lower High in the Making?As explained in my JPY Index analysis , alongside GBP/JPY, EUR/JPY is another strong candidate for a meaningful drop.
From the chart: after reaching a high near 174 — close to the 2024 ATH — the pair had its first leg down. When price dipped to the 170 psychological level, bulls stepped in, attempting a push to new highs.
However, at 173, it was the bears’ turn. The pair reversed again, potentially forming a lower high.
I believe we are in the early stage of a stronger drop, and in my view, rallies around 172 should be sold. The downside target is around 166.50, with this scenario negated on a break above the recent high. 🚀
Disclosure: I am part of TradeNation's Influencer program and receive a monthly fee for using their TradingView charts in my analyses and educational articles.

EURJPY PROFIT Eurjpy hit take profit and will keep trading and scalping it whether it gives good opportunities
DeGRAM | EURJPY is moving in an ascending channel📊 Technical Analysis
● Price is climbing within a rising channel after confirming a breakout retest at 172.10, turning former resistance into support.
● Structure favors continuation toward 172.90 and channel top at 173.90, with minor pullbacks likely staying above the breakout base.
💡 Fundamental Analysis
● Improved eurozone PMI data and firm ECB stance reinforce euro strength, while BoJ’s unchanged ultra-loose policy keeps the yen under pressure.
✨ Summary
Long above 172.10; targets 172.90 → 173.90. Invalidation below 172.00.
-------------------
Share your opinion in the comments, and support the idea with a like. Thanks for your support!

DeGRAM | EURJPY exited from the channel📊 Technical Analysis
● EURJPY broke above the descending channel’s resistance line near 171.38, holding within an ascending wedge that favors bullish continuation.
● A sustained move above 172.17 opens the way toward 173.06, with intraday pullbacks likely retesting the breakout area for support.
💡 Fundamental Analysis
● The euro gained as ECB officials signaled no immediate rate cuts, while the yen remains pressured by Bank of Japan’s commitment to ultra-loose policy despite rising inflation expectations.
✨ Summary
Buy above 171.38; target 173.06. Setup remains valid while price stays above 171.00.
-------------------
Share your opinion in the comments, and support the idea with a like. Thanks for your support!

EURJPY PROFIT Eurjpy performed well and has mashed all take profits and unlocked a new price level will be looking to hold a bit more longer

EUR/JPY Setup: Thief Trader's Stealth Bull Run to 173.000🔥💶 EUR/JPY Bullish Heist Plan 💶🔥
🧠 New Plan Unlocked – The EUR/JPY Bullish Mission is LIVE!
Thief Trader style means: No noise, no fluff — just pure sniper precision with layered limit orders. 🧤🔫
This isn’t trading… it’s a planned market robbery 💼💣
🧩 Asset: EUR/JPY
📊 Strategy: Bullish Bias with Stealth Layered Entries (Limit Order Gameplan)
🎯 Target: 173.000 — That’s the vault we’re cracking!
🛑 Stop Loss: 169.100 — Tight security, keep your escape route clean.
📍 Entry: No fixed door — we’re setting traps (limit orders) across key levels. Patience pays thieves.
Watch for pullbacks on lower timeframes: 15m, 30m, or even 1H — strike near support bounces & fakeout wicks. 🐍💥
🔍 Thief Logic:
This ain’t random — price is setting up for a high-stakes move north with JPY weakness fueling the getaway car.
Think smart, layer deep — sniper entries, not shotgun chaos. 🎯🔍
📌 Notes from the Safe House:
Trade with position sizing discipline – the market doesn’t owe you.
News events are motion sensors — avoid them or stay light! 🕵️♂️📉
Use trailing SLs once in profit — secure the bag and vanish. 💼💨
💣 Ready to steal pips, not hope? Hit that 👍, drop a 💬, and join the crew.
This is Thief Trading — we don’t follow markets, we outsmart them. 🧠💵
Stay sharp, stay silent… profit loud. 🐱👤📈💸
🔥 Tap Boost. Support the Heist. Run the Charts. #ThiefTrader 🧤💰
Possible Short Position Levels for EURJPYThe trade plan is as follows:
Action: Entering a short position, betting on the price to fall.
Entry: 171.886, anticipating a pullback to a previously broken support level.
Stop Loss: Placed at 172.406 to limit losses if the price unexpectedly rises and breaks the recent high.
Targets: Two take-profit levels are identified to secure profits as the price declines.
TP1: 170.780 (a recent support level).
TP2: 169.720 (a major previous low).
The setup is considered favorable because the potential profit is significantly larger than the potential risk.
Disclaimer
This analysis is for educational and informational purposes only and does not constitute financial advice. The provided trade idea is based on technical analysis and historical price action, and past performance is not indicative of future results. Trading foreign exchange on margin carries a high level of risk and may not be suitable for all investors. Before deciding to trade, you should carefully consider your investment objectives, level of experience, and risk appetite. You could lose some or all of your initial investment. Seek advice from an independent financial advisor if you have any doubts. Any action you take upon the information on this chart and analysis is strictly at your own risk.

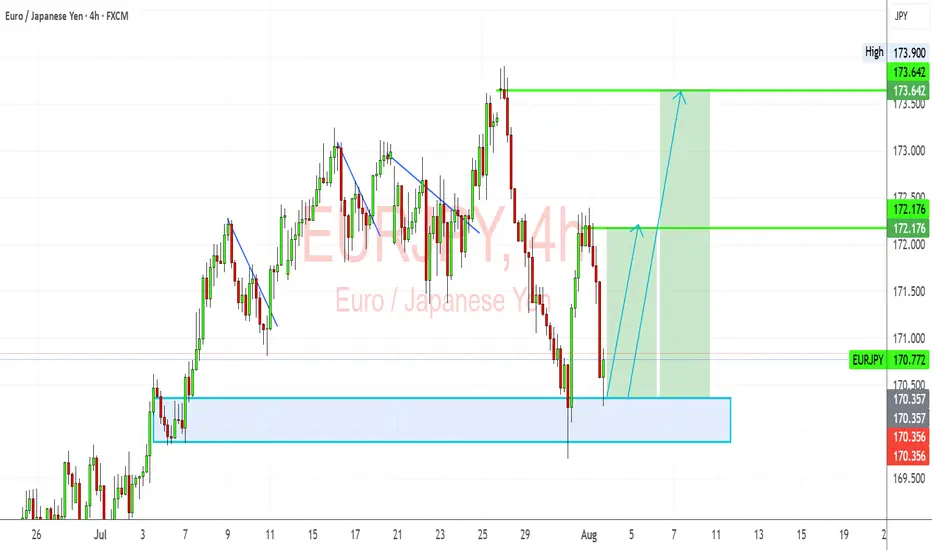
EURJPY: Bullish Rebound from Key Demand ZoneEURJPY has bounced off a critical demand zone and is showing signs of a bullish recovery. Despite the recent pullback, the pair’s structure remains fundamentally and technically bullish, driven by JPY weakness and EUR resilience.
Technical Analysis (4H Chart)
Pattern: Price tested a strong demand zone near 170.35–170.50 and rejected it aggressively.
Current Level: 170.77, starting a potential bullish leg toward higher resistance levels.
Key Support Levels:
170.35 – key demand zone and invalidation level for bulls.
169.90 – deeper support if demand zone breaks.
Resistance Levels:
172.17 – first bullish target and interim resistance.
173.64 – major target if bullish continuation sustains.
Projection: A successful rebound from 170.35 could drive price toward 172.17 initially, then 173.64 if momentum holds.
Fundamental Analysis
Bias: Bullish.
Key Fundamentals:
EUR: ECB’s slower path toward easing supports EUR stability relative to JPY.
JPY: Weakness persists as BoJ maintains dovish bias, though FX intervention risk limits JPY downside speed.
Global Sentiment: Mild risk-on mood supports EUR strength against JPY.
Risks:
BoJ verbal intervention or actual FX intervention could trigger temporary JPY strength.
Sharp reversal in global risk sentiment could weaken EUR/JPY.
Key Events:
ECB speeches and data (CPI, growth updates).
BoJ FX comments and broader market risk appetite.
Leader/Lagger Dynamics
EUR/JPY is a leader among JPY pairs, often moving in sync with GBP/JPY and CHF/JPY. Its movement also tends to precede confirmation in risk-sensitive JPY crosses.
Summary: Bias and Watchpoints
EUR/JPY is bullish from the 170.35 demand zone, with a potential move toward 172.17 and 173.64. Key watchpoints include ECB communication, BoJ stance, and market risk sentiment. As long as 170.35 holds, bulls remain in control.