EURNZD: Market of Sellers
Remember that we can not, and should not impose our will on the market but rather listen to its whims and make profit by following it. And thus shall be done today on the EURNZD pair which is likely to be pushed down by the bears so we will sell!
Disclosure: I am part of Trade Nation's Influencer program and receive a monthly fee for using their TradingView charts in my analysis.
❤️ Please, support our work with like & comment! ❤️
Eurnzd!!

EURNZD Will Go Down! Sell!
Take a look at our analysis for EURNZD.
Time Frame: 1h
Current Trend: Bearish
Sentiment: Overbought (based on 7-period RSI)
Forecast: Bearish
The market is on a crucial zone of supply 2.029.
The above-mentioned technicals clearly indicate the dominance of sellers on the market. I recommend shorting the instrument, aiming at 2.023 level.
P.S
Please, note that an oversold/overbought condition can last for a long time, and therefore being oversold/overbought doesn't mean a price rally will come soon, or at all.
Like and subscribe and comment my ideas if you enjoy them!

Is EUR/NZD Setting Up The Ultimate Swing Trade Opportunity?🎭 The Great Euro Heist: EUR/NZD Cash Flow Caper
💼 Mission Brief: Operation Bull Run
Asset Under Surveillance: EUR/NZD (Euro vs Kiwi - yes, I said "Aussie" in the title for the vibes, mate 🦘)
Market: FOREX
Strategy Type: Swing/Day Trade Cash Flow Management
Risk Level: Thief Mode Activated
📊 The Intelligence Report
Market Setup: Bullish momentum confirmed! 🐂
Hull Moving Average retest looking clean
Bullish Heikin Ashi doji candle formation spotted (that's our signal, folks!)
Bulls are warming up for the ride
🎯 The Heist Plan (Entry Strategy)
The "Thief Layering" Method
We're using multiple limit orders (layering strategy) to sneak into this trade like pros:
Sell Limit Layers (Scale-In Entries):
🎯 Layer 1: 2.01000
🎯 Layer 2: 2.01500
🎯 Layer 3: 2.02000
Pro Tip: You can add more layers based on your own risk appetite and account size. The more layers, the smoother the average entry price!
Alternative Entry: Any current market price works too if you're feeling bold! 🚀
🛡️ Risk Management (The Exit Plan)
🚨 Stop Loss (Emergency Escape Route)
Thief SL: 2.00000
⚠️ Important Note: Fellow Thief OGs, this is MY stop loss level. You're the captain of your own ship! Set your SL based on your risk tolerance. Manage your money, make your money, at your own risk.
💰 Take Profit (The Getaway Target)
Target Zone: 2.05000
🚧 Market Intelligence: Police barricade (strong resistance) detected at this level + oversold conditions + potential trap zone. Smart thieves escape with the loot before things get dicey!
⚠️ Important Note: This is MY take profit target. You call the shots on when to secure your gains. Take partials, trail stops, or go full send - your vault, your rules!
🔗 Related Pairs to Watch (Correlation Play)
Keep an eye on these pairs for confirmation:
Direct Correlations:
FX:EURUSD - Euro strength indicator
OANDA:NZDUSD - Kiwi weakness/strength gauge
OANDA:AUDNZD - Trans-Tasman sibling rivalry (similar commodity currency behavior)
Inverse Correlations:
FX:USDJPY - Risk sentiment barometer
TVC:DXY (US Dollar Index) - Overall dollar strength
Key Point: If EUR is strengthening across the board AND NZD is showing weakness, our setup gets extra confirmation! 💪
🎓 Why This Setup Works
1️⃣ Technical Confluence: Hull MA + Heikin Ashi alignment = high probability setup
2️⃣ Layer Entry Strategy: Reduces risk by averaging into the position
3️⃣ Clear Risk/Reward: Defined exit points keep emotions in check
4️⃣ Cash Flow Management: Scale in, scale out = professional trade management
⚡ Quick Action Items
Set your limit orders (or enter at market)
Place your stop loss (adjust to YOUR comfort zone)
Set alerts at target level
Monitor correlated pairs for confirmation
Manage position size according to your risk tolerance
📢 Community Engagement
✨ If you find value in my analysis, a 👍 and 🚀 boost is much appreciated — it helps me share more setups with the community!
⚖️ Disclaimer
CRITICAL: This is a "thief style" trading strategy presented for entertainment and educational purposes. This is NOT financial advice. Trading FOREX involves substantial risk of loss. Past performance does not guarantee future results. Always do your own research, manage your risk properly, and never trade with money you cannot afford to lose. This analysis is shared in a fun, creative format but should be treated with the seriousness that trading requires. Trade at your own risk!
#EURNZD #FOREX #SwingTrading #DayTrading #PriceAction #TechnicalAnalysis #ForexSignals #TradingStrategy #HullMA #HeikinAshi #LayeringStrategy #RiskManagement #ForexTrading #CurrencyTrading #TradingIdeas #MarketAnalysis #ForexLife #TradingCommunity #ChartAnalysis #ForexSetup
Trade smart, stay stealthy, and may the pips be ever in your favor! 🎩💰

EUR-NZD Free Signal! Buy!
Hello,Traders!
EURNZD after a deep sell-side liquidity sweep, price taps into a well-defined horizontal demand area. Strong bullish displacement suggests smart money accumulation, with structure shifting bullish. Expect continuation toward upside liquidity and prior imbalance.
--------------------
Stop Loss: 2.0195
Take Profit: 2.0269
Entry: 2.0225
Time Frame: 3H
--------------------
Buy!
Comment and subscribe to help us grow!
Check out other forecasts below too!
Disclosure: I am part of Trade Nation's Influencer program and receive a monthly fee for using their TradingView charts in my analysis.

EURNZD Long From SupportHello Traders
In This Chart EURNZD Forex Forecast By FOREX PLANET
today EURNZD analysis 👆
🟢This Chart includes EURNZD market update)
🟢What is The Next Opportunity on EURNZD Market
🟢how to Enter to the Valid Entry With Assurance Profit
This CHART is For Trader's that Want to Improve Their Technical Analysis Skills and Their Trading By Understanding How To Analyze The Market Using Multiple Timeframes and Understanding The Bigger Picture on the Charts

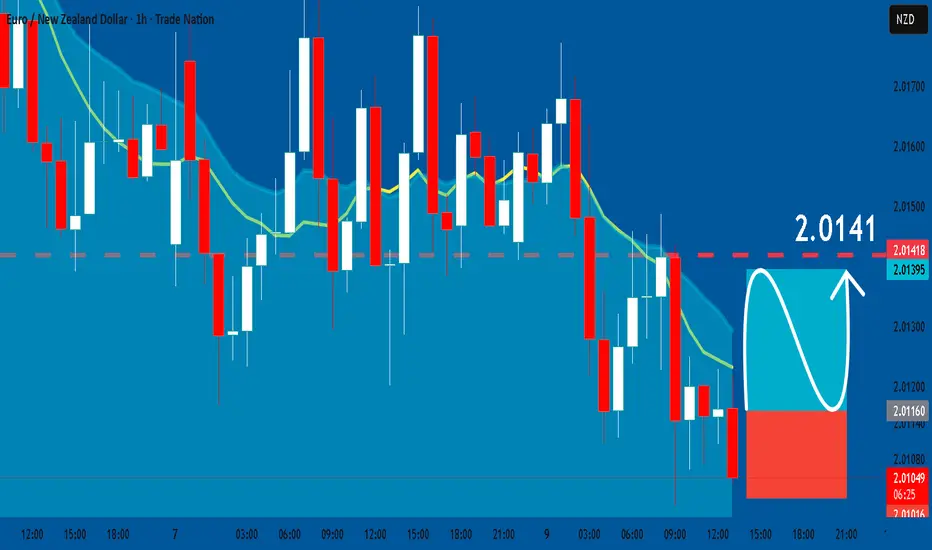
EURNZD FREE SIGNAL|SHORT|
✅EURNZD rejects the supply level after engineering a liquidity sweep above prior highs, shifting order flow bearish as price displaces downward. The current retracement simply returns to a premium zone before further repricing lower.
—————————
Entry: 2.0202
Stop Loss: 2.0246
Take Profit: 2.0141
Time Frame: 5H
—————————
SHORT🔥
✅Like and subscribe to never miss a new idea!✅

Bearish reversal off key resistance?EUR/NZD is rising towards the pivot and could reverse to the 1st support, which is a multi swing low suport.
Pivot: 2.02816
1st Support: 2.00578
1st Resistance: 2.03851
Disclaimer:
The opinions given above constitute general market commentary and do not constitute the opinion or advice of IC Markets or any form of personal or investment advice.
Any opinions, news, research, analyses, prices, other information, or links to third-party sites contained on this website are provided on an "as-is" basis, are intended to be informative only, and are not advice, a recommendation, research, a record of our trading prices, an offer of, or solicitation for, a transaction in any financial instrument and thus should not be treated as such. The information provided does not involve any specific investment objectives, financial situation, or needs of any specific person who may receive it. Please be aware that past performance is not a reliable indicator of future performance and/or results. Past performance or forward-looking scenarios based upon the reasonable beliefs of the third-party provider are not a guarantee of future performance. Actual results may differ materially from those anticipated in forward-looking or past performance statements. IC Markets makes no representation or warranty and assumes no liability as to the accuracy or completeness of the information provided, nor any loss arising from any investment based on a recommendation, forecast, or any information supplied by any third party

EURNZD at the weekly 20SMARSI oversold on the 4H and testing the weekly 20SMA, expecting a bounce here. See profit take profit.

EURNZD FREE SIGNAL|LONG|
✅EURNZD price is reacting from a higher-timeframe demand level after running sell-side liquidity beneath the zone, forming an ICT accumulation footprint that signals a potential shift back toward premium. The rejection wick suggests smart-money absorption before a corrective move higher.
—————————
Entry: 2.0106
Stop Loss: 2.0065
Take Profit: 2.0168
Time Frame: 5H
——————————
LONG🚀
✅Like and subscribe to never miss a new idea!✅

EUR/NZD Heavy Selling Pressure Builds — Bearish Guide📌 Asset: EUR/NZD — “EURO VS KIWI DOLLAR”
📘 Forex Market Trade Opportunity Guide (Swing / Day Trade)
📉 BEARISH TRADE PLAN — CONFIRMED SETUP
The market structure clearly highlights a bearish continuation, supported by a strong Kijun Moving Average breakout, signalling momentum shift and fresh downside liquidity pressure. The price is showing exhaustion on the upside and rejecting major supply zones — this adds confidence to bearish sentiment.
📥 ENTRY
➡️ You can enter the market at ANY PRICE LEVEL based on your strategy, structure, and confluence setup.
The pair is currently in a controlled downside channel, giving traders flexibility to position into the broader bearish flow.
🛑 STOP LOSS MANAGEMENT
SL Level: 2.02500
🔹 This is the thief SL — adjust according to your personal trading plan and your own risk appetite.
🔹 You are NOT required or recommended to follow only this SL. Your capital, your rules, your responsibility.
🎯 TARGET PLAN — CONFIDENCE WITH CONFLUENCE
TP Level: 1.99500
This target is backed by clear technical conditions:
📌 Triangular Moving Average acting as a strong resistance
📌 Overbought conditions confirming exhaustion
📌 Bearish trap behaviour → liquidity grab → correction phase
📌 Momentum indicators aligning with downside confirmations
🔸 Again, you are NOT recommended to use only this TP. Take profits based on your own comfort, risk, and money-management style.
🔍 RELATED PAIRS TO WATCH (CORRELATION + KEY POINTS)
Monitoring correlated or cross-influenced pairs helps improve directional confidence and market clarity. Here are the most relevant pairs:
1️⃣ FX:EURUSD (Euro vs U.S. Dollar)
Correlation Insight:
Moderate positive correlation with EUR/NZD because EUR is the base currency.
Strong EUR weakness strengthens bearish bias on EUR/NZD.
Watch for EUR macro shifts, ECB comments, or USD strength that indirectly boosts NZD flows.
2️⃣ OANDA:NZDUSD (Kiwi vs U.S. Dollar)
Correlation Insight:
Often inversely influences EUR/NZD.
If NZD/USD is rising strongly (Kiwi strength), EUR/NZD usually falls faster.
Key factors: RBNZ tone, commodity sentiment, dairy price index, risk-on behavior.
3️⃣ OANDA:EURAUD (Euro vs Aussie Dollar)
Correlation Insight:
AUD and NZD are both commodity currencies; similar movement patterns.
If EUR/AUD is also bearish, it confirms broad EUR weakness.
Helps validate whether EUR is undergoing a macro shift.
4️⃣ #GBPNZD (British Pound vs Kiwi Dollar)
Correlation Insight:
Shares NZD as the quote currency — strong Kiwi = broad bearish movement across NZD pairs.
If GBP/NZD is dropping, NZD strength is leading the market.
Helps confirm NZD dominance trend.
5️⃣ #NZDJPY (Kiwi vs Japanese Yen)
Correlation Insight:
Risk sentiment pair — reflects global risk appetite.
If NZD/JPY is bullish → risk-on → NZD strength → supports EUR/NZD bearish continuation.
If NZD/JPY weakens → watch EUR/NZD volatility spikes.
🎯 CORRELATION SUMMARY (QUICK TAKE)
EUR Weak + NZD Strong → EUR/NZD Bearish Acceleration
EUR Strong + NZD Weak → EUR/NZD Pullbacks or Trend Slowdown
Risk-On Sentiment → NZD Strength → Supports EUR/NZD Downside
Commodity Market Rising → NZD Strengthens → EUR/NZD Bearish Bias Strengthens

EURNZD: Long Signal Explained
EURNZD
- Classic bullish pattern
- Our team expects retracement
SUGGESTED TRADE:
Swing Trade
Buy EURNZD
Entry - 2.0115
Stop - 2.0101
Take - 2.0141
Our Risk - 1%
Start protection of your profits from lower levels
Disclosure: I am part of Trade Nation's Influencer program and receive a monthly fee for using their TradingView charts in my analysis.
❤️ Please, support our work with like & comment! ❤️
EURNZD D11. Market Structure
The pair has broken below the ascending trendline, confirming a structure shift from bullish → bearish.
After the break, price is currently pulling back, forming a bearish retest pattern.
The trendline break is clean and decisive, indicating strong selling pressure.
2. Key Levels
🔴 Resistance / Supply Zone (Sell Area)
2.02425 – 2.03331
This is the zone price is expected to retest.
Contains previous support → now turned resistance.
Perfect for bears to re-enter.
🔵 Support Zones (Downside Targets)
2.00832
Nearest support, minor liquidity area.
1.99958
Strong psychological + structural support.
1.97959
Major D1 target.
Large liquidity pool.
Likely final destination if bearish momentum continues.

EURNZD Long From SupportHello Traders
In This Chart EURNZD 4 HOURLY Forex Forecast By FOREX PLANET
today EURNZD analysis 👆
🟢This Chart includes EURNZD market update)
🟢What is The Next Opportunity on EURNZD Market
🟢how to Enter to the Valid Entry With Assurance Profit
This CHART is For Trader's that Want to Improve Their Technical Analysis Skills and Their Trading By Understanding How To Analyze The Market Using Multiple Timeframes and Understanding The Bigger Picture on the Charts

EUR/NZD Builds Bullish Structure – Will Buyers Dominate?💶💚 EUR/NZD “EURO VS KIWI DOLLAR” — Profit Pathway Setup (Day Trade)
🎯 Market Bias:
Bullish momentum confirmed ✅ following a 786 LSMA breakout, showing potential continuation strength on intraday structure.
🧩 Entry Plan (Layering Strategy Style)
This setup uses a layered entry method (multi-limit strategy) to build position strength on pullbacks.
🟢 Buy Limits: 2.01000 / 2.01200 / 2.01400
(You can increase or fine-tune limit layers based on your risk management plan.)
💡 This approach helps catch liquidity dips before the main impulse move.
🛡️ Stop Loss:
📍 “Thief SL” positioned at 2.00800 — designed for tight risk control within short-term volatility.
⚠️ Note: Fellow traders (Thief OG’s 👀), this is not financial advice — you may adjust SL as per your personal plan. Trade smart, take money, move clean.
🎯 Target Zone (Police Barricade Ahead!)
🚧 2.03000 is marked as our resistance checkpoint — an area of previous overbought pressure and liquidity traps.
Plan to secure profits once price approaches this zone.
⚠️ Again — you’re the boss of your take-profit. My setup, your decision!
🧠 Technical Context & Market Insight
LSMA breakout above 786 retracement confirms bullish bias.
RSI mid-zone recovery supports upward momentum.
MACD histogram crossover indicates renewed buying pressure.
Watch for volatility spikes during London & NY overlap session.
🔗 Correlated Pairs to Watch
💷 $GBP/NZD → Similar Kiwi reaction strength; strong upward momentum often mirrors EUR/NZD.
💶 $EUR/AUD → Positive correlation; Euro performance gauge.
💵 $USD/NZD → Inverse bias; weakness in Kiwi could strengthen this play.
💸 $AUD/NZD → Regional flow confirmation; helps validate Kiwi strength/weakness patterns.
Monitoring these can provide inter-market confirmation before scaling in or adding layers.
✨ “If you find value in my analysis, a 👍 and 🚀 boost is much appreciated — it helps me share more setups with the community!”
🔖 #EURNZD #Forex #DayTrading #PriceAction #EUR #NZD #TradingView #TechnicalAnalysis #ThiefStrategy #BullishSetup #MarketInsights #LSMABreakout #SwingTrading #TradePlan #LiquidityZones #ForexTrader #RiskManagement

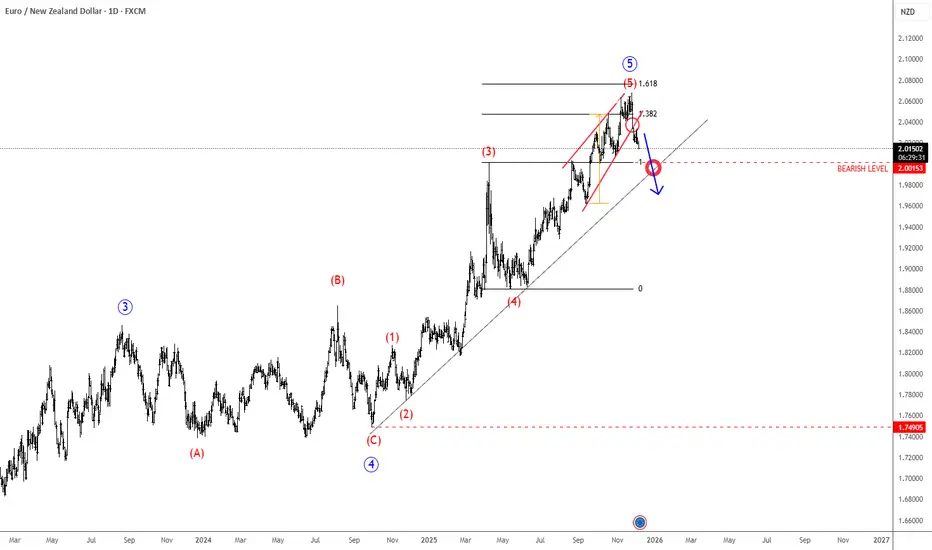
EURNZD May Have ToppedEUR is coming sharply to the upside against NZD, hitting new highs, however, looking at the wave structure, we still see the market is in a fifth wave, but it appears that this wave five has a much more extended structure than initially expected. Still, it looks like the final leg of the impulse up from the 1.7490, with the shape of a wedge now at the top, with potential reversal happening as prices comes down from a wedge, signals more weakness, especially if slips back below 2.00 level.
EUR/NZD BULLS ARE STRONG HERE|LONG
Hello, Friends!
We are targeting the 2.028 level area with our long trade on EUR/NZD which is based on the fact that the pair is oversold on the BB band scale and is also approaching a support line below thus going us a good entry option.
Disclosure: I am part of Trade Nation's Influencer program and receive a monthly fee for using their TradingView charts in my analysis.
✅LIKE AND COMMENT MY IDEAS✅

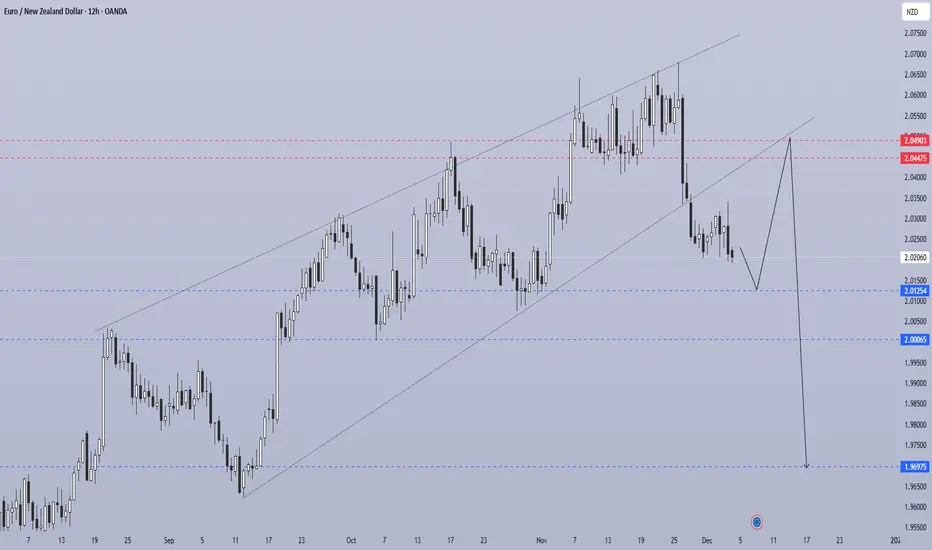
EURNZD1. Market Structure
The pair has been in a multi-month ascending channel (Jul → Nov), but the recent strong bearish impulse has:
Broken the channel to the downside
Created a clear Shift of Structure (ChoCH)
Signaled that bullish momentum is weakening
This is the most important signal on the chart — the uptrend is losing strength.
2. Current Price Position
Price is currently:
Sitting just below a broken trendline
Stalling around 2.0200 – 2.0220, forming small-bodied candles
Showing signs of bearish continuation after a pullback
This aligns perfectly with the bearish projection you drew.
3. Expected Pullback Before The Drop
Your chart shows a potential retest into the 2.044–2.049 zone.
This zone is:
Previous range high liquidity
A clean supply zone
Aligned with the broken ascending channel (trendline retest)
A perfect location for large players to reload shorts
So we expect:
Price to retrace → hit supply → reject → fall strongly
EURNZD Short Term Sell IdeaH1 - Strong bearish move.
No opposite signs.
Currently it looks like a pullback is happening.
Expecting bearish continuation until the two Fibonacci resistance zones hold.
If you enjoy this idea, don’t forget to LIKE 👍, FOLLOW ✅, SHARE 🙌, and COMMENT ✍! Drop your thoughts and charts below to keep the discussion going. Your support helps keep this content free and reach more people! 🚀
-------------------------------------------------------------------------------------------------------------------

EURNZD: Bullish After the News 🇪🇺🇳🇿
EURNZD formed an inverted head & shoulders pattern
on a key daily support cluster.
We see a bullish breakout of its neckline and a strong bullish momentim
after EU inflation data today.
Odds are high that the pair will rise at least to 2.0335 level.
❤️Please, support my work with like, thank you!❤️
I am part of Trade Nation's Influencer program and receive a monthly fee for using their TradingView charts in my analysis.

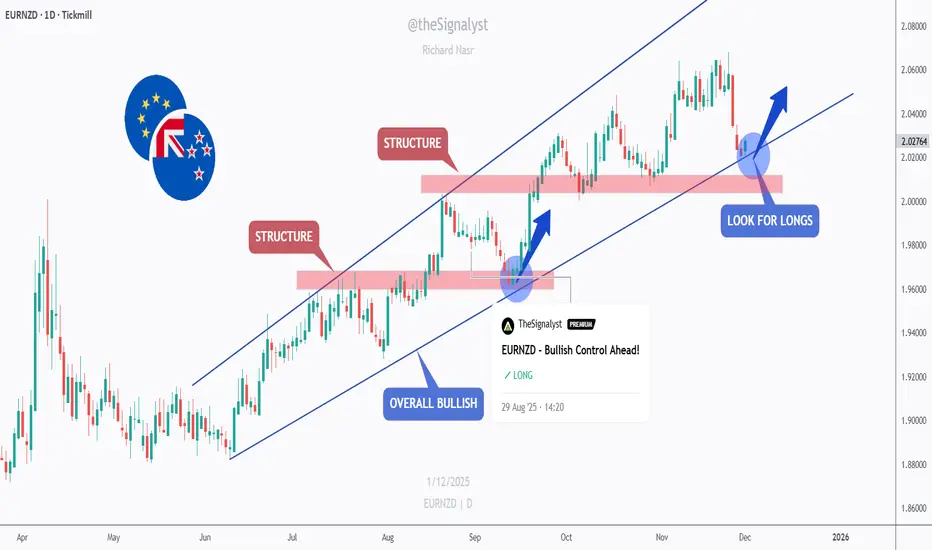
EURNZD - Bulls Eyeing the Structure Zone... Again!📈EURNZD remains overall bullish, moving cleanly inside its rising channel. Each dip toward the lower bound has acted as a strong continuation zone, with buyers consistently stepping in to drive the next upward wave.
🏹As price approaches the lower trendline and the red structure zone, we will be looking for trend-following longs. This area has served as a key support multiple times, making it a high-probability level for the bulls to re-enter the market.
⚔️As long as EURNZD holds above this structure, the bullish trend remains intact and a new push toward higher highs becomes the most likely scenario. Only a confirmed break below the structure would weaken the bullish outlook.
Now we wait for the reaction at structure… will the bulls defend it once again? 🤔
⚠️ Disclaimer: This is not financial advice. Always do your own research and manage risk properly.
📚 Stick to your trading plan regarding entries, risk, and management.
Good luck! 🍀
All Strategies Are Good; If Managed Properly!
~Richard Nasr
EURNZD BEARISH BREAKOUT|SHORT|
✅EURNZD has broken down from the supply level and is now trading in a discount leg, with liquidity resting below recent equal lows. As long as order flow stays bearish, the draw remains toward the target zone. Time Frame 7H.
SHORT🔥
✅Like and subscribe to never miss a new idea!✅

EUR-NZD Free Signal! Sell!
Hello,Traders!
EURNZD Price broke through the supply zone, confirming bearish orderflow as the breakout shifts structure lower. A clean mitigation of the origin block suggests continuation toward the downside target.
--------------------
Stop Loss: 2.0286
Take Profit: 2.0159
Entry: 2.0236
Time Frame: 4H
--------------------
Sell!
Comment and subscribe to help us grow!
Check out other forecasts below too!
Disclosure: I am part of Trade Nation's Influencer program and receive a monthly fee for using their TradingView charts in my analysis.

EUR/NZD SENDS CLEAR BEARISH SIGNALS|SHORT
Hello, Friends!
EUR/NZD pair is trading in a local uptrend which we know by looking at the previous 1W candle which is green. On the 12H timeframe the pair is going up too. The pair is overbought because the price is close to the upper band of the BB indicator. So we are looking to sell the pair with the upper BB line acting as resistance. The next target is 2.033 area.
Disclosure: I am part of Trade Nation's Influencer program and receive a monthly fee for using their TradingView charts in my analysis.
✅LIKE AND COMMENT MY IDEAS✅
