EURUSD: Triangle Resistance Holds - Bearish Bias Toward 1.1730Hello everyone, here is my breakdown of the current EURUSD setup.
Market Analysis
EURUSD previously traded within a well-defined consolidation range, where price moved sideways for an extended period, reflecting temporary balance between buyers and sellers and gradual liquidity accumulation. This range eventually resolved to the downside, initiating a sustained bearish move that developed into a clean downward channel, marked by consistent lower highs and lower lows. This structure confirmed strong seller control and an orderly bearish continuation rather than a panic-driven sell-off. After reaching the lower boundary of the descending channel, selling pressure weakened and price staged a corrective rebound. This rebound led to a breakout above the channel resistance and triggered a sharp bullish impulsive move, which reclaimed the Support Zone and extended into the Resistance Zone around 1.1800–1.1810.
Currently, EURUSD is trading below the Triangle Resistance Line, with price showing a weak pullback and consolidation just under the resistance zone. This behavior suggests a classic bearish retest scenario, where former support has flipped into resistance. The lack of impulsive bullish continuation and repeated rejections from the triangle resistance further reinforce the bearish bias.
My Scenario & Strategy
My primary scenario favors short continuation, as long as EURUSD remains below the 1.1800 Resistance Zone and the descending triangle resistance line. The recent bullish push appears corrective and liquidity-driven rather than the start of a sustainable trend reversal. From a structural perspective, the market has failed to reclaim higher highs, and the rejection from resistance confirms that sellers remain in control. As long as price stays capped below resistance, rallies are viewed as selling opportunities rather than signals of bullish continuation. The first downside objective lies near the 1.1730 Support Zone, which represents a key demand area and a prior reaction level. This zone is expected to act as the first major downside target where buyers may attempt a reaction or short-term stabilization. If EURUSD reaches the support zone and shows strong rejection or consolidation, a temporary bounce is possible.
However, a decisive breakdown and acceptance below 1.1730 would confirm further bearish continuation and open the door for a deeper move toward lower demand areas. The short bias remains valid as long as price respects resistance and the descending structure stays intact. A clean breakout and acceptance above the triangle resistance and the 1.1800 zone would invalidate the short scenario and shift focus back toward bullish continuation. Until then, overall structure clearly favors sellers.
That’s the setup I’m tracking. Thank you for your attention, and always manage your risk.
Euro

EURUSD Bullish Recovery After Healthy Correction, Target 1.1870Hello traders! Here’s my technical outlook on EURUSD (4H) based on the current chart structure. EURUSD previously traded within a mixed structure that transitioned from a broader corrective phase into a clear bullish recovery. After forming a base near the rising higher-timeframe trend line, price began to print higher lows, signaling the gradual return of buyer control. This recovery phase was supported by a breakout above the descending triangle resistance line, which marked an important structural shift and confirmed the end of the prior bearish pressure. However, after reaching the upper Resistance / Seller Zone around 1.1870, bullish momentum slowed, and the market faced rejection from this key level. This rejection initiated a corrective pullback, which brought price back toward the former breakout area and the Support Level / Buyer Zone near 1.1780–1.1800. This zone is significant, as it represents previous resistance turned support and aligns with the rising triangle support line, making it a critical area for buyers to defend. Currently, EURUSD is stabilizing above this support zone, suggesting that the pullback is corrective rather than the start of a new bearish leg. As long as price holds above the Buyer Zone and continues to respect the rising support structure, the overall bias remains bullish. My primary scenario favors continuation to the upside after consolidation or a shallow pullback, with a potential move back toward the 1.1870 Resistance Level (TP1). This area stands as the first major upside target and a logical zone for partial profit-taking. If EURUSD manages to break above the 1.1870 resistance with strong acceptance, this would confirm bullish continuation and open the door for further upside expansion. On the other hand, a decisive breakdown and acceptance below the Buyer Zone and rising support line would invalidate the bullish scenario and signal a deeper correction. Until such confirmation appears, EURUSD remains positioned for a bullish continuation within the current market structure. Always manage your risk and trade with confirmation. Please share this idea with your friends and click Boost 🚀

EURGBP Channel Down topped. Sell Signal.The EURGBP pair has been trading within a Channel Down since the November 14 2025 High. Yesterday the price hit the pattern's Top (Lower Highs trend-line) and got rejected exactly on the 1D MA50 (blue trend-line), similar to the previous Lower High.
That High initiated a -1.52% Bearish Leg and we expect the market to drop at least by the same % as it's the minimum Bearish Leg drop it had within this Channel Down. As a result, our Target s 0.85900, which would also make a perfect test of the 1W MA200 (red trend-line), the market's natural long-term Support.
---
** Please LIKE 👍, FOLLOW ✅, SHARE 🙌 and COMMENT ✍ if you enjoy this idea! Also share your ideas and charts in the comments section below! This is best way to keep it relevant, support us, keep the content here free and allow the idea to reach as many people as possible. **
---
💸💸💸💸💸💸
👇 👇 👇 👇 👇 👇

EURUSD: Buyers Defend 1.1780 - Upside in Focus 1.1870Hello everyone, here is my breakdown of the current EURUSD setup.
Market Analysis
EURUSD was previously trading within a well-defined downward channel, where price consistently respected the descending resistance and support boundaries, forming a series of lower highs and lower lows. This structure confirmed sustained bearish control and orderly downside continuation. During this phase, several bearish pushes developed smoothly within the channel, highlighting strong seller dominance. After breaking the channel, EURUSD continued higher and successfully reclaimed the Support Zone around 1.1780, which acted as a key decision level. The breakout and subsequent hold above this zone confirmed a change from bearish structure into a bullish recovery phase. Price then accelerated toward the 1.1870 Resistance Zone, where supply became active again, resulting in consolidation and multiple breakout attempts.
Currently, price is trading above the rising trend line, while also forming a descending corrective structure beneath the triangle resistance line. Despite the pullback, the market continues to respect higher lows, suggesting that the recent decline is corrective rather than impulsively bearish. The ability of EURUSD to hold above the support zone keeps the bullish structure intact.
My Scenario & Strategy
My primary scenario favors a long continuation as long as EURUSD holds above the 1.1780 Support Zone and respects the rising trend line. The current consolidation appears to be a corrective pause within a broader bullish structure. A successful break and acceptance above the triangle resistance and the 1.1870 Resistance Zone would likely trigger renewed upside momentum. If buyers manage to reclaim and hold above resistance, the next bullish leg could extend higher, following the direction of the dominant trend.
However, a decisive breakdown below the support zone and trend line would weaken the bullish scenario and signal a potential deeper correction or range formation. For now, structure favors buyers, with pullbacks viewed as opportunities for continuation rather than trend reversal. EURUSD remains at a key technical decision area, and price reaction around support will be critical for the next move.
That’s the setup I’m tracking. Thank you for your attention, and always manage your risk.

Coinranger|EURUSD. Continued decline🔹DXY continues to move higher. Potential to reach 98.353 - the first extension of the upward move
🔹This evening at 18:00 UTC+3, the JOLTS employment report
🔹The earnings season continues in the US.
By level:
Above
1.18500 - first upward move
1.18715 - or here
1.19100 - full upward move
1.19420 - first extension
Below
1.17763 - full downward move
1.16500 - first downward extension
There's a chance of a slight pullback and then a further decline, or a significant drop from the current level. There are a potential early stops possible at M15 levels.
---------------
Share your thoughts in the comments!

EURUSD Market StructureEURUSD is trading mid-range.
London is set to push price into a key area: 1.1798–1.1803.
This suggests potential delivery into premium as we head into NY.
HTF bias remains bearish.
I’m only interested in shorts after premium is tapped and structure confirms.
No confirmation, no trade.
If it shows up, I execute.
If not, I stay flat.

EURUSD - Analysis and EducationHere is an analysis on EURUSD and some learnings regarding liquidity, efficiency, and the manipulations that take place.
- R2F Trading

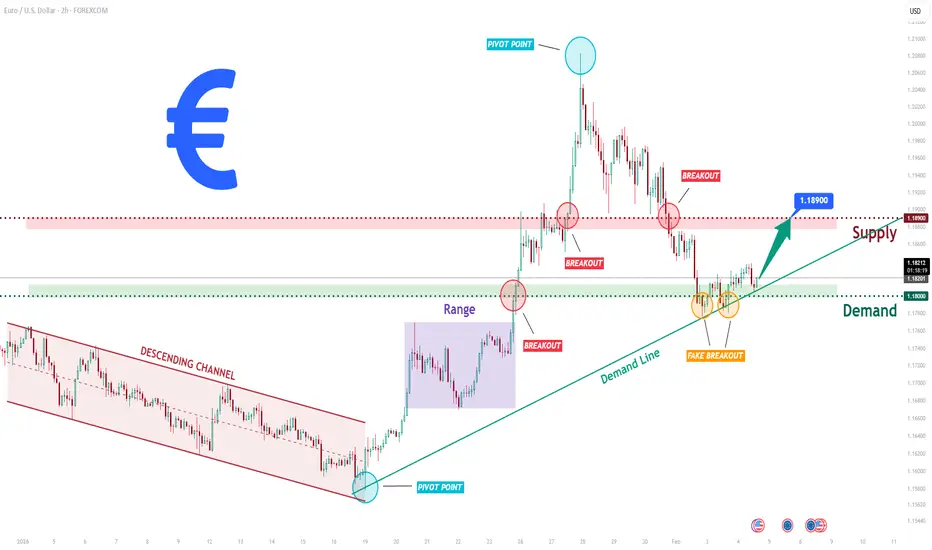
EURUSD Long: Demand Zone Holds - Bulls Preparing Next LegHello traders! Here’s a clear technical breakdown of EURUSD (2H) based on the current chart structure. EURUSD previously traded within a well-defined descending channel, where price consistently respected the descending resistance and support lines, forming a series of lower highs and lower lows. This structure confirmed sustained bearish pressure and orderly downside continuation. The bearish phase eventually reached a key pivot point, where selling momentum weakened and buyers began to step in. Following this pivot, price broke out of the descending channel and transitioned into a ranging phase, indicating temporary balance between buyers and sellers after the trend shift. This range acted as an accumulation zone before the next impulsive move. A clean bullish breakout above the range confirmed renewed buyer control and initiated a strong impulsive rally to the upside.
Currently, EURUSD is pulling back from supply and retesting the Demand Zone around 1.1800, which aligns closely with a rising demand trend line. A brief fake breakout below demand has already occurred, followed by a quick recovery back above the level — a strong sign that sellers failed to gain acceptance below support. This behavior suggests that the current pullback is corrective rather than a full trend reversal.
My primary scenario, as long as EURUSD holds above the 1.1800 Demand Zone and continues to respect the rising demand line, the bullish structure remains intact. A sustained reaction from this area could lead to a renewed upside move, targeting a retest of the 1.1890 Supply Zone (TP1). A clean breakout and acceptance above supply would confirm bullish continuation and open the door for further upside expansion. However, a decisive breakdown and acceptance below the demand zone and trend line would invalidate the bullish scenario and signal a deeper corrective phase. For now, structure, trend, and price behavior continue to favor buyers, with demand acting as the key battlefield. Manage your risk!
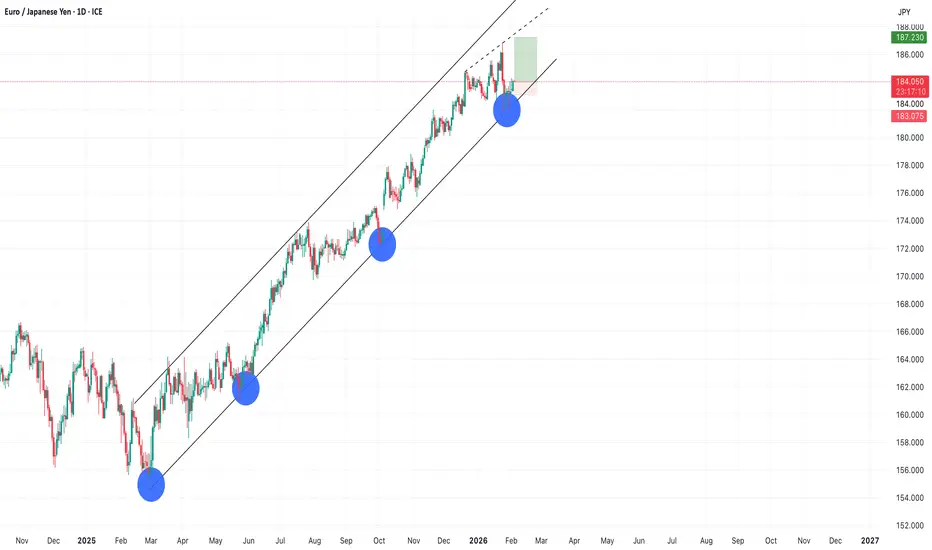
EURJPY LongWe are currently observing a strong uptrend in the EUR/JPY pair. Price action remains well supported within the ascending channel, showing no signs of a breakdown. I expect the pair to print a new high. In the event of a reversal, risk can be managed by placing a stop loss below the previous day’s low.
EURUSD Bulls Take Control - 1.1940 as Next TestHello traders! Here’s my technical outlook on EURUSD (3H) based on the current chart structure. EURUSD previously traded within a well-defined ascending channel, where price consistently respected both the rising support line and the channel resistance, confirming steady bullish control and healthy trend conditions. During this phase, the market printed higher highs and higher lows, showing strong buyer dominance. However, after reaching the upper boundary of the channel, bullish momentum began to weaken, and price transitioned into a corrective phase. This correction unfolded gradually, signaling profit-taking rather than an immediate trend reversal. Following the pullback, EURUSD formed a rising triangle structure supported by a clear ascending support line. Price then broke impulsively to the upside, signaling a structural shift and renewed buying interest. This breakout pushed price above the Buyer Zone around 1.1860, confirming acceptance above previous resistance turned support. The bullish impulse extended into the Seller / Resistance Zone near 1.1940, where price is currently reacting. At this level, sellers have started to show interest again, and price is consolidating below the resistance, indicating hesitation and potential short-term exhaustion after the strong rally. Structurally, the Buyer Zone around 1.1840–1.1860 now acts as a key support area. As long as price holds above this zone and respects the rising triangle support line, the broader bullish structure remains intact. A sustained hold above support favors a continuation move toward the 1.1940 Resistance Level, which stands as the primary upside target (TP1). This level also represents a critical decision zone where either continuation or rejection is likely to occur. My scenario: holding above the Buyer Zone keeps the bullish continuation scenario valid, with a potential retest of the 1.1940 Resistance Level. A clean breakout and acceptance above this resistance would open the door for further upside expansion. However, a strong rejection from resistance followed by a breakdown below the Buyer Zone would invalidate the bullish bias and signal a deeper corrective move. For now, EURUSD is trading at a key structural area, with buyers attempting to defend support and push price higher. Please share this idea with your friends and click Boost 🚀

Coinranger|EURUSD. Potential return to growth🔹DXY has made its first wave up. The potential of a move is still up to 97.43, but we could already be starting to reverse.
🔹Manufacturing PMI (18:00 UTC+3) and budget funding vote today
🔹The earnings season continues in the US
Levels:
Above
1.21657 - first extension up
1.20657 - full set up
1.20000 - first wave up
Below
1.18470 - first wave down
1.17763 - full set down
1.16500 - first extension down
The situation is unclear for now. While the PMI will influence the trend, it's difficult to say how the pice will react on the vote. Let's watch the US session.
---------------
Share your thoughts in the comments!

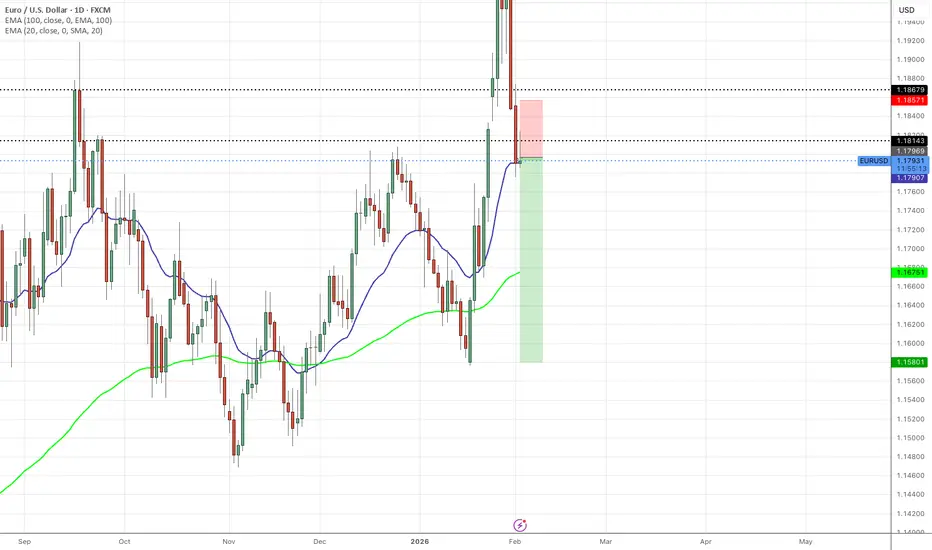
EURUSD SHORTS - IMMENSE SELL PRESSURE CONTINUATIONAfter closing in profit yesterdays move i am expecting a continuation of EURUSD sells.
EURUSD has failed to maintain price above 1.18679 support zone, we can see immense selling pressure on the daily and on the weekly a bearish pin bar candle this also in confluence with the dollars strength and the rising dollar.
I am expecting the pair to continue this downside momentum.
TP1: 1.17500
TP2; 1.16768
EURUSD SHORTS - IMMENSE SELL PRESSURE EURUSD has failed to maintain price above 1.18679 support zone, we can see immense selling pressure on the daily and on the weekly a bearish pin bar candle this also in confluence with the dollars strength and the rising dollar.
I am expecting the pair to continue this downside momentum.
TP1: 1.17500
TP2; 1.16768

EURUSD last move before we dumpRisky trade with a good R/R
I believe we have one more move before we crash down on euro and get bullish on dollar pairs
fasten your seatbelts!! FX:EURUSD

EURUSD closed January below the 1M MA200! Bear Cycle confirmed?The EURUSD pair closed last month's (January's) 1M candle below its 1M MA200 (orange trend-line) even though it broke above it for the first time in 8 years (since February 2018)! As mentioned on our last week's analysis, that was would be a strong bearish signal long-term, as the pair hasn't closed a 1M candle above the 1M MA200 since November 2014 and every test or approach near it was a market Top, like January 2021 and February 2018.
So as long as the market keeps closing monthly candles below its 1M MA200, we will stay bearish, looking towards a 2-year Bear Cycle, similar to 2021 - 2022 and 2018 - 2019. As mentioned last week, we have a minimum Target at 1.0200 (near the Jan 2025 Low Support) for this Bear Cycle.
In addition, look the huge 1M RSI Lower Highs Bearish Divergence (against the price's Higher Highs) following the June 2025 rejection on the 8-year Resistance. An extra signal of strength reversal.
---
** Please LIKE 👍, FOLLOW ✅, SHARE 🙌 and COMMENT ✍ if you enjoy this idea! Also share your ideas and charts in the comments section below! This is best way to keep it relevant, support us, keep the content here free and allow the idea to reach as many people as possible. **
---
💸💸💸💸💸💸
👇 👇 👇 👇 👇 👇

EURUSD WEEKLY OUTLOOKPrimary focus:
– EURUSD
– London & NY sessions
What to lookout for:
Is price expanding or ranging?
No rush.
No forcing trades.
Let the market come to us.

EURGBP LONGSWe can see that EURGBP price has been consolidating and struggling to break support at 0.86570 support level, at the level it is clear that there are buyers still in the market ready.
I am expecting a push higher from here back into the range its trading within highs at 0.87294.
On the flipside if the pair fails to break higher and the support level at 0.86570 fails we will see a sharp free fall in EURGBP
TP1: 0.87294

EUR/USD: Trump’s Dollar Strategy and the Euro’s PivotThe EUR/USD pair currently sits at a historic geopolitical crossroads. President Trump’s recent embrace of a weaker dollar has ignited a new downtrend for the greenback. This shift follows years of dollar dominance. Markets now scramble to adjust to this radical departure from traditional American monetary policy.
The Managed Descent of the Greenback
The Trump administration actively seeks a weaker dollar to fuel American exports. A lower currency value makes U.S.-manufactured goods more competitive abroad. This strategy aims to re-industrialize the American heartland by breaking decades of "Strong Dollar" rhetoric. Investors interpret this move as the start of a long-term bearish trend for the dollar.
ECB Unease and European Fragility
The European Central Bank (ECB) views these developments with mounting concern. A surging Euro threatens the Eurozone’s export-led recovery. Officials in Frankfurt fear a significant loss of industrial competitiveness. Germany’s manufacturing engine relies on a balanced exchange rate to sell goods globally. Geostrategy now dictates a tense standoff between the ECB and the U.S. Treasury.
Fintech, Patents, and Digital Dominance
Currency fluctuations directly impact high-tech investment and patent acquisition. A weaker dollar makes foreign intellectual property more expensive for U.S. firms. Conversely, European tech companies face higher operational costs when expanding into the American market. Patent analysis shows a spike in blockchain-based cross-border payment systems to reduce reliance on traditional fiat exchange.
Cybersecurity and High-Tech Volatility
Cybersecurity remains a critical frontier for currency stability in 2026. State-sponsored actors increasingly target exchange infrastructures to manipulate currency sentiment. High-tech trading firms now deploy advanced AI to detect these digital intrusions. These algorithms drive over 80% of current EUR/USD trading volume. Science-led modeling suggests that digital resilience will soon dictate a currency’s global standing.

Lingrid | EURUSD will continue to riseThis EURUSD daily chart is a clean “market-regime” story:
📉 THEN (2018–2020)
A falling channel dominated — slow grind lower.
📈 THEN (2020–2021)
A regime flip into a rising channel — strong recovery trend.
⏸ THEN (2021)
Compression (triangle) — uncertainty before the next leg.
📉 THEN (2021–2022)
Another falling channel — a full bearish cycle into the lows.
🔄 THEN (2023–2025)
Wide channel / range — digestion and base building.
✅ NOW (2025–2026)
Price broke out of the range and is trending up inside a rising wedge.
That usually means:
• bullish structure is still active
• but momentum often slows near the top of the wedge
• pullbacks become more probable (healthy reset) before any next push higher
📌 My simple map (2 scenarios)
1) Base case (healthy pullback → continuation):
A pullback into the mid / lower part of the wedge, then buyers try to defend it and continue higher.
2) Risk case (wedge fails):
A daily breakdown below the wedge support + failed reclaim can send price back toward the prior range / channel.

EURUSD Short: Fake Breakout at Supply, Pullback to 1.1850Hello traders! Here’s a clear technical breakdown of EURUSD (4H) based on the current chart structure. EURUSD initially traded within a well-defined ascending channel, confirming a strong bullish environment with consistent higher highs and higher lows. This phase reflected clear buyer control and healthy trend continuation. After reaching the upper boundary of the ascending channel, price lost momentum and transitioned into a descending corrective channel, signaling a temporary pullback rather than a full trend reversal. The corrective move remained orderly, with price respecting the descending structure and gradually compressing toward the lower boundary. At the lower edge of the descending channel, EURUSD formed a clear pivot point, where seller pressure weakened and buyers stepped back in aggressively. This led to a bullish breakout from the descending channel, confirming the end of the corrective phase. Following the breakout, price accelerated sharply higher, impulsively breaking above the key Demand Zone around 1.1850, which previously acted as resistance. This clean structure flip confirmed strong buyer commitment and renewed bullish momentum.
Currently, price then surged directly into the higher-timeframe Supply Zone around 1.2000–1.2050, where a fake breakout occurred. The rejection from this area suggests that sellers are active at the highs and that the market may be temporarily overextended after the strong impulse. Such behavior often leads to a corrective retracement rather than immediate continuation.
My primary scenario is a corrective pullback from the supply zone toward the 1.1850 Demand Zone (TP1). This level represents former resistance turned support and is a key area where buyers previously entered aggressively. As long as EURUSD holds above this demand zone, the broader bullish structure remains intact, and any pullback should be viewed as corrective within an overall uptrend. A strong bullish reaction and stabilization from the demand area could open the door for another attempt higher toward the supply zone and potentially new highs. However, a decisive breakdown and acceptance below the 1.1850 demand zone would weaken the bullish bias and increase the probability of a deeper correction. For now, the market favors buyers, with the current move best interpreted as a pullback after a strong impulsive rally. Manage your risk!

EURUSD: Rally Stalls at Resistance - Correction To 1.1860Hello everyone, here is my breakdown of the current EURUSD setup.
Market Analysis
EURUSD has recently transitioned from a prolonged consolidation into a strong impulsive bullish move. After respecting a rising trend line and repeatedly breaking above the descending triangle resistance, price showed increasing bullish momentum, confirming a structural shift to the upside. This breakout led to a sharp rally, pushing EURUSD into the higher price area and directly into a clearly defined Resistance Zone around 1.1940–1.1950. At this resistance, price behavior has changed noticeably. After the initial breakout above the zone, EURUSD failed to sustain acceptance at higher levels and printed signs of exhaustion, including a false breakout and rejection wicks. This suggests that buyers may be losing control near this key resistance, while sellers are beginning to step in.
Currently, price action shows hesitation and consolidation below the resistance, indicating a potential distribution phase rather than continued impulsive strength. Below the current price, the Support Zone around 1.1860 stands out as a critical area. This zone previously acted as resistance and was later flipped into support during the bullish breakout, making it a key level for short-term structure. A pullback toward this support would align with a healthy corrective move within the broader context. Overall, while the higher-timeframe trend recently turned bullish, the market is now reacting at a major resistance level, and the structure suggests that the current move may be corrective rather than a continuation breakout.
My Scenario & Strategy
My primary scenario favors a short setup as long as EURUSD remains below or shows clear rejection from the 1.1940–1.1950 Resistance Zone. A confirmed rejection from this area could trigger a corrective move back toward the 1.1860 Support Zone, where buyers may attempt to re-enter. If selling pressure accelerates, a deeper pullback toward the rising trend line could follow.
However, if price achieves a clean breakout and strong acceptance above 1.1950, this would invalidate the short bias and open the door for further bullish continuation. For now, EURUSD is at a key decision point, and patience is required to see whether sellers can defend resistance or buyers regain control above it.
That’s the setup I’m tracking. Thank you for your attention, and always manage your risk.

EURUSD Reclaims Key Structure - Upside Toward 1.2050Hello traders! Here’s my technical outlook on EURUSD (2H) based on the current chart structure. After an extended consolidation phase, EURUSD initially traded within a clearly defined range, reflecting market indecision and balance between buyers and sellers. This ranging behavior laid the groundwork for a larger directional move. Eventually, price broke below the range and continued to trade inside a descending channel, confirming bearish control and a structured corrective phase. Sellers consistently defended the upper boundary of the channel, while price respected the descending resistance and support lines. As the downtrend matured, selling momentum gradually weakened, leading to a breakout above the descending channel resistance. This breakout marked a critical structural shift and the beginning of a bullish impulse. Following the breakout, EURUSD accelerated higher, breaking above the Buyer Zone around the 1.1920 area, which previously acted as a key resistance. This move confirmed a transition from bearish correction into bullish expansion, with buyers clearly regaining control of the market. Currently, price is trading above the Buyer Zone and holding above a rising triangle support line. A brief fake breakout below the ascending support was quickly absorbed by buyers, reinforcing the strength of demand and validating the support level. This price behavior suggests that the pullback was corrective rather than impulsive, allowing the market to reset before continuation. EURUSD is now approaching the Seller Zone / Resistance Level around 1.2050, which represents a major reaction area where selling pressure may increase. My scenario: as long as EURUSD holds above the Buyer Zone and continues to respect the ascending support structure, the bullish bias remains intact. A continuation toward the Resistance Level at 1.2050 is expected, with this area acting as TP1. A clean breakout and acceptance above the Seller Zone would confirm further upside continuation and open the door for higher targets. However, a strong rejection from resistance combined with a breakdown below the ascending support and Buyer Zone would signal the start of a deeper corrective phase. For now, structure, momentum, and price action favor buyers, with the current pullback behavior suggesting consolidation before a potential continuation move. Please share this idea with your friends and click Boost 🚀

EURUSD has formed a bearish head and shoulders pattern on the 4H🚨📊 EURUSD Update
EURUSD has formed a bearish head and shoulders pattern
on the 4H timeframe .
Price has broken below the neckline ❌,
suggesting a downtrend continuation for the Euro 📉.
🔹 First target:
the green line level 🎯
🔹 After that, price could move toward
the blue support zone 🔵,
where a potential bounce may occur.
Structure remains bearish
until price reclaims key levels.
