EUR SHORTS 1) GBP took these August lows and dosent reverse
2) creating SMT on high with GBP shows strenght switch , so that now euro can short to these lows
3) Targeting August lows.
Eurshort

EUR/USD Bearish Setup – 1hEUR/USD 15M Analysis:
Price is approaching marked seller zones. Expecting a potential retracement toward 1.15897–1.15986 before a bearish rejection. A clean break below 1.15832 could open the path toward 1.15728 and lower levels. Watching market structure, liquidity sweep, and bearish order blocks for confirmation. This is a technical outlook, not financial advice.

Euro Sentiment: What’s Ahead in the Next Few DaysRetail positioning tells a clear story:
70% short / 30% long on EUR/USD
→ That’s a textbook setup for a long .
The crowd is bearish — but structure favors bulls.
From a technical standpoint, we’re seeing a solid corrective move up from 1.15, with even a mini-higher high – higher low pattern forming — yes, like the ones in classic TA textbooks.
It looks not just logical… but inviting.
Now let’s look at the options market:
There’s real bullish momentum building:
1. Naked calls being bought
2. Call spreads actively traded
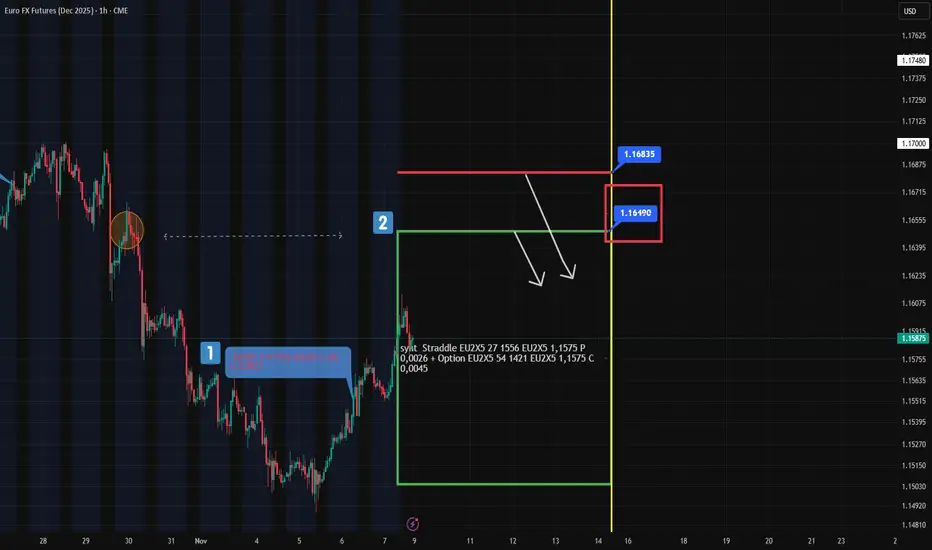
My focus is on two key structures:
First, the call at 1.165, entered on November 6 — now already in the money (#1 at chart)
Friday’s straddle at 1.1575 — its upper boundary aligns perfectly with the trigger level from October 29 (#2 at chart)
🎯 Confluence? Yes.
🔍 Putting It All Together:
We have fuel for further upside in EUR:
Retail overcrowded short
Technical structure improving
Options flow turning bullish
But resistance looms ahead:
1.1649 and up to 1.1683 (futures prices) are strong zones
These levels could cap the upside move and offer high-probability short setups
👉 In particular, 1.1649 stands out as an ideal zone to consider a short.
On Monday, I’ll calculate the Expected Range (ER) levels — and if it aligns with this resistance, I’ll definitely place a limit order here.
Not using ER levels yet?
Spend one minute learning them — and gain the edge most traders overlook.

EURUSD – Bearish Channel Continuation on H1EURUSD – Bearish Channel Continuation on H1
Market Overview
EURUSD remains firmly within a descending channel, reinforcing the bearish market structure. Recent rebounds have been rejected at supply zones, with liquidity still concentrated at lower price levels. As long as price trades inside this channel, selling rallies remains the preferred strategy.
Technical Context
The bearish channel is intact, with strong seller defence around 1.1720–1.1790.
Key resistance: 1.1753 and 1.1820. A sustained break above 1.1820 would weaken the bearish outlook.
Downside liquidity targets remain at 1.1630, with scope to extend towards 1.1575 if momentum accelerates.
Trading Scenarios
🔻 Priority – Sell Setups
Sell Setup 1
Entry: 1.1720 – 1.1730
Stop Loss: 1.1750
Take Profit: 1.1695 – 1.1670 – 1.1652 – 1.1630
Sell Setup 2
Entry: 1.1780 – 1.1790
Stop Loss: 1.1810
Take Profit: 1.1755 – 1.1730 – 1.1700 – 1.1675
🔹 Alternative – Buy Setup (countertrend only)
Buy Setup
Entry: 1.1630 – 1.1620
Stop Loss: 1.1600
Take Profit: 1.1660 – 1.1680 – 1.1700
Note: This is only valid if price retests the 1.1620–1.1630 demand zone, where a corrective bounce may develop.
Risk Management & Outlook
Bias: Maintain a bearish stance while price remains inside the channel.
Invalidation: A confirmed H1/H4 close above 1.1820 would cancel the bearish view.
Downside Target: A clean break below 1.1630 could open the path towards 1.1575.
✅ Conclusion:
EURUSD remains in a clear downtrend channel. The focus should be on selling into rallies at resistance, with targets set lower. Long trades can be considered only at strong demand levels and should be viewed as short-term corrections, not trend reversals.

EUR/USD (2H) Analysis – SMC + Elliott Wave ViewOn the 2H timeframe, price is respecting both SMC supply zones and Elliott Wave corrective structure.
🔹 Elliott Wave Structure:
We are currently unfolding in a Corrective A–B–C pattern.
Wave A completed with strong downside impulse.
Wave B retraced into supply zone but failed to break structure.
Now, wave C is developing, with expectation of further downside toward the 1.1650–1.1620 demand zone.
🔹 SMC Structure:
Price tapped into the sellers’ supply zone (1.1760–1.1780), aligning with previous order block and descending channel trendline.
Market structure remains bearish with lower highs & lower lows.
Liquidity below 1.1700 is the next target for smart money.
📉 Bias:
Looking for a rejection from the seller zone → continuation into the blue demand area marked as Wave C completion.
✅ Confluence:
Elliott Wave C-leg projection
Bearish order flow (SMC)
Supply zone rejection
Channel continuation
⚠️ Invalidation:
Bullish break and close above 1.1800 would invalidate this bearish scenario.

EUR/GBP H1 Analysis TodayEUR/GBP on the H1 chart is showing a strong uptrend from 0.8640 to 0.8740. After this surge, the price has formed a sideways consolidation range between 0.8730–0.8740, creating an opportunity for a technical pullback before continuing higher. The A → B → C pattern suggests a potential rebound from support B toward resistance C.
Key support and resistance levels:
Strong support (B): ~0.8725–0.8730, multiple bounces from this zone.
Current resistance (A → C): 0.8740 – 0.8750, a break above could continue the uptrend.
Medium-term level: 0.8770, breaking this confirms further bullish momentum.
Price behavior & Volumes:
The strong upward move before consolidation shows buyers are in control.
Volume during consolidation is lower, indicating the market is waiting for the next breakout.
If the price breaks resistance A, a continuation toward C is likely.
H1 Trading Strategies:
Breakout Trade:
Buy when price breaks 0.8740 with increased volume → target 0.8750–0.8770.
Sell if price breaks below 0.8725 → target 0.8710–0.8695.
Range Trade:
Buy at support 0.8730, stop-loss below 0.8720.
Sell at resistance 0.8745, stop-loss above 0.8750.
Recommended technical tools:
EMA 20 and EMA 50: Confirm short-term uptrend.
H1 RSI: RSI > 70 signals overbought, potential minor pullback before continuing upward.
Fibonacci retracement: From 0.8640 low → 0.8740 high to identify potential pullback zone 0.8725–0.8735.
Conclusion:
EUR/GBP is in a post-uptrend consolidation phase, waiting for a breakout to confirm the next bullish leg. Traders can trade within the range or wait for breakout while managing risk carefully.
Follow us for more breakout strategies and timely H1 intraday signals!

EURUSD – Key Resistance & Support Zones in Focus 1H🏛️ EURUSD – Key Resistance & Support Zones in Focus
📊 Current View:
Price is pressing up against a strong 1H resistance zone — multiple bearish FVGs here are likely to act as supply walls.
Below, shaded zones labelled “1H Support / Demand” are in the mix for a pullback.
🔀 What to Watch For:
If resistance holds → potential for a bearish reversal pattern into support.
If resistance breaks decisively → look for confirmation + possible continuation toward higher targets.
Pullbacks into support zones are prime areas to scan for bullish rejection signals.
📐 Levels & Targets:
Immediate resistance: ~1.18190–1.18200
Support zones: ~1.17840 / ~1.17780 or lower if weakness continues.
⚠️ Risk Considerations:
Be mindful of false breakouts — wait for candle‐structure, volume, or other confirmation.
🧠 My Bias: Slightly Bearish to Neutral — leaning short if resistance is respected, yet ready to flip bullish if resistance breaks with conviction.
Greetings,
MrYounity

EURUSD H4 | Bearish reversalBased on the H4 chart analysis, we can see that the price is reacting off the sell entry which is a pullback resistance that aligns with the 50% Fibonacci retracement and could reverse from this level to the take profit.
Sell entry is at 1.1815, which is a pullback resistance that aligns with the 50% Fibonacci retracement.
Stop loss is at 1.1867, which is a pullback resistance.
Take profit is at 1.1737, which is a pullback support.
High Risk Investment Warning
Trading Forex/CFDs on margin carries a high level of risk and may not be suitable for all investors. Leverage can work against you.
Stratos Markets Limited (tradu.com ):
CFDs are complex instruments and come with a high risk of losing money rapidly due to leverage. 65% of retail investor accounts lose money when trading CFDs with this provider. You should consider whether you understand how CFDs work and whether you can afford to take the high risk of losing your money.
Stratos Europe Ltd (tradu.com ):
CFDs are complex instruments and come with a high risk of losing money rapidly due to leverage. 66% of retail investor accounts lose money when trading CFDs with this provider. You should consider whether you understand how CFDs work and whether you can afford to take the high risk of losing your money.
Stratos Global LLC (tradu.com ):
Losses can exceed deposits.
Please be advised that the information presented on TradingView is provided to Tradu (‘Company’, ‘we’) by a third-party provider (‘TFA Global Pte Ltd’). Please be reminded that you are solely responsible for the trading decisions on your account. There is a very high degree of risk involved in trading. Any information and/or content is intended entirely for research, educational and informational purposes only and does not constitute investment or consultation advice or investment strategy. The information is not tailored to the investment needs of any specific person and therefore does not involve a consideration of any of the investment objectives, financial situation or needs of any viewer that may receive it. Kindly also note that past performance is not a reliable indicator of future results. Actual results may differ materially from those anticipated in forward-looking or past performance statements. We assume no liability as to the accuracy or completeness of any of the information and/or content provided herein and the Company cannot be held responsible for any omission, mistake nor for any loss or damage including without limitation to any loss of profit which may arise from reliance on any information supplied by TFA Global Pte Ltd.
The speaker(s) is neither an employee, agent nor representative of Tradu and is therefore acting independently. The opinions given are their own, constitute general market commentary, and do not constitute the opinion or advice of Tradu or any form of personal or investment advice. Tradu neither endorses nor guarantees offerings of third-party speakers, nor is Tradu responsible for the content, veracity or opinions of third-party speakers, presenters or participants.


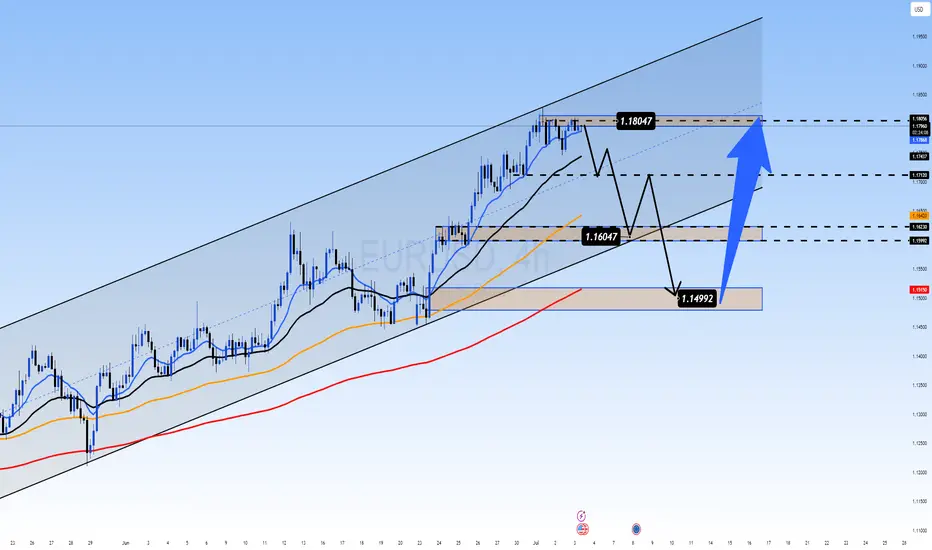
EUR/USD - Technical Analysis H1 (September 23, 2025)1. Current Trend
The chart is on the 1-hour timeframe (H1), showing a short-term uptrend after breaking out of the previous bearish channel.
Recent main trend: up from ~1.1720 to ~1.1830, followed by a minor pullback (point B).
2. Technical Pattern
We can identify an ABC correction / impulsive wave pattern:
A → B: corrective wave after a strong upward move.
B → C: expected continuation upward toward the ~1.1910 target (red arrow on chart).
The prior bearish channel has been broken, indicating selling pressure is weakening and bullish continuation is likely.
3. Key Support and Resistance Levels
Support:
1.1770–1.1780: near the B swing low, testing buying interest.
1.1720–1.1730: previous swing low before the upward move.
Resistance:
1.1830–1.1840: previous high at point A.
1.1900–1.1910: potential target for wave C, also a psychological level.
4. Trading Strategy
Buy near the B pullback:
Entry around 1.1770–1.1780.
Stop loss: below 1.1750 to protect against a break of B.
Take profit: around 1.1830 (short-term target) or 1.1900–1.1910 (wave C target).
Confirm bullish signals:
EMA 20/50 on H1 crossing upward.
RSI H1 not overbought, still room to rise.
Risk: If price breaks below 1.1750, short-term bullish trend may fail—consider reducing position size or staying out.
5. Summary
The chart is in a recovery phase after the bearish channel, and wave B offers a potential buying opportunity.
Wave C could reach 1.1900–1.1910, based on price action and the ABC pattern.
Combine EMA, RSI, and B support to confirm entry for safer trades.

EURUSD Breakdown or Double Bottom? Catalysts at Jackson Hole!EURUSD has broken below the key 1.16 support ahead of the Jackson Hole Symposium, raising the stakes for both bulls and bears as markets become more aware of the likelihood of a hawkish stance.
But will it be the case?
Let's see what the possible scenarios are at play.
Bearish Catalysts :
Hawkish Fed Signals: Recent FOMC minutes and a potential hawkish tone from Chair Powell could push EURUSD lower. Rate cut odds for December have dropped sharply, and further Fed focus on inflation may accelerate downside.
Technical Breakdown: The loss of 1.16 opens the door to 1.1530, 1.1460, and possibly 1.14. No clear bullish divergence on RSI suggests more downside risk.
Geopolitical Risks: Uncertainty around the Ukraine ceasefire could weigh further on the euro.
Bullish Catalysts :
Oversold Conditions: EURUSD is approaching oversold territory, with a potential double bottom forming near 1.1530/1.1460.
Dovish Surprise: If Powell signals concerns over the labour market or hints at a pause, a short-covering rally could target 1.16 and above.
ECB Commentary: Any unexpected hawkishness from ECB President Lagarde could support the euro.
Key Levels to Watch :
Support: 1.1530, 1.1460, 1.1400
Resistance: 1.1600, 1.1660
Trading Plan :
Volatility is likely post-symposium. Bears may look for breakdowns and rallies to resistance for entries, while bulls might watch for reversal signals at key supports if the Fed surprises dovishly.
This content is not directed to residents of the EU or UK. Any opinions, news, research, analyses, prices or other information contained on this website is provided as general market commentary and does not constitute investment advice. ThinkMarkets will not accept liability for any loss or damage including, without limitation, to any loss of profit which may arise directly or indirectly from use of or reliance on such information.

EUR/USD 1-Hour Rising Channel – Support Zone & Potential Upside!Chart Breakdown & Technical Insights
Rising Channel Structure
The chart clearly shows EUR/USD trading within a rising channel, marked by higher highs (red arrows) and higher lows (green arrows) forming parallel support and resistance trendlines.
Key Support Zone & Bounce Potential
The price is currently sitting near the ascending trendline support, highlighted by the shaded gray box and emphasized with a circled area. Many analysts note that this lower boundary—around the 1.1690 level—serves as crucial support on a broader time frame
.
Short-Term Momentum Indicators
According to recent technical calls, EUR/USD maintains a short-term bullish bias in the rising channel. However, some momentum indicators, such as RSI, hint at weakening strength—particularly when higher price highs are not matched with higher RSI peaks, suggesting a bearish divergence
Forex Crunch
.
Potential Upside Trajectory
Should the lower channel support hold, the chart suggests a rebound toward mid-channel or potentially up to the upper boundary. Analysts highlight the 1.1720–1.1750 area as a near-term resistance, with the upper channel boundary closer to 1.1850
Alternative Scenario – Breakdown Risk
If EUR/USD breaks below the channel (below ~1.1690), the bullish structure may falter. That could expose the pair to deeper pullbacks, possibly testing lower support levels around 1.1650 or lower
.
** Summary Table**
Scenario Likely Outcome
Bounce off support Move up toward mid-channel (~1.172) or channel top (~1.185)
Breakdown below support Decline toward lower support zones (1.1650 and below)
Conclusion & Strategy Snapshot
The price is positioned at a critical support within a well-defined rising channel.
The bullish favored path: a rebound from the lower trendline toward resistance levels.
The bearish risk: a breakdown would shift momentum, possibly leading to deeper retracements.
Monitor for price action signals (e.g. bounce, candlestick patterns), RSI behavior, and behavior around these key levels.

BEARISH ON EURUSDStrong bullish push on the Monthly TF and Bearish on DXY, expeting pullback. Daily TF traded into an FVG with indicision candle followed with bearish candle. BOS on 1H TF and pushing down.

SWING TRADE IN EURUSD SWING Trade in EURUSD.📉🔻
Swing opportunity is forming in EURO to Short
Follow for more swing analysis on Indices, Commodities
Dr. Iqra Shah

EURUSD Breaks Trendline: Bearish Momentum in PlayHello guys!
After months of climbing steadily along the ascending trendline, EURUSD has finally broken below support. The trendline breach, followed by a tight consolidation (yellow circle), hinted at a loss of bullish strength, and now the breakdown is in full motion.
Broken ascending trendline
Clear rejection after retest
Bearish continuation underway
Target area: 1.1400–1.1440 zone
If sellers maintain control, the price could descend toward the next major demand area.

Euro Drops Hard — Is a 100-Pips Slide Toward 1.1500 Next?Euro’s current situation doesn’t look great — we’re clearly seeing strong selling pressure across the board.
Price has now reached the block zones near 1.1600, and I want to break down what this area means to me.
The lower pivot of the 1.1600 zone was created after the 50% level of the previous bullish leg was consumed — which is typical in many bullish trends. Based on that, we expected a move toward 1.1800 to break the structure and continue the uptrend.
However, the recent bullish move lacked strength, which became quite clear during the last upward leg. And now, after that weak rally, we’re witnessing a sharp and aggressive selloff.
This reaction weakens the 1.1600 block in my eyes — and I’m now watching 1.1500 as the more probable target. It’s a major price level and also aligns with a bank-level midline zone.
In my view, it’s still too early to buy. I’d want to see price range and confirm before looking for longs.
That said, this area could be a good place to partially exit short positions and lock in some profits.
🔁 This analysis will be updated whenever necessary.
Disclaimer: This is not financial advice. Just my personal opinion!!!

Fiber (EU) This is my Analysis for the Eurousd, Fiber has been in down trend for years now and comparing the US Central bank interest rates with the European Central bank it shows that the Dollar is Stronger compared to the Euro, Blending the Fundamentals with Technical Analysis.

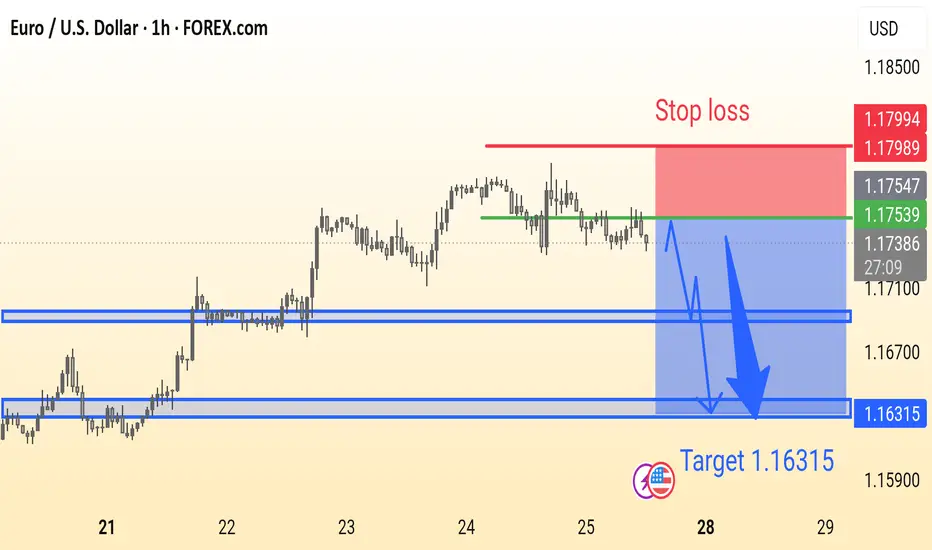
EURUSD Analysis is ReadyEUR/USD Trade Idea (1H Chart):
Price is ranging below resistance with a potential bearish breakout. Suggested Sell near 1.1753 with Stop Loss at 1.1799 and Target at 1.16315. Strong support zones marked for possible reaction.
Nearing the Top: A Final Push or Smart Money Liquidity Trap?EUR/USD – Nearing the Top: A Final Push or Smart Money Liquidity Trap?
🌍 MACRO OUTLOOK – EURO CLIMBS WHILE USD TREADS ON UNCERTAIN POLITICAL GROUND:
EUR/USD is trading just below the 1.1700 mark as investors remain cautious about the US dollar's long-term credibility. Growing concerns over the Federal Reserve’s independence — should the “Trump 2.0” scenario unfold — have weighed heavily on USD sentiment across global markets.
Meanwhile, the Euro is gaining support thanks to a relatively hawkish tone from the European Central Bank (ECB). Policymakers appear reluctant to ease policy prematurely, which supports the Euro through expectations of prolonged higher interest rates.
However, with no major catalyst in play yet, traders are watching closely for mid-tier US data and any upcoming statements from ECB officials that might set the tone for the next directional breakout.
📊 TECHNICAL ANALYSIS – H4 TIMEFRAME:
Market Structure: EUR/USD remains in a well-defined ascending price channel. However, the pair is now testing the upper band near the 1.1804 resistance, a key liquidity zone where sellers previously stepped in.
EMA Alignment: Price is trading above the EMA 13/34/89/200 cluster — a strong sign of sustained bullish momentum.
Momentum Indicators:
RSI is hovering near 70 — potential overbought territory.
ADX remains above 25 — confirming trend strength but signaling caution at extended highs.
FVG (Fair Value Gap): A visible unfilled gap between 1.1600 and 1.1640 could act as a magnetic zone for price to revisit before the next impulse move.
🔹 Key Resistance: 1.1804 – 1.1835
🔹 Key Support: 1.1640 – 1.1600 (gap zone)
🔹 Major Demand Zone: 1.1499 – 1.1515
🎯 TRADE PLAN:
Scenario 1 – Buy the Dip (Primary Bias):
Entry: 1.1600 – 1.1640
Stop Loss: 1.1550
Targets: 1.1750 → 1.1800 → 1.1850
Scenario 2 – Buy Deep Pullback:
Entry: 1.1499 – 1.1515
Stop Loss: 1.1450
Targets: 1.1640 → 1.1700
Scenario 3 – Countertrend Sell at Key Resistance (High Risk):
Entry: 1.1804 – 1.1830
Stop Loss: 1.1860
Targets: 1.1720 → 1.1650
📌 Strategic Insight:
EUR/USD may be setting up for either a breakout continuation above 1.1800 or a temporary reversal to sweep liquidity from the lower zones. Momentum favors bulls, but chasing highs without confirmation is risky. Focus on clean retracements and volume-supported entries.
💬 If EUR/USD drops back into the 1.1600 zone, will you load up for another leg higher — or wait for confirmation of trend strength? Share your view in the comments!
Chartanalyse: Der Chart zeigt eine Seitwärtskonsolidierung mitTechnical Overview:
The EUR/USD chart exhibits signs of a bearish reversal pattern forming near a key resistance zone (1.15800 - 1.16000), highlighted with repeated rejection wicks (🔴 red arrows). Price is currently trading at 1.15222, after failing to hold above the neckline of the rounded bottom pattern.
🔍 Key Observations:
🔺 Resistance Zone: Strong resistance has been confirmed multiple times (red arrows), indicating sellers are active at the top.
🟠 Double Top / Head & Shoulders Behavior: Price action shows topping formations (highlighted with orange circles), suggesting exhaustion of bullish momentum.
📉 Bearish Breakdown Possibility:
Price rejected near neckline and is showing bearish candle formations.
Breakdown from the current consolidation zone could push price toward the target zone at 1.14491, marked in purple.
This aligns with previous support structure, reinforcing a technical downside projection.
🔻 Support Zone: Around 1.13800 - 1.14000 is a strong area of demand and may act as the next bounce point if the bearish move continues.
📐 Chart Pattern Structure:
Rounded bottom formed earlier, but the failure to continue higher and breakout suggests a false breakout trap for buyers.
Downward sloping trendline broke, but now price is struggling to sustain above previous highs.
📌 Conclusion:
⚠️ Caution for bulls as price shows signs of weakness at resistance. A move below 1.15000 may initiate further downside toward 1.14491 and possibly lower. Short-term traders can watch for confirmation candles near this zone for entries.
📅 Short-Term Bias: Bearish
🎯 Target: 1.14491
⛔️ Invalidation: Strong breakout above 1.16000

EUR/USD Bearish Reversal AnalysisEUR/USD Bearish Reversal Analysis 📉🧭
🔍 Technical Breakdown:
Trend Structure:
EUR/USD was trading inside an ascending channel, respecting both support and resistance trendlines.
🔴 Double Rejection at Resistance:
Price action faced strong rejection near the upper boundary of the channel and resistance zone (~1.16500), forming a lower high, suggesting bearish exhaustion.
🟠 Key Breakdown Zone:
A critical horizontal support around 1.13560 has been identified as a short-term target zone. This level previously acted as a demand zone and now may be retested.
🔽 Forecast Path:
A projected bearish wave is anticipated:
A potential pullback or consolidation may occur before resuming the downtrend.
Once 1.13560 is broken, price could drop further toward the major support zone around 1.12000, marked by the previous accumulation area.
🟦 Support Zone:
This final target aligns with a major structural support from late May, strengthening the bearish outlook if the breakdown continues.
📌 Conclusion:
EUR/USD is showing signs of a bearish reversal after failing to sustain above resistance. As long as it remains below the mid-channel region, further downside toward 1.12000 is likely, with 1.13560 as the key short-term level to watch.

EUR/USD 1-Hour Chart Analysis1-hour candlestick chart for the Euro/US Dollar (EUR/USD) currency pair, sourced from OANDA. The chart highlights a recent price movement with a current value of 1.15510, reflecting a 0.29% decrease (-0.00340). Key price levels are marked, including resistance at 1.16142 and support at 1.14418, with shaded areas indicating potential trading zones. The chart includes a bullish logo and branding from "ALEEGOLDTRADER," suggesting a trading analysis perspective.
