EURUSDEURUSD
- Completely " 123 " Impulsive Waves
- Break of Structure
- RSI - Divergence
- Bullish Channel as an corrective pattern in Long Time Frame
- Fibonacci Level - 23.60% / 32.80%
Eurusd30m

EUR/USD)Bullish trend analysis Read the captionSMC Trading Point update
Technical analysis of EURUSD – 4H chart using SMC + trend continuation + EMA confluence.
⸻
Market Context
• Bias: Bullish
• Clear break in structure (BOS) to the upside
• Strong impulsive candles → institutional participation
• Price is trading above EMA 50 & EMA 200
• EMA 50 acting as dynamic support
⸻
Key Demand Zone (Blue Area)
~1.1715 – 1.1730
Confluence:
• Previous resistance → flipped to demand
• EMA 50 support
• Consolidation base before impulse
• Liquidity swept below prior lows before rally
This zone is the origin of the move, making it a high-probability re-entry area.
⸻
Trade Idea (Continuation Long)
Buy on pullback / buy on confirmation
• Entry: 1.1720 – 1.1730
• Stop Loss: Below demand (~1.1690)
• Targets:
• TP1: 1.1800 (recent high)
• Final TP: 1.1875 (marked target point / range high)
Risk–Reward: ~1:3+
⸻
Confirmation Triggers
Best confirmation inside demand:
• Bullish engulfing (4H or 1H)
• Long lower wicks rejecting the zone
• Lower-TF CHoCH
• Momentum expansion after pullback
⸻
Invalidation
• 4H close below 1.1690
• Acceptance below EMA 50 & demand zone
If that occurs → bullish continuation idea is invalid.
⸻ Mr SMC Trading point
Summary
This setup is a classic bullish continuation:
• Structure break
• Demand + EMA confluence
• Clean expansion leg targeting higher liquidity
Patience = edge. Let price retrace or confirm before entry.
If you want, I can:
• Refine this into a 1H / 15m execution model
• Or help you turn this into a repeatable SMC playbook
Please support boost this analysis

EURUSDBased on the chart structure, price is moving in line with the prevailing trend, with momentum confirmed by consecutive strong candles and sustained positioning relative to key dynamic levels. Recent swing behavior suggests continuation is favored unless price fails to hold the last valid reaction zone, which would signal a corrective or range phase.
Key Levels (Support & Resistance)
upport: Last major higher low / reaction zone formed at the start of the latest impulse
Support: Mid-range consolidation area inside the current trend
Resistance: Most recent broken swing high acting as the next supply zone
Resistance: Projected target based on the pre
vious impulse leg extension
FX:EURUSD

EURUSD LONG ReboundEURUSD Rebound towards the 2h orderblock on 86% fibbonacci level and after the TP is reached, sell until 38.2 fibbonacci level on daily timeframe.

EURUSD trade setup battle:-Today Euro made 3 months low with also break previous low and holding side . There we can setup a loss free trade setup ::-
Euro have strong support levels @ 1.06000 .
So we have to build buy and sell both position at this time :-
First we have to buy and sell on same strike price with same quantity and hold for target 1.06000 $ than we exit from sell side we get our target and hold buy position for target 🎯 1.08000 level.
Stay tuned with me for more updates and follow me.
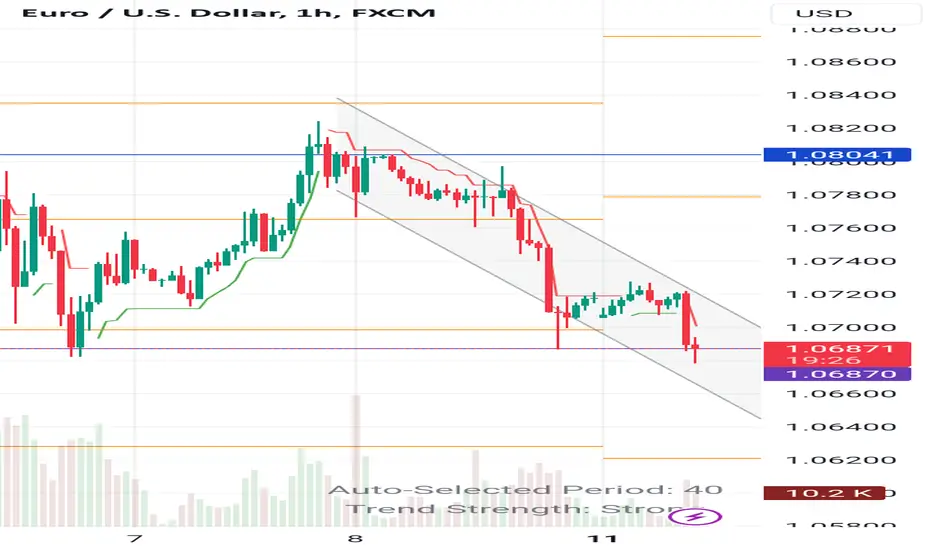
EURUSD price is moving sidewaysEURUSD: The EUR nowadays did now no longer decline however as a substitute is shifting up close to the 1.0740 resistance region. This is because of the weakening of the USD. Currently, due to the fact DXY is damaged and is possibly to maintain to weaken, nowadays`s model ace can pay interest to NONFARM. It is anticipated that EURUSD will possibly retest across the 1.0683 region and rebound. Consider in short promoting across the cutting-edge fee region and shopping for again across the 1.0680 guide region

EUR USD to keep moving upwards D1On Eurusd forecast look for buy opportunities only. EURUSD is on bullish trend

Deciphering the Euro's TrajectoryIn the intricate web of global currencies, the Euro stands as a pivotal player, navigating the currents of economic fluctuations and geopolitical shifts. As we delve into the realm of currency analysis, let us unravel the complexities shaping the Euro's journey.
At present, the Euro finds itself at a crossroads, buffeted by a myriad of factors. Economic data releases, central bank policies, and political developments all converge to influence its trajectory.
In recent months, the Euro has exhibited resilience amidst headwinds, showcasing its inherent stability. However, beneath the surface lies a tapestry of intricacies, each thread contributing to the fabric of its movement.
Central to the Euro's narrative is the European Central Bank's monetary policy stance. With inflationary pressures and growth forecasts in focus, the ECB's decisions hold sway over the Euro's valuation.
Geopolitical events further add layers of complexity. From Brexit negotiations to transatlantic trade tensions, external factors play a pivotal role in shaping market sentiment towards the Euro.
As we peer into the horizon, questions abound. Will the Euro continue its upward trajectory, buoyed by signs of economic recovery? Or shall we witness a recalibration, as uncertainties loom large on the horizon?
In this ever-evolving landscape, one thing remains certain: the Euro's journey is a reflection of the intricate interplay between economic fundamentals, policy decisions, and global dynamics. As financial analysts, it is our task to decipher these nuances and glean insights into the Euro's future path.

Unveiling Euro Trends: Insights from a Financial AnalystIn the dynamic world of finance, the Euro stands as a pivotal currency, influencing global markets and economic trajectories. As a seasoned financial analyst, I delve into the intricacies of Euro trends to provide valuable insights into its movement and potential implications.
At present, the Euro faces a myriad of challenges and opportunities. Geopolitical tensions, economic data releases, and monetary policy decisions all contribute to the ebb and flow of the Euro's value against other currencies.
One notable aspect of Euro analysis is its correlation with macroeconomic indicators. GDP growth, inflation rates, and unemployment figures in Eurozone countries play a significant role in shaping market sentiment towards the Euro.
Furthermore, political events within the European Union, such as elections, Brexit developments, and diplomatic tensions, can create volatility and uncertainty in Euro markets.
On a technical level, chart patterns and indicators provide valuable clues about future Euro movements. From simple support and resistance levels to complex trend analysis, understanding technical factors is essential for successful Euro trading strategies.
In conclusion, navigating the Euro landscape requires a nuanced understanding of both fundamental and technical aspects. As a financial analyst, I remain vigilant in tracking Euro trends and providing actionable insights to help investors navigate the ever-changing world of currency markets.

EUR downtrend !A solid trading plan is essential for success in the markets. Today, I'll share a powerful trend continuation strategy that leverages established market momentum. We'll focus on identifying trend direction and confirming optimal entries through price swing analysis. In a bullish scenario, we seek out uninterrupted higher highs and higher lows. The Fibonacci retracement tool, particularly the 61.8% level, serves as a key entry point. However, if the bullish trend weakens with lower highs and lower lows, we remain on the sidelines. It's prudent to wait for the formation of the next swing high/low pattern, indicating a potential continuation opportunity. In the event of a trend reversal, we adapt our strategy accordingly, seeking similar patterns in the opposite direction.

EUR/USD Steady Amid Dollar WeaknessEUR/USD maintains a higher level but remains below 1.0600 in Wednesday's Asian trading. Risk sentiment prevails, weighing on the US Dollar, especially amid positive data from China. Market focus is on Lagarde's speech and EU/US data. The EUR/USD rate has risen above the 20-day Simple Moving Average (SMA), which still slopes downward. The Momentum indicator is above 100, signaling positivity for the Euro, though the overall trend remains bearish.
On the 4-hour chart, the price is well-supported and above key SMAs, with technical indicators indicating an uptrend. The current resistance level is around 1.0600, and a breach could draw attention to 1.0630. Closing above this level daily would pave the way for further gains. Conversely, dropping below 1.0540 could weaken the Euro, pushing it towards 1.0500. EUR/USD rose on Tuesday, defying positive US data and higher Treasury yields. The pair reached a high of 1.0595 before retracing.
ZEW's survey shows positive signs in the region, with the Eurozone's economic sentiment index improving to 2.3 from -8.9 in October, beating market expectations. Germany's ZEW also recovered from -11.4 to -1.1, surpassing the market's consensus of -9. Next week, the European Central Bank (ECB) is set to hold its monetary policy meeting, expected to keep rates unchanged for the first time since June 2022.
On Tuesday, optimistic US economic data included Retail Sales (up 0.7% in September, compared to the expected 0.3%) and Industrial Production (0.3% vs. 0%). The US Dollar briefly gained from this data but quickly lost momentum. EUR/USD dropped to 1.0540 but then reversed its uptrend.
Both US and European bond yields surged, with the US 10-year yield rising to 4.86% from 2.60%, and Germany's equivalent yield increased from 3.40% to 2.88%. Bond markets continued to experience significant fluctuations. If Eurozone rates follow Treasury yields, the impact might be offset, as seen on Tuesday. However, robust US data could limit EUR/USD's upward potential. On Wednesday, Housing Permits, Building Permits, and the Beige Book by the Fed are due. Stay tuned for updates on this dynamic market scenario.

EUR/USD: A 30-Minute Zone AnalysisSupport Levels:
Support 1 @ 1.07062:
Our journey begins with support at 1.07062. This level serves as an immediate safety net for EUR/USD traders. It's where the price often finds buying interest, potentially signaling a reversal of any downward movement. Traders should keep a watchful eye on this level, as a breach below it could signal the presence of further bearish pressure.
Resistance Levels:
Resistance @ 1.07493:
On the flip side, we encounter a crucial resistance level at 1.07493. This level is a formidable barrier on the 30-minute EUR/USD chart. Resistance levels are where the price frequently faces selling pressure, potentially leading to a reversal of its upward momentum. Traders should remain vigilant here, as a decisive move above this level could signify a short-term bullish sentiment.
Resistance @ 1.07982:
Continuing our journey, we found another resistance level at 1.07982. Resistance levels like this one can act as significant roadblocks to price movement. Traders should closely monitor this level, as a successful breach could indicate a continuation of the current upward trend.
Resistance @ 1.08081:
Our final stop is resistance at 1.08081. This level is another noteworthy obstacle for EUR/USD. When multiple resistance levels are in close proximity, they can collectively strengthen the overall resistance zone. Traders should take heed, as a decisive move above this level could further bolster the bullish outlook.
Conclusion:
In the world of forex trading, comprehending support and resistance levels is akin to having a compass in uncharted waters. The EUR/USD market, with its unique dynamics, requires traders to carefully observe the identified support and resistance zones outlined in this analysis.
However, it's crucial to bear in mind that the forex market is anything but static. It's subject to constant fluctuations influenced by a multitude of factors, including economic data releases, geopolitical events, and market sentiment. Therefore, while support and resistance levels offer valuable insights, traders should augment their analysis with a toolbox of technical and fundamental indicators to make well-informed trading decisions.
Above all, risk management and prudent trading strategies remain paramount in the ever-evolving world of forex trading. Balancing opportunity with caution is the key to success in this dynamic market.

EURUSD: Buy
EURUSD is currently in a relatively obvious downward channel. Today, the lowest fell to around 1.094. This is also the starting point of the last rise. There was support. It rebounded to around 1.098 and then fell back. From the trend point of view, it has not yet stepped out of the downward channel, but here A pattern similar to a double bottom appears.
If it can get support around 1.096, it will try the resistance around 1.098 again. The probability of breaking through is relatively high. The upper target is around 1.10, so my trading signal is to go long.
Trading Signals:
buy: 1.096-1.095
tp: 1.099
sl: 1.094
sell: 1.101-1.103
tp:1..099
sl:1.103
Traders, I hope my signals can bring you profits, if you like my views, please support me and follow me!

drop eurusd this weakFX:EURUSD OANDA:EURUSD FOREXCOM:EURUSD
entry: 1.06941
sl: 1.07200
tp1: 1.06431
tp2: 1.06269

EURUSDHi traders, watch EURUSD with your own according strategy and look for a short position opportunity for a short term trade setup GOOD LUCK.

EURUSDHi traders, EURUSD watch price action with your own according strategy and look for a short term long position opportunity GOOD LUCK.


EURUSD- Short Term BullishnessHi Traders
Price action's playing out as analyzed last week, so here's a quick one.
Our predominant trend on this time-frame is bearish since we have a series of lower-lows and lower-highs
Price has also hit our daily support zone coloured green
Candlestick patterns at 11/02/19-12:30 showed a possible trend reversal.
Price seems to have completed a wave (i) - (iii) on 7/02/19, therefore we are anticipating a wave c of (iv) completion around 1.13519


Euro to keep staying under 1.19 in the wake of Trump SpeechEURUSD to stay under 1.19 level and even go much deeper as Trump will announce the strategy for US-Iran Nuclear Program Relations.

EURUSD Sell to 1.1609Our preference: short position below 1.1660 with targets at 1.1600 & 1.1570 in extension.
Alternative scenario: in excess of 1.1660, aim for a continuation of the increase with 1.1690 & 1.1720 in the line of fire.

Short EURUSD Short Term Based on Bearish Gartley FormationThis research is for informational purposes and should not be construed as personal advice. Trading any financial market involves risk. Trading on leverage involves risk of losses greater than deposits.
Please comment below and Like if you agree with my analysis.
