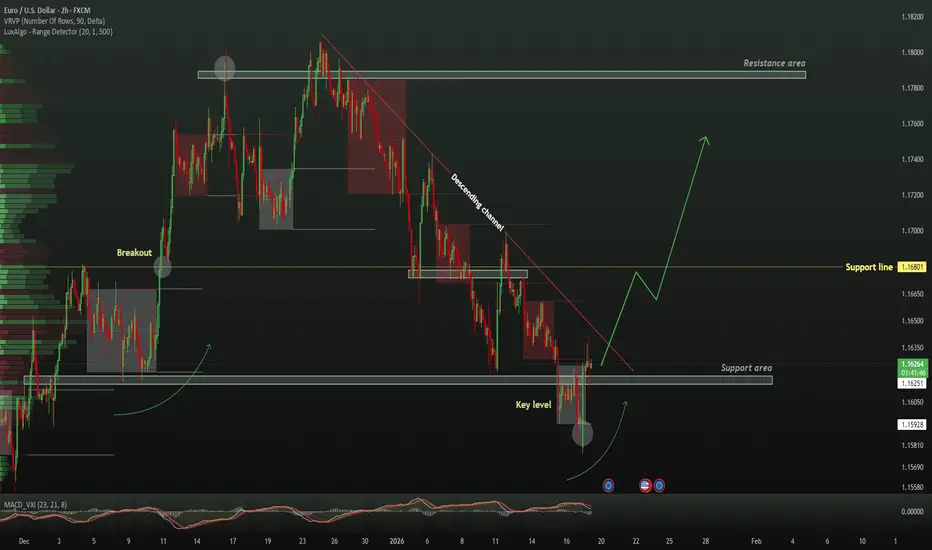
TheGrove | EURUSD Buy | Idea Trading AnalysisEURUSD is falling towards a support level which is a pullback support and could bounce from this level to our take profit.
We expect a decline in the channel after testing the current level which suggests that the price will continue to rise
Hello Traders, here is the full analysis.
I think we can soon see more fall from this range! GOOD LUCK! Great BUY opportunity EURUSD
I still did my best and this is the most likely count for me at the moment.
-------------------
Traders, if you liked this idea or if you have your own opinion about it, write in the comments. I will be glad 🤝
Eurusdanalysis
EUR/USD PROFESSIONAL CHART ANALYSISBreak & Retest Concept
Price broke above a key resistance / descending structure.
Now consolidating above that level → classic break-and-retest bullish continuation.
Current price is holding above 1.1720–1.1730, which is acting as new support.
2️⃣ Demand Zone (Buy Area)
Highlighted red zone (~1.1700–1.1725)
This zone aligns with:
Previous resistance turned support
Minor pullback structure
Bullish reaction expected as long as this zone holds.
3️⃣ Stop Loss Logic
Stop placed below ~1.1700
This level:
Invalidates the bullish structure
Breaks higher-low formation
Clean and logical risk placement 👍
🎯 Targets & Upside Potential
Primary Target
~1.1765 – 1.1780
Confluence of:
Prior highs
Liquidity zone
Psychological resistance

When Every Pullback Becomes an Opportunity for SellersEURUSD remains under heavy selling pressure after reacting from a strong supply zone, confirming a falling bearish structure. Each pullback into the buyer zone is being sold aggressively, indicating sellers are firmly in control. Price continues to print lower highs and lower lows within the descending channel, keeping the downside bias intact. As long as price stays below the supply area, the probability favors a continuation toward the demand zone, which is marked as the next bearish target. Patience is key—trend and structure clearly support further downside.

EURUSD ...Buy Now!EURUSD was in a recent downtrend for the last few weeks and struggled to stay bullish, but recently it has just broken a strong resistance trend line which it tested several times and failed to break through. EURUSD is very likely to hit the next major resistance zone which is market as the "TAKE PROFIT" LEVEL. There are many clear signs of new bullish movements. Buy EURUSD.

DeGRAM | EURUSD broke a descending structure📊 Technical Analysis
● EUR/USD has broken above the former descending trend and is now holding above the key support zone near 1.1653–1.1661, with a strong impulsive leg indicating buyer conviction.
● The upward move formed higher highs and is now targeting the resistance trendline around 1.1672–1.1695; repeated rejections at these levels would confirm short-term strength.
💡 Fundamental Analysis
● Euro strength is supported by softer USD momentum as markets price easing US rate expectations and improving Eurozone risk sentiment, boosting short-term EUR demand.
✨ Summary
● Bullish continuation above 1.1653 support. Near-term targets: 1.1672 → 1.1695. Momentum remains positive while above the support zone.
-------------------
Share your opinion in the comments and support the idea with a like. Thanks for your support!

EURUSD Local planThe target of this move higher is the test of a key area consisting of the 1W FVG, a sweep of the 1D FP, and price reaching the premium levels of the bearish 1D trading range. After that, I will wait for a sell-side reaction in the form of bearish variables forming on the 1D/4H timeframes. It’s a pity I couldn’t participate in this rally, even though there were conditions for opening a local long position.

EURUSD Weekly planThe EURUSD chart remains bearish. For the upcoming week, I plan to consider only short positions (unless the daily timeframe forms a bullish structure). I expect the bearish 1D OF to continue, and I will enter trades based on tests of daily zones with confirmation on the 4H timeframe.


EUR/USD: Resistance Broken, Phase One CompletePhase one is complete: the local resistance at 1.1721–1.1736 has been broken. In addition to the 'Call Ladder' opened on January 14, several vertical Call Spreads hit the market this past Friday, just ahead of the rally. While a correction was technically overdue from a charting perspective, the timing of these entries suggests these players might be 'in the know.'
So, to answer the big question: is the Euro headed higher? Rather than guessing, I’ll be analyzing the exchange reports (which are currently glitching) and will provide an update shortly. If last week’s portfolios are being closed out, the sentiment will shift back toward a weaker Euro.
However, I suspect these positions are still being held. We’ll see what the data says.
Relying solely on charts to draw conclusions is definitely not my style — and I hope it isn’t yours either.

Coinranger|EURUSD. Uncertainty at 1.17375🔹DXY has finally decided to fall and has already reached the potential pullback area of 98.3. A non-pullback down to 98.1 is still possible. We'll have to watch what happens next.
🔹Davos continues.
🔹During the DXY decline, the euro made a wave set and its first extension. The second is at 1.17375 - potential pullback point.
Levels:
Below:
Levels are tentatively calculated; it's difficult to say more precisely until the uptrend is complete.
1.16510 - first potential wave down
1.16267 - complete set down
Above:
1.17375 - second extension of the upward waves set, we'll likely take it.
1.17658 - 1.17788 - first potential wave in a new uptrend. This is a new, complete set for M15.
We're waiting for the DXY to behave from 98.1. For now, it's time to wait.
-------------------
Share your thoughts in the comments.

DeGRAM | EURUSD formed the descending wedge📊 Technical Analysis
● EUR/USD rebounded sharply from the medium-term support area near 1.1680, breaking the descending channel and reclaiming the rising support line, which signals a structural shift toward higher lows.
● Price is consolidating inside a descending wedge after the impulse move, suggesting a bullish continuation toward the upper resistance zone if the wedge resolves upward.
💡 Fundamental Analysis
● The euro is supported by easing USD momentum amid softer US data expectations and a more balanced Fed outlook, improving risk sentiment in favor of EUR.
✨ Summary
● Bullish medium-term bias. Key support: 1.1680–1.1700. Upside targets: 1.1738 → 1.1758, with continuation favored while above rising support.
-------------------
Share your opinion in the comments and support the idea with a like. Thanks for your support!

EURUSD – Daily Timeframe (SELL Setup)Market Structure Analysis
EURUSD is currently showing bearish price action on the Daily timeframe. After failing to sustain above the recent swing high, price has formed a lower high and is now moving downward, indicating ongoing selling pressure. Momentum remains weak, and buyers are struggling to regain control.
Key Resistance Zone
Resistance: 1.1700 – 1.1750
This zone previously acted as a strong rejection area. Price was rejected from this level and resumed bearish movement, confirming it as a valid resistance.
Key Support Zones
Support 1: 1.1600 – 1.1580
Support 2: 1.1500 – 1.1480
These levels are important demand zones where partial profit booking is expected.
Trade Plan (SELL Setup)
Entry (SELL): Around 1.1650 – 1.1670 (pullback preferred)
Stop Loss (SL): 1.1760
(Above the resistance and recent swing high for safety)
Take Profit 1 (TP1): 1.1580
Take Profit 2 (TP2): 1.1480
Confirmation Notes
Daily candle structure favors sellers
RSI is below strong bullish territory, indicating weak buying momentum
Trend bias remains bearish below 1.1700
Bias: Bearish
Risk Management: Use proper lot size and manage risk accordingly
This setup is suitable for swing traders and aligns well with disciplined, professional trading strategies.

Coinranger | EURUSD. Continued decline to 1.15539🔹The DXY has faded a bit in its rise, but there's no clear indication of a significant reversal on the elder timeframes yet. So, it's very likely that after the pullback is realized, we'll continue to rise to the 99.23 area and higher, to 99.44.
🔹No news today, except for the International Economic Forum in Davos. There's no significant news for the euro this week, except for Friday.
🔹So, we're continuing to decline.
Levels
Below:
1.15700 - second downward extension from the old set
1.15539 - first downward extension from the new set
1.15310 - second downward extension from the new set
Above:
Potential pullback level, but not guaranteed to materialize.
1.16570 - first potential upside wave.
While the DXY is rising, the euro is falling.
-------------------
Share your thoughts in the comments.

DeGRAM | EURUSD is pulling back from the resistance area📊 Technical Analysis
● EUR/USD failed to sustain above the short-term trendline and formed a series of lower highs near 1.1627–1.1630, showing loss of bullish momentum after the prior reversal.
● Price repeatedly rejected from the descending resistance and is now breaking below minor support at 1.1616, increasing the probability of continuation toward the next support around 1.1605 and lower.
💡 Fundamental Analysis
● USD strength is supported by resilient U.S. data and cautious market positioning ahead of macro releases, reducing EUR demand and favoring near-term downside.
✨ Summary
● Short bias triggered below 1.1627–1.1630.
● Downside targets: 1.1616 → 1.1605.
● Resistance remains at the descending trendline.
-------------------
Share your opinion in the comments and support the idea with a like. Thanks for your support!

DeGRAM | EURUSD is correcting📊 Technical Analysis
● EUR/USD continues to trade within a long-term descending structure, with price repeatedly rejected from the upper resistance zone near 1.18–1.19 and the descending trendline, confirming sustained seller dominance. Recent pullbacks from this area formed lower highs, reinforcing bearish continuation risk.
● Price is now rolling over toward the mid-range support near 1.165–1.160. A break below this zone would open the way toward the broader ascending support around 1.15, aligning with the long-term channel structure.
💡 Fundamental Analysis
● The US dollar remains supported by relatively stronger US growth and a cautious Fed stance, while the euro faces pressure from weaker Eurozone macro momentum and rate divergence expectations.
✨ Summary
● Long-term bearish bias intact. Key resistance: 1.18–1.19. Supports: 1.165 then 1.15. Downside favored while below trendline.
-------------------
Share your opinion in the comments and support the idea with a like. Thanks for your support!

EURUSD Weekly planThe nearest target of the current decline is the 1D FP. I will consider a short position in the case of a retest of the bearish 1D FVG with confirmation on the 4H timeframe. A deeper decline is not being considered at this stage, as price has reached the discount levels of the weekly trading range. Further downside would require additional conditions and confirmations.

EURUSDPrice is confirming bearish intent. After the retest of the 1D FVG, a sell-side reaction was received in the form of 4H displacement — FVG and OB. The target is the 1D FP.

EUR/USD buys up to sells ideaThis week’s outlook for EU is slightly different from the other pairs as price is approaching a very clean demand zone. Although the short-term momentum may still appear bearish, I’ll be watching closely for clear confirmation to potentially take a counter-trend buy back to the upside.
The main reason for this is that the nearest supply zone is quite far from current price, so I’ll wait to see how price opens on Sunday night and reacts around this area.
Confluences for EU Buys:
• Price slowing down before tapping demand would be a strong sign
• Overall structure has been bullish over the past month
• DXY approaching supply, which could support upside on EU
• A clean, unmitigated demand zone below price
• Asia high liquidity resting above that price may look to take
P.S. If price breaks cleanly through this demand, I’ll reassess and look for a closer, valid supply zone to potentially trade from instead.

EUR/USD: inside a triangleHi!
EUR/USD is trading within a well-defined descending triangle, a structure that typically reflects corrective price action rather than a strong trending environment. Price remains compressed between declining resistance and rising support, signaling a market in balance and approaching a decision point.
Within this broader structure, the market has formed a Head and Shoulders pattern (left shoulder, head, right shoulder), which has already played out to the downside. However, the bearish follow-through has been limited, suggesting weak downside momentum rather than aggressive distribution.
Currently, price is reacting around a key demand / reaction zone, where buyers have previously defended the market. From this area, two scenarios are technically valid:
A minor bullish correction toward the upper boundary of the wedge, driven by short-term mean reversion.
A continuation lower toward wedge support if price fails to build acceptance above the current zone.
As long as EUR/USD remains inside the triangle, the market should be treated as range-bound with directional uncertainty. A confirmed breakout from either boundary will be required to establish the next sustained directional move.
Disclaimer: As part of ThinkMarkets’ Influencer Program, I am sponsored to share and publish their charts in my analysis.

Coinranger | EURUSD. Continued decline to 1.16254🔹The DXY continues to rise and will likely continue without significant pullbacks for some time. Prospects: at least 99.1. Then the movement will need to be recalculated.
🔹Today at 16:30 (UTC+3) will issue data on PPI for December and October. Retail sales data will also be released at the same time.
🔹And the euro continues to decline.
Levels
Below:
1.16254 - a full set of downward waves.
1.15953 - the first downward extension.
1.15723 - the second downward extension.
Above:
Potential pullback levels until we break the January 9th peak.
1.16732 - first potential upward wave.
1.16846 - a full set of upward waves.
While DXY rises, the euro will fall.

EURUSD Is Compressing Inside a Falling Wedge FX:EURUSD on the H1 timeframe is currently trading inside a well-defined falling wedge structure, following a sharp impulsive rebound from the recent lows. After the strong bullish displacement, price failed to continue immediately and has transitioned into a corrective phase, printing lower highs and lower lows within the wedge a classic sign of trend exhaustion rather than trend continuation. Importantly, bearish momentum has clearly weakened, with each push lower showing reduced follow-through, suggesting that sellers are losing control and liquidity is being absorbed near the wedge base. This structure often acts as a compression pattern, where price coils before releasing energy in the opposite direction. As long as price continues to hold above the wedge support and does not break decisively below the recent swing low, the probability favors a bullish breakout scenario, with upside targets aligned first at 1.1653, then 1.1676, and potentially extending toward 1.1698 if momentum expands. Short term dips toward the lower boundary of the wedge should be viewed as liquidity sweeps within a corrective structure, not bearish continuation. Only a clean breakdown and acceptance below the wedge base would invalidate this bullish reversal thesis and shift the bias back toward continuation to the downside.

EURUSD Is Compressing Inside a Bearish StructureOn the H1 timeframe, EURUSD continues to trade within a clearly defined bearish market structure, characterized by a sequence of lower highs and lower lows. After each impulsive sell-off, price has produced sharp corrective rebounds, but these bullish reactions have consistently failed to break structure and instead form lower highs beneath descending trendlines. This behavior confirms that the dominant flow remains bearish, with buyers only able to generate short-lived corrective moves rather than genuine reversals. The most recent rebound followed the same pattern: a strong reaction from the lows, followed by gradual compression and loss of momentum as price retests the descending resistance trendline.
From a price action and liquidity perspective, the market is now coiling inside a compression phase, where volatility is contracting and liquidity is building on both sides. Sell-side liquidity remains clearly visible below the 1.1615 area, which aligns with a prior structural low and acts as a key downside magnet. As long as price remains capped beneath the descending trendline, the higher-probability scenario favors a continuation to the downside, potentially through a minor consolidation or fake upside attempt before a decisive breakdown. Any brief bullish push into the trendline should be viewed as liquidity inducement, designed to trap late buyers before sellers reassert control.
That said, a bullish alternative cannot be fully dismissed. If price manages to break and hold above the descending trendline with strong momentum and follow-through, it would signal a short-term structural shift and open the door for a deeper corrective rally. Until such confirmation occurs, EURUSD remains structurally bearish, and patience is required. The market is not random here it is compressing, building liquidity, and preparing for its next expansion, with the downside still holding the technical advantage.

#EUR/USD Buy Trade Scenario.Here’s an up-to-date EUR/USD Buy trade outlook (technical + fundamental) to help you assess whether positioning for a Upside makes sense right now.
Thank You......
