EURUSD 4H – SMC Plays at 1.1661 Supply & 1.1507 Demand💶 EURUSD – Weekly Smart Money Outlook | by Ryan_TitanTrader
📈 Market Context
This week EURUSD continues to trade inside a broad 4H range while markets react to shifting expectations around upcoming U.S. data and Fed communication.
The dollar remains sensitive to any surprise in growth and inflation numbers, so institutional flows are likely to use this range to engineer liquidity on both sides before choosing a clear direction.
Until a decisive macro catalyst appears, price is likely to respect key premium and discount zones marked on the chart.
🔎 Technical Analysis (4H / SMC View)
• Price has broken out of the previous bearish channel, printing a clear ChoCH and later BOS, confirming that old downtrend order flow has weakened.
• Current structure shows a sideways consolidation between the mid-range around 1.1555 and the upper liquidity line near 1.1607.
• Resting liquidity sits above the recent swing highs; the 1.1661 area forms a clean premium supply pocket ideal for stop-hunting shorts before distribution.
• On the downside, the 1.1507 region aligns with prior demand and unmitigated orders, creating a discount demand zone just below visible liquidity shelves.
• Smart Money is likely to sweep one extreme (1.1661 or 1.1507) before driving the next impulsive leg for the week.
🟢 Buy Zone: 1.15074–1.15072
• Entry Zone: 1.15074–1.15072
• SL: 1.15064
• TP Targets:
o TP1: 1.15550 (mid-range liquidity)
o TP2: 1.16070 (upper range liquidity line)
o TP3: 1.16580–1.16600 (pre-supply reaction)
Rationale (Buy):
• Clear discount demand on the 4H chart after previous BOS.
• Zone sits just below visible equal lows, ideal for a stop-hunt before reversal.
• Good location to join potential continuation of the new bullish leg if buyers defend structure.
🔴 Sell Zone: 1.16614–1.16616
• Entry Zone: 1.16614–1.16616
• SL: 1.16624
• TP Targets:
o TP1: 1.16070 (first liquidity pocket)
o TP2: 1.15550 (range midpoint)
o TP3: 1.15100–1.15070 (discount demand zone)
Rationale (Sell):
• Premium supply above recent highs, where many stops and breakout orders are likely clustered.
• Ideal area for a classic liquidity sweep → rejection → distribution on the 4H.
• Aligns with the previous bearish trendline and “previous bearish” zone marked on the chart, adding confluence.
⚠️ Risk Management Notes
• Wait for lower-timeframe confirmation (M15 ChoCH/BOS, rejection wicks, engulfing candles) inside each zone before entering.
• Avoid chasing price in the middle of the range; focus on extremes near 1.1661 or 1.1507 for the best RR.
• Manage risk per trade; risking 0.5–1% per position is more sustainable over the long run.
• Consider partial profits at each TP and move SL to breakeven once TP1 is hit to lock in protected equity.
✅ Summary
EURUSD is trapped in a 4H range with clear footprints of Smart Money at 1.1661 (premium supply) and 1.1507 (discount demand).
For this week, the main idea is to patiently wait for liquidity sweeps into either extreme, then use intraday confirmations to join the move back toward the mid-range. Trade the reaction, not the prediction, and let the zones and structure guide your decisions.
🔔 Follow @Ryan_TitanTrader for more SMC signals⚡
Eurusdanalysis

USDJPY Short-Term Range Monitoring and Breakout FocusThe chart shows USDJPY moving inside a short-term horizontal range between 156.470 (upper boundary) and 156.082 (lower boundary).
Price is creating repeated swing highs and swing lows within this zone, indicating temporary consolidation.
The idea is to observe the structure and wait for price to move above the upper boundary to confirm a shift in momentum.
If price holds above this zone, it may indicate continuation toward higher levels.
This layout is for market structure observation only and does not contain trading instructions. It highlights key levels and potential directional behavior based on the current chart pattern.
EURUSD SELLEUR/USD broke below key support at 1.1550 and the 50/200-day moving averages. This technical breakdown, with bearish candles and rising volume, signals strong downside momentum targeting the next major support near 1.14000

EURUSD BUYI expect EURUSD Short term buy. This can be seen after a price hit Low fair value gap and bullish order block so as reverse to a bearish order block for continuing sell.

EURUSD: Bullish Push to 1.167?FX:EURUSD is eyeing a bullish breakout on the 4-hour chart , with price rebounding from a key support zone near recent lows, converging with cumulative sell liquidation and a potential entry area that could spark upside momentum if buyers hold against short-term pullbacks. This setup hints at a reversal opportunity after the recent downtrend, targeting higher resistance levels with strong risk-reward.
Entry between 1.1490–1.1500 for a long position (aggressive entry right here with proper risk management is recommended). Targets at 1.1590 (first), 1.1670 (second). Set stop loss on a close below 1.14685 , delivering a clean risk-reward ratio of ~1:4+ (full run). Watch for bullish confirmation on lower timeframe breakout or strong green candle with volume surge.⚡
Fundamentally , peace talks between Russia and Ukraine are gaining traction in November 2025, with US officials (including Army Secretary Dan Driscoll) engaging in secret negotiations in Abu Dhabi under a proposed Trump-backed plan, where Ukraine has agreed in principle but minor details remain, though Russia shows reluctance and may reject revisions. This could positively impact the euro's upward trend by reducing geopolitical risks, stabilizing European energy markets, and boosting investor confidence in the region's economy.
📝 Trade Setup
🎯 Entry (Long):
1.1490 – 1.1500
(Aggressive entry at current levels is acceptable with strict risk management.)
🎯 Targets:
• TP1: 1.1590
• TP2: 1.1670
❌ Stop Loss:
• Close below 1.14685
⚖️ Risk-to-Reward:
• ~1:4+ full target
👇 Share your thoughts below! 👇

EURUSD Testing Resistance With Possible Reversal ScenarioPrice has reached a clear resistance level after completing an upward correction from the lower boundary of the range. The recent structure shows a sharp rise followed by a pullback, indicating that price may be reacting to this upper zone.
The projection suggests that price could complete its retest near resistance before starting a downward move. The idea focuses on the following elements visible on the chart:
A strong push upward into a well-defined resistance area
A corrective wave suggesting loss of momentum near the top
A potential reversal setup if price fails to break above the resistance zone
A possible move back toward the lower boundary of the range

EUR SHORTS 1) GBP took these August lows and dosent reverse
2) creating SMT on high with GBP shows strenght switch , so that now euro can short to these lows
3) Targeting August lows.

EURUSD - time to SELL NOWEURUSD has been stuck in-between 2 powerful support and resistance zones for a few weeks and finally broke the major support level on the downside. The next target will be the take profit zone shown on the charts (This is the next closest major support zone where EURUSD is very likely to head to)... the market is opening soon, and this trade should be on your radar! sell EURUSD now

DeGRAM | EURUSD will break a resistance level📊 Technical Analysis
● EUR/USD formed a clear inverse head-and-shoulders pattern at the rising support line, signalling a bullish reversal after rejecting the 1.1500 zone.
● Price has broken above the neckline and is now targeting the 1.1590 and 1.1620 resistance levels, with momentum supported by higher lows.
💡 Fundamental Analysis
● Softer U.S. data and renewed expectations of gradual ECB stabilization are boosting euro demand as the dollar’s short-term strength fades.
✨ Summary
● Bullish bias above 1.1549. Targets: 1.1590 → 1.1620. Key support: 1.1500.
-------------------
Share your opinion in the comments and support the idea with a like. Thanks for your support!

EUR/USD – H1 Wedge Breakout |Bullish Momentum Targeting 1.1600📌 Setup Overview FX:EURUSD
EUR/USD has broken out of a falling wedge on H1, signalling a potential bullish trend reversal.
Price has reclaimed the Ichimoku cloud — now acting as support, showing fresh buyer strength.
• Pattern: Wedge Breakout Pattern
• Timeframe: H1 Chart
• Bias: Bullish
• Reason for setup: Breakout & Retested
🎯 Trading Plan
• Entry idea: Retest of breakout zone for confirmation before continuation
• TP1: 1.15886 (1st Resistance)
• TP2: 1.16148 (2nd Resistance / liquidity sweep zone)
🧠 Fundamental Drivers
1️⃣ 80% probability the Federal Reserve cuts rates in December → weaker USD supports bullish EUR/USD
2️⃣ Upcoming high-impact data to watch:
• EUR – German GDP
• USD – Core PPI
• USD – Retail Sales
Fundamentals currently favour bullish EUR side, with USD losing momentum.
#EURUSD #forex #forexanalysis #priceaction #chartanalysis #technicalanalysis #fundamentalanalysis #tradingview #supportandresistance #smartmoney #breakout #wedgebreakout #ichimokucloud #marketstructure
📌 What to expect
Break/retest continuation structure suggests 1.1588 is the first magnet.
If momentum remains strong, price could extend to 1.1614 liquidity zone.
🔖 SAVE this post so you don’t miss the update when levels hit.
👍 LIKE if you want more Wedge & Breakout setups.
⚠ Disclaimer:
Trade for education/study only. Manage risk according to your own system.

EUR/USD Intraday Structure UpdateEUR/USD is holding above a nearby support level after a recent pullback. The chart shows a constructive structure, with price forming higher lows and maintaining short-term momentum. If the current support area remains stable, the pair may continue following the outlined intraday path toward the upper range marked on the chart.

EURUSD will be bearish... SELL NOWEURUSD has been stuck in-between 2 powerful support and resistance zones for a few weeks and finally broke the major support level on the downside. The next target will be the take profit zone shown on the charts (This is the next closest major support zone where EURUSD is very likely to head to)... the market is opening soon, and this trade should be on your radar! sell now

EURUSD unchangedEURUSD continues to hold around the levels set after the news.
Watch closely for a breakout before taking any trades.
There are no major USD news events this week.
Thursday is Thanksgiving, and U.S. markets will be closed, which means lower trading volumes.
Don’t rush - wait for a clear reaction!

EUR/USD) Bearish trend analysis Read The captionSMC Trading point update
Technical analysis of summary for the EUR/USD H1 chart you shared:
---
Overall Bias: Bearish
Market structure and Smart Money Concepts indicate downside continuation after mitigation of a major H4 Fair Value Gap (FVG).
---
Key Technical Points
Price recently rejected a strong H4 supply + FVG zone
Located around 1.1530 – 1.1565
Price trading below both EMA 50 (blue) and EMA 200 (black)
→ Full bearish momentum alignment
Structure
Lower highs & lower lows forming
Bearish correction pattern drawn indicating continuation wave
Rejection from EMAs acting as dynamic resistance
Target Point 1.14540 – 1.14600
Major demand area & liquidity pool
---
Trade Idea Concept
Entry idea:
Wait for a minor pullback for better entries (in the bearish corrective pattern), preferably near EMA 50 or last supply.
Target:
1.14540 zone
Invalidation / SL level:
Break and close above 1.1565 (top of FVG zone) invalidates bearish setup.
---
Smart Money Concept Interpretation
Supply filled & mitigation done
BOS (Break of Structure) confirmed bearish direction
EMAs provide extra confluence
Targeting liquidity sweep under equal lows area
Mr SMC Trading point
---
Summary
EUR/USD shows high probability for continued downside, respecting premium-to-discount move. As long as price remains below 1.1530 – 1.1565, sellers remain in full control.
---
Please support boost 🚀 this analysis

EURUSD remains in a strong bearish structure on the 4H timeframePrice is clearly trading below all three Alligator lines, confirming a downside trend with no signs of exhaustion yet. RSI is sitting below 40, showing steady bearish momentum while still leaving room for continuation before reaching oversold conditions.
🔹 Key Technical Levels
Sell Zone (Pullback): 1.1550 – 1.1580
High-probability entry area where Alligator lines converge. Look for bearish rejection candles.
A clean 4H breakdown below this level confirms continuation.
🎯 Targets
TP1: 1.1470
TP2: 1.1384 (major swing-low support)
🛑 Stop-Loss
SL: 1.1620 to 1.1640 (above R2 / structure high)
📉 Why Bearish?
The alligator indicator shows a fully opened bearish formation (lips < teeth < jaws).
RSI below 40 confirms momentum on the downside.
Market structure continues to print lower highs and lower lows.
No bullish reversal signals present on 4H.
❌ Invalidation
A 4H close above 1.1650 cancels the bearish setup.

EURUSD overviewLooking at the chart, we can see how EURUSD is moving in the descending channel starting from the resistances and supports, in my opinion, a clear entry may be considered around 1,14-1,13 level, there is a 200 ema level on 1-daily timeframe, also I don’t believe that the price of EURUSD will fall further because if we take a look at DXY chart, the price already reached 100 points which is quite a strong resistance and DXY may start pulling back from this level and continue its downtrend which means this is a green light for major currencies against the dollar.

DeGRAM | EURUSD is preparing to fall below $1.15📊 Technical Analysis
● EUR/USD continues to reject the long-term descending resistance line, with the latest swing high failing near 1.1650 and confirming bearish structure.
● Price is forming lower highs and is now retesting 1.1530 from below. A breakdown toward 1.1474 and 1.1407 is likely if the pair stays under resistance.
💡 Fundamental Analysis
● USD strengthens as markets price in fewer Fed cuts after resilient U.S. data, pressuring the euro.
✨ Summary
Resistance: 1.1530–1.1576. Downside targets: 1.1474 → 1.1407. Short-term bearish bias below trendline.
-------------------
Share your opinion in the comments and support the idea with a like. Thanks for your support!

EUR/USD: Liquidity Secured, Targeting CRTH HighTimeframe: 4H | Model: CRT Model #1 Bullish Setup
The Euro/Dollar pair is showing a textbook Candle Range Theory (CRT) Model #1 setup after a strong drop, positioning the market for an immediate reversal. The price action perfectly aligns with the principles of Manipulation (Candle 2) giving way to Distribution (Candle 3).
Here’s the step-by-step breakdown of the trade plan:
Liquidity Sweep: Price aggressively swept the stops below the previous low, tagging the CRTL + TS (Candle Range Theory Low + Turtle Soup) line at 1.15259. This confirms the deep liquidity hunt is complete.
FVG Demand Zone: The reversal bounce occurred immediately after tagging the low, creating a small but powerful Fair Value Gap (FVG) just above the Turtle Soup point. This FVG acts as the immediate demand zone for smart money accumulation.
The Trigger (Model #1): The current price action (the recent up-close candle) is the Model #1 confirmation candle. It signals that buyers have seized control and are now ready to push the price into the Distribution (Candle 3) phase.
Targets:
Primary Objective (CRTH): The main target is the CRTH (Candle Range Theory High) at 1.15738. This move is aimed at filling the price void left by the initial sharp drop and running the liquidity pools above the last swing high.
Continuation: A successful close above CRTH could validate the move as a major structural shift, potentially leading to further upside.
Discipline: This is an aggressive entry based on the Model #1 candle closure. Ensure your stop loss is placed strategically below the Turtle Soup point at 1.15259. We are trading with the reversal, aiming for the CRTH high.
Trade the Bounce. Trust the Model #1.
Greetings,
MrYounity

EUR/USD: Bearish Drop to 1.1483?As the previous analysis worked exactly as predicted, FX:EURUSD is flashing bearish signals on the 4-hour chart , with price forming successive lower highs under a downward trendline, indicating sustained selling pressure and potential for a downside continuation if resistance holds firm. The setup aligns near the resistance zone for a high-probability short, especially as the pair tests key levels amid recent volatility.
Entry zone between 1.1638-1.1656 for a short position. Target at 1.1483 near the support zone, delivering a risk-reward ratio close to 1:4 . Set a stop loss on a close above 1.16775 to protect against upside breaks. 🌟 Look for confirmation on a break below the entry with increasing volume, amid ongoing USD strength versus the EUR.
Fundamentally , the pair has fallen to around 1.1594 as markets await key US data today, including manufacturing and construction releases, which could reinforce USD if positive—potentially pressuring EUR further amid low volatility and a lingering upward bias from last week's channel breakout. 💡
📝 Trade Setup
🎯 Entry Zone: 1.1638 – 1.1656 (short position)
🎯 Target:
1.1483 (major support zone)
❌ Stop Loss: Close above 1.16775
⚖️ Risk-to-Reward: Approximately 1:4
What's your outlook on this setup? Drop your thoughts below! 👇

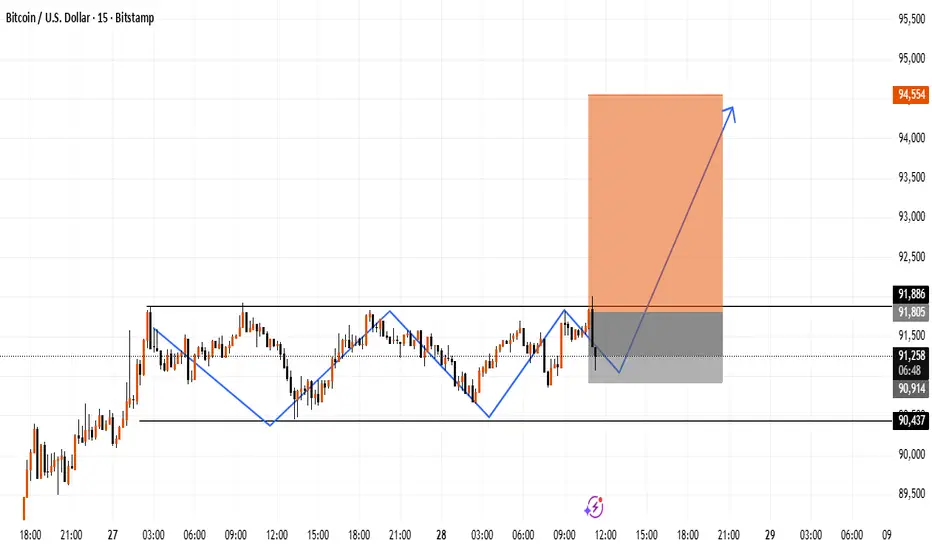
A+++ Setup That Completed My Prop Firm Challenge
(Structure · Precision · Patience · Faith)
This trade wasn’t luck.
It wasn’t guessing.
It wasn’t hope.
It was pure structure, multi-timeframe alignment, perfect execution, and flawless risk management—and it ended up completing my Prop Firm Challenge.
Here’s the full story, exactly how the setup unfolded from the first signal all the way to final execution.
⸻
📌 Higher-Timeframe Context: The Bearish Top Was Already Set
Everything began with the 4H BOS around 93,900, which officially broke structure and created the macro bearish environment.
Then price formed a clear 4H Lower Low at 89,000, confirming the downtrend.
But the real clue came next:
👉 Price aggressively pulled back to 92,900–93,000, retesting the old 4H BOS zone
👉 Then failed to reclaim it
👉 Entered a tight range directly underneath the level
👉 Volume dropped
👉 Candle bodies got smaller
👉 Wick pressure increased
That’s redistribution—not accumulation.
I knew sellers were loading.
⸻
📌 LTF Alignment Begins: The Dominoes Fall One by One
Once I had the HTF context, I waited for LTF confirmation.
1️⃣ 1M BOS below 92,900
Signaled the first crack in the bullish micro-flow.
2️⃣ 5M Displacement + BOS
Not noise — real intent.
Selling pressure was confirmed.
3️⃣ 15M Market Structure Shift (MSS)
This was the decisive moment.
The bullish internal structure broke.
Momentum flipped.
The range under 92,900 was officially a distribution block.
4️⃣ 30M & 1H candle closes below 92,880
This erased any bullish reclaim attempt.
HTF + MTF now perfectly aligned.
At that point, the short wasn’t a prediction — it was a requirement.
⸻
📌 The Entry: Precision at the Retest
I placed my short on the retest of 92,900, right into the ceiling of the redistribution.
Entry: 93,055
Stop Loss: 93,943
Target: 90,955 (MTF sell-side liquidity)
⸻
📌 Risk Management That Passed the Challenge
I didn’t gamble.
I executed professionally:
✔️ 33.33% partial at 92,000 → +$96.75
✔️ SL moved to 93,210 → protected profits
✔️ 33.33% partial planned at 91,050 (SSL target)
✔️ 33.33% runner for extended continuation
When FTMO notified that I had completed the challenge, I closed the entire position at 91,950.
Clean. Controlled. Disciplined.
⸻
📌 Outcome: Challenge Completed by Structure Alone
No indicators.
No fundamentals.
No emotions.
No guesswork.
Just:
• 4H BOS
• LTF MSS
• Displacement
• Retest
• Liquidity targets
• Risk management
• And unshakable patience
My trade went from A+ to A+++ the moment all timeframes aligned perfectly.
This is the kind of setup you wait for — not the kind you chase.
⸻
📌 Final Words
I’m extremely grateful —
to God first,
to the journey second,
and to the discipline that carried me through.
If this breakdown gave you clarity and shows you how powerful clean structure can be…
👇
Leave a like, drop a comment, share it, and hit Follow.
Your support motivates me to keep bringing high-level breakdowns to the community.
more legendary setups to come.
COINBASE:BTCUSD OANDA:XAUUSD OANDA:EURUSD

DeGRAM | EURUSD held the support line📊 Technical Analysis
● EUR/USD is rebounding from the 1.1580–1.1590 support area and breaking out of the descending channel, signaling early bullish momentum.
● Price aims toward 1.1599 and then 1.1613 as long as it stays above the reclaimed support and rising structure.
💡 Fundamental Analysis
● Euro is supported by improving EU macro sentiment, while the USD weakens after softer U.S. data and dovish rate expectations.
✨ Summary
Support: 1.1580–1.1590. Targets: 1.1599 → 1.1613. Medium-term bullish bias while above support.
-------------------
Share your opinion in the comments and support the idea with a like. Thanks for your support!

EURGBP FRGNT Daily Forecast -Q4 | W47| D19 | Y25 |📅 Q4 | W47| D19 | Y25 |
📊 EURGBP FRGNT Daily Forecast
🔍 Analysis Approach:
I’m applying Smart Money Concepts, focusing on:
Identifying Points of Interest on the Higher Time Frames (HTFs) 🕰️
Using those POIs to define a clear trading range 📐
Refining those zones on Lower Time Frames (LTFs) 🔎
Waiting for a Break of Structure (BoS) for confirmation ✅
This method allows me to stay precise, disciplined, and aligned with the market narrative, rather than chasing price.
💡 My Motto:
"Capital management, discipline, and consistency in your trading edge."
A positive risk-to-reward ratio, paired with a high win rate, is the backbone of any solid trading plan 📈🔐
⚠️ Losses?
They’re part of the mathematical game of trading 🎲
They don’t define you — they’re necessary, they happen, and we move forward 📊➡️
🙏 I appreciate you taking the time to review my Daily Forecast.
Stay sharp, stay consistent, and protect your capital
— FRNGT 🚀
FX:EURGBP

DeGRAM | EURUSD is trying to consolidate above the support area📊 Technical Analysis
● EUR/USD is rebounding from the 1.1580–1.1600 support area while respecting the rising trendline, keeping short-term bullish structure intact.
● The break of the descending channel strengthens the upside scenario toward 1.1613, with extension potential to 1.1631 if buyers maintain control.
💡 Fundamental Analysis
● Positive Eurozone data supports mild euro strength, while short-term USD momentum shows signs of cooling.
✨ Summary
Key support: 1.1580–1.1600. Targets: 1.1613 → 1.1631. Bias remains bullish above trendline.
-------------------
Share your opinion in the comments and support the idea with a like. Thanks for your support!
