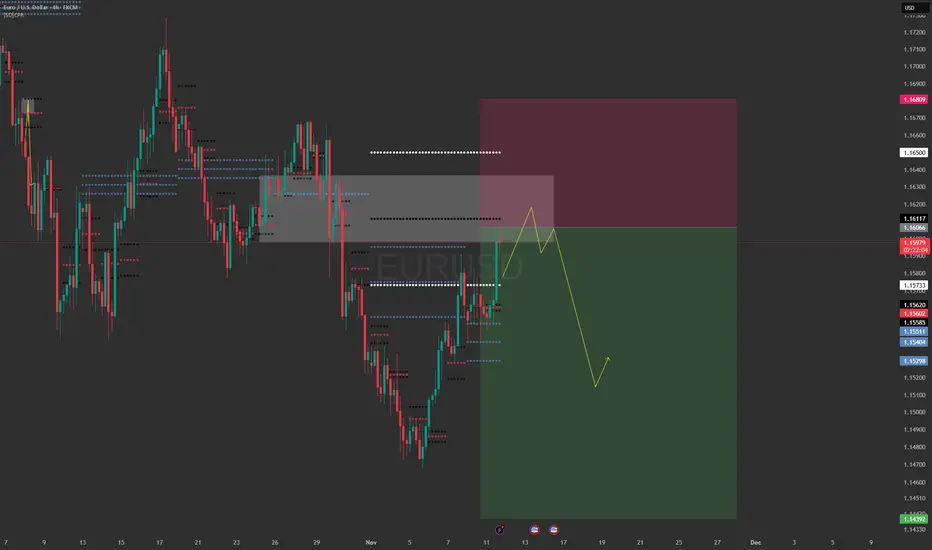
EUR/USD: Oscillates LowerThe euro is oscillating downward, facing pressure at the upper boundary of the daily Bollinger Bands.
Resistance is concentrated in the 1.1665-1.17 range – short positions can be initiated within this interval with a bearish outlook for further downside.
For intraday trading, gradually go short in the 1.1665-1.17 zone and target the support levels below: 1.16, 1.1550, and 1.15.
Eurusdanalysis

Eurusd Next Move Eurusdt Under Selling Pressure We Have Best Selling Opportunity Around 1.16439
Sell With Candle Confirmation Take Profit Around 1.14059 Manage Your Risk Properly
For More Updates Stay Tuned

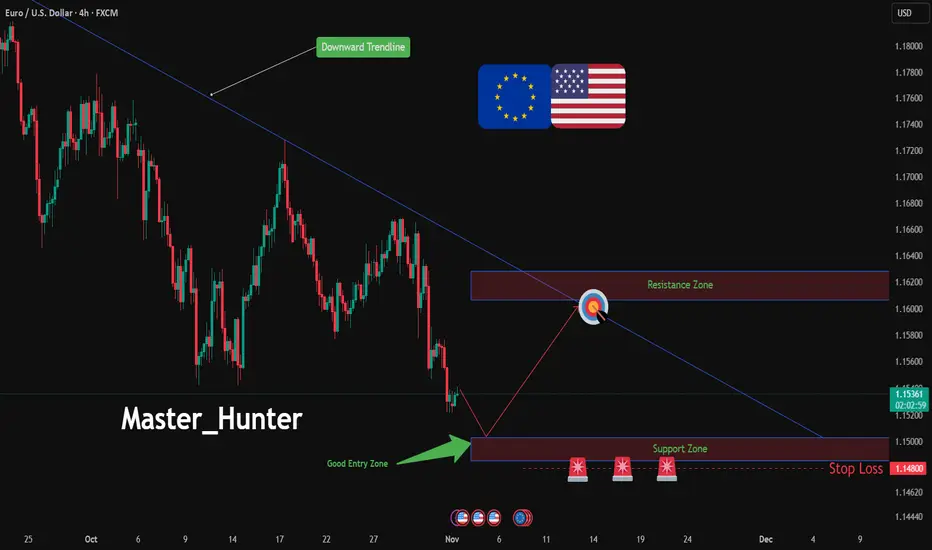
SELL EURUSD - Amazing trade opportunityEURUSD has broken a powerful channel that it was stuck in-between for a few weeks and broke the major support zone. The price recently retested the support trendline (which is now acting as resistance) .. From here it will continue to remain bearish and likely hit the next support level which is marked as "take profit". This is a very good zone to sell at! SELL EURUSD.

EURUSD bullish for 1.1650#eurusd demand zone for another leg higher is 1.1558-1542. Split your risk into two positions by diving risk equally on them. 1st buy limit order at 1.1558 (0.5% risk), 2nd buy limit order at 1.1536 (0.5% risk). stop loss at 1.1525. target: 1.1650

EUR/USD CRT Setup: Model #1 Confirmation🐂 EUR/USD CRT Setup: Model #1 Confirmation
The price action suggests a Bullish Model #1 trade is in play, positioned at a significant Key Level. The lower line, marked CRTL - TS at 1.16087, signifies the low of the range and the location of a Turtle Soup. Turtle Soup is a crucial market maker trap where price stabs below an old low to run stops and gather liquidity, fueling the subsequent move in the opposite direction. The candlestick structure shows price has completed this manipulation and is reversing, aiming for the CRTH (Candle Range Theory High) at 1.16537, or potentially the 50% target of the move first, which is the CRT's "first mission". For a beginner, the rule is to trade ONLY Candle 3 and wait for the confirmation after the manipulation of Candle 2 (the Turtle Soup) is complete.
💱 SMT and DXY Confluence Analysis
The Smart Money Technique (SMT) is a non-negotiable step to confirm this setup by checking the correlated DXY (Dollar Index) chart. The EUR/USD and DXY typically have an inverse correlation, meaning if EUR/USD goes up, DXY should go down.
The current EUR/USD setup strongly suggests a bullish move from a liquidity-generating low (Turtle Soup). To validate this with SMT, we look for a Bullish SMT Signal:
EUR/USD: Has made a new low (the Turtle Soup at 1.16087).
DXY (Dollar Index): The DXY's price was recently around 99.30 as of November 14, 2025, which is notably lower than previous highs above 100.00 earlier in the month.
The Divergence Check: For a bullish signal, the DXY should FAIL to make a new high at the same time EUR/USD makes its new low. If DXY failed to retest a high while EUR/USD was making the 1.16087 low, it would confirm that smart money is exiting dollar-based positions and preparing for a massive expansion in EUR/USD, indicating hidden weakness in the dollar. This SMT confluence is the "secret signal" that transforms a simple pattern into a high-probability trade setup.
The overall perspective is that the setup is valid: a Turtle Soup at a key level (CRTL) in EUR/USD, indicating an imminent explosive move (SMT equals expansion!), provided the DXY failed to move in tandem.
Greetings,
MrYounity

EURUSD: Updated Support and Resistance Analysis 🇪🇺🇺🇸
Here is my latest structure analysis, important supports
and resistances for EURUSD for next week.
Consider these structures for pullback/breakout trading.
❤️Please, support my work with like, thank you!❤️
I am part of Trade Nation's Influencer program and receive a monthly fee for using their TradingView charts in my analysis.

DeGRAM | EURUSD kept an ascending structure📊 Technical Analysis
● EUR/USD has broken above the descending resistance line while rebounding from the long-term rising support, confirming a shift toward bullish structure.
● A successful breakout retest near 1.1592 supports continuation toward 1.1665 and 1.1727, with the pair now moving inside a steep ascending wave toward the upper channel boundary.
💡 Fundamental Analysis
● Softer U.S. data and reduced expectations of Fed tightening are weakening the USD, supporting medium-term EUR recovery.
✨ Summary
Bullish bias toward 1.1665 and 1.1727; key support 1.1592 and structure breakout strengthens upside.
-------------------
Share your opinion in the comments and support the idea with a like. Thanks for your support!

DeGRAM | EURUSD is preparing to break through resistance📊 Technical Analysis
● EUR/USD continues to trade within a descending channel but is now testing the upper resistance line near 1.1580, indicating a potential breakout setup. Price has formed a higher low from 1.1520 support, signaling an early bullish reversal structure.
● A sustained move above 1.1600 would confirm a breakout toward 1.1627 resistance, while short-term consolidation may occur before continuation.
💡 Fundamental Analysis
● The euro gains moderate support as investors anticipate weaker U.S. inflation data, potentially limiting further dollar strength ahead of upcoming Fed remarks.
✨ Summary
● Support: 1.1520. Resistance: 1.1627. Bullish momentum is building, with a breakout above 1.1600 likely to confirm the next upward phase.
-------------------
Share your opinion in the comments and support the idea with a like. Thanks for your support!

EUR/USD Ready for Lift-Off from Ascending SupportThe EUR/USD pair is testing a strong ascending trendline near 1.1565, signaling a potential bullish rebound. A breakout above 1.1585 could trigger upward momentum toward 1.1620, aligning with the bullish setup shown by the rocket illustration.
1. Ascending Trendline Support
The chart shows a clear upward-sloping trendline, connecting higher lows from November 9 to November 12.
The price is currently testing this support zone (~1.1565), suggesting buyers may defend this level.
---
2. Bullish Reversal Potential
The drawn rocket symbol and arrows indicate a bullish scenario — a possible rebound from the trendline toward higher targets.
If momentum holds above 1.1560–1.1570, a short-term bullish reversal is likely.
---
3. Key Resistance Levels
Immediate resistance: 1.1585 — breaking and closing above this may confirm a bullish push.
Next resistance target: 1.1620 — this is the projected short-term goal indicated by the chart’s upper blue band.
---
4. Ichimoku Cloud Context
The Ichimoku cloud (Kumo) is slightly above price action, meaning some resistance remains ahead.

EURUSD SELL IDEAin this ananlysis we we will wait for coming supply which i draw after demand fail and the supply flip area : 1.15819 to 1.15879 ... we'll take sell :)

DeGRAM | EURUSD is testing the resistance level📊 Technical Analysis
● EUR/USD rebounded from the lower boundary of the descending channel and is now pushing above short-term resistance at 1.1530, signaling potential continuation toward 1.1600–1.1630.
● The structure shows a higher low formation supported by a break of the minor downtrend, suggesting buyers are regaining control after prolonged weakness.
💡 Fundamental Analysis
● A softer U.S. dollar following weaker Treasury yields and stable Eurozone economic sentiment supports the recovery outlook for the euro.
✨ Summary
● Support: 1.1500. Resistance: 1.1600–1.1630. A breakout above 1.1550 could confirm short-term bullish momentum toward 1.1620.
-------------------
Share your opinion in the comments and support the idea with a like. Thanks for your support!

EURUSD remains unchangedThe likelihood of the U.S. government resuming operations this week is increasing, which would allow the release of additional economic data.
This could lead to higher market volatility, but the technical outlook for EURUSD remains the same.
We’re watching for a reaction around the current levels and confirmation of the next move.

EUR/USD – Alligator Indicator Signals Potential Downtrend.Technical Overview:
The Alligator Indicator is showing early signs of a bearish phase. The Lips (green), Teeth (red), and Jaw (blue) have recently crossed downward, confirming that the Alligator has “awakened” and may start feeding on a developing downtrend.
Price action is currently holding below all three moving averages, which reinforces short-term bearish momentum. Additionally, the pair failed to break above the 1.1590 resistance level, forming a lower high — a strong indication that buyers are losing control.
Key Observations:
Lips (green) < Teeth (red) < Jaw (blue) → bearish alignment
Price trading below the Alligator structure
Lower high formation around 1.1590
Volume remains moderate, showing no clear bullish recovery
Market Outlook:
As long as EUR/USD remains below 1.1570, the probability favors a continuation toward the 1.1500 – 1.1470 support zone.
A confirmed break below 1.1530 would likely strengthen this move.
On the other hand, a sustained recovery above 1.1570 – 1.1590 could invalidate the bearish setup and open the door for a short-term rebound toward 1.1600.
📉 Bias: Bearish
🎯 Targets: 1.1500 – 1.1470
❌ Invalidation: Break and close above 1.1570 / 1.1590
The Alligator has awakened — price may soon decide its next feast. Stay patient and follow the structure.

EUR/USD It is at OB LVL and pivot lvl cpr sell limitI've been waiting for this level for several days for EUR/USD. I'm expecting a drop in it, always with a risk appetite.
EUR/USD: Bullish Surge to 1.16?As the previous analysis worked exactly as predicted, FX:EURUSD is gearing up for a bullish breakout on the 4-hour chart , with price bouncing firmly off a key support zone and upward trendline, forming higher lows that signal strengthening buyer momentum and potential reversal from recent downtrend pressures. This confluence at the entry zone offers a high-conviction long setup.
Entry between 1.14850-1.15 for a buy position. Target at 1.16 near resistance, delivering a risk-reward ratio greater than 1:4 . Set a stop loss on a close below 1.148 to protect against downside breaks. 🌟 Look for confirmation with a strong bullish candle and rising volume above the entry, capitalizing on EUR resilience.
Fundamentally , this week brings significant news for both EUR and USD—key releases include Eurozone PMI data, US Nonfarm Payrolls, and ongoing FOMC rate decision fallout, all capable of driving sharp moves in the pair. 💡
📝 Trade Plan:
✅ Entry Zone: 1.14850 – 1.1500 (buy near support/trendline)
❌ Stop Loss: Close below 1.1480
🎯 Target: 1.1600 (major resistance zone)
💎 Risk-to-Reward: > 1:4, making this an attractive long opportunity for technical traders.
What's your play on this setup? Drop your thoughts below! 👇
EURUSD FRGNT Daily Forecast -Q4 | W46 | D11 | Y25 |📅 Q4 | W46 | D11 | Y25 |
📊 EURUSD FRGNT Daily Forecast
🔍 Analysis Approach:
I’m applying Smart Money Concepts, focusing on:
Identifying Points of Interest on the Higher Time Frames (HTFs) 🕰️
Using those POIs to define a clear trading range 📐
Refining those zones on Lower Time Frames (LTFs) 🔎
Waiting for a Break of Structure (BoS) for confirmation ✅
This method allows me to stay precise, disciplined, and aligned with the market narrative, rather than chasing price.
💡 My Motto:
"Capital management, discipline, and consistency in your trading edge."
A positive risk-to-reward ratio, paired with a high win rate, is the backbone of any solid trading plan 📈🔐
⚠️ Losses?
They’re part of the mathematical game of trading 🎲
They don’t define you — they’re necessary, they happen, and we move forward 📊➡️
🙏 I appreciate you taking the time to review my Daily Forecast.
Stay sharp, stay consistent, and protect your capital
— FRNGT 🚀
OANDA:EURUSD

EURUSD holding steadyThe U.S. markets are closed today, which suggests lower trading volumes and reduced volatility.
EURUSD is holding around the 1,1550 level as we watch for the next move.
Expect increased fluctuations on Thursday when the government is set to reopen.
The target remains unchanged. Avoid taking aggressive entries today.

EUR/USD Is Indecisive ?EUR/USD is trading with a bearish overall market structure on the 1-hour timeframe, currently below the key 1.1600 level. The pair is consolidating near resistance, with technical signals pointing to potential downside continuation unless new bullish catalysts emerge.
Technical Market Structure
Recent price rallied off the November low, with the current session showing consolidation just below resistance around 1.1565–1.1610.
Key support levels to watch are 1.1538 (recent H1 swing low), 1.1520, and 1.1460. A break below these could accelerate a move towards 1.1405.
The moving averages on the chart show a crossover pattern, suggesting short-term bullish exhaustion and possible transition back to bearish momentum.
Short-term corrective moves are possible up to 1.1590–1.1610, but rejection here could favor another wave down.
Elliott Wave and price envelope analysis forecast consolidation or short-lived correction followed by decline toward 1.1450 or lower.
Fundamental Analysis
Fed rate cut bets are driving market dynamics. The FOMC lowered rates by 25 basis points at the last meeting, and although another cut in December is possible, the decision is split among policymakers, causing uncertainty.
Recent weak U.S. labor data and political gridlock are weighing on the dollar, supporting euro strength in the very short term.
ECB policymakers are signaling steady rates, with limited downside for the euro and potential for euro strength over the coming months if the Fed enters a rate-cutting cycle.
Upbeat Eurozone data (ZEW sentiment, GDP, investor confidence) due this week could boost EUR/USD, but bearish risk remains if Fed rate cut expectations fade or U.S. macro data improves.
Potential Daily Movement
Bias leans bearish for the day unless EUR/USD can break and hold above 1.1590–1.1610, which could open upside to 1.1700.
Downside targets for further weakness include 1.1530, then 1.1460, and potentially 1.1405 if support fails.
In the event of renewed risk-on sentiment from U.S. shutdown resolution or positive Euro data, a push to the next resistance zone (1.1610–1.1690) is possible, but strong sellers remain active at these levels.
Key Levels Table
Zone Level Action
Resistance 1.1590–1.1610 Sell/reject if fails
Resistance 1.1690–1.1770 Strong sellers above
Support 1.1530–1.1460 Watch for breaks down
Support 1.1405 Bearish extension zone
Upside Target 1.1700+ Bullish if breakout
Overall, expect choppy intraday price action with a bearish tilt unless external fundamentals force a decisive bullish breakout above 1.1610 resistance.

TIME TO SELL EURUSD! amazing opportunity..EURUSD has recently broken a powerful channel that it was stuck in-between for several weeks and struggled to break upwards. The price also tried to retrace back to the upside but it struggled and could not break through the 0.618 level (which is acting as resistance). There is also a trendline which the price is struggling to break through towards the upside (resistance number 2). The price is very likely to keep dropping and head to our target zone (next major support level) - SELL !

EUR/USD: A short position may be coming soon.💹 **EUR/USD Update:**
The 1.1580–1.1600 zone remains a **strong resistance area** for EUR/USD. Next week, the pair may attempt to break above this level. However, if it fails to do so, we could see a **pullback toward 1.1400**, and possibly even **1.1300**, which stands as a key **support zone**.
👉 Keep an eye on price action around these levels — a rejection here could signal a potential short opportunity.

EUR/USD: Bearish Setup Confirmed After Head and Shoulders BreaksHi guys!
The chart shows a Three Drives pattern followed by a Head and Shoulders formation, both signaling potential bearish continuation.
The Three Drives Pattern:
The price completed three consecutive bullish drives, each showing signs of exhaustion. This structure often indicates a weakening uptrend and prepares the ground for a larger reversal.
The Head and Shoulders Pattern:
After the third drive, the market formed a clear head and shoulders structure, confirming distribution at the top. The neckline has already been broken, suggesting a shift from bullish to bearish sentiment.
Current Structure and Expectation:
Price is now retesting the neckline area after the breakdown. A rejection from this level would likely trigger a deeper decline toward the highlighted target zone, which aligns with previous demand and the flip area.
Target:
The projected target of the head and shoulders pattern falls near 1.12500, matching the lower pink zone on the chart.
In summary, unless the market decisively reclaims the neckline and trendline support, EUR/USD remains biased to the downside, with the 1.1250 area as the next key level to watch.
Disclaimer: As part of ThinkMarkets’ Influencer Program, I am sponsored to share and publish their charts in my analysis.

Important week ahead for EURUSDA crucial week is coming for the market. The U.S. government is expected to resume operations by the end of the week, which will allow the release of the delayed economic data.
On Thursday, inflation data will be published — the key factor that could determine the next major move.
EURUSD has reached the resistance zone and bounced off it.
Now, the focus is on whether a higher low will form.

EURUSD BUY TRADE As a key level zone trading strategy trader.
Am seeing an opportunity on EURUSD for a buy
Entry: 1.15469
Stop loss: 1.15274
Take profit: 1.6655
You can comment your opinion
