EUR/USD Breakout Done , Ready To Get This 150 Pips ?Here is my 2H Chart on EUR /USD , We Have A Great Breakout and then the price Back Above my Support and we have a very good Bullish Price Action on 1&2&4 Hours T.F Also the price playing very good around my Support and i`m waiting the price to retest the broken area and giving a good Bullish price action For the second time on smaller time frames to can get a confirmation to enter a buy trade after this big movement to downside that we Entered last week , So i see it`s a good chance to buy this pair if it go down a little to retest the broken area and then we can buy it and targeting 100 to 150 pips . and if we have a daily closure again below my new support then this idea will not be valid anymore .
Reasons To Enter :
1- Perfect Breakout .
2- Clear Bullish Price Action .
3- Bigger T.F Giving Good Bullish P.A .
4 - Perfect 15 Mins Closure .
5- The Price Respect The Support .
Eurusdbuy

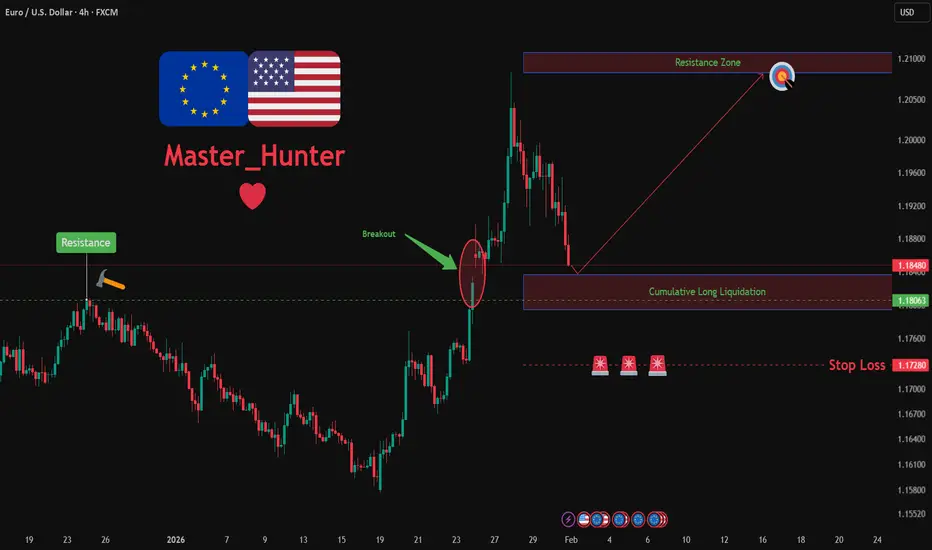
EURUSD: Bullish Push to 1.208?FX:EURUSD is eyeing a bullish continuation on the 4-hour chart , with price rebounding from support after recent consolidation, converging with a potential entry zone that could fuel upside momentum if buyers push through short-term resistance. This setup suggests a rally opportunity amid the ongoing uptrend, targeting higher levels with approximately 1:2.5 risk-reward .🔥
Entry between 1.1800–1.18350 for a long position. Target at 1.2080 . Set a stop loss at a daily close below 1.1828 , yielding a risk-reward ratio of approximately 1:2.5 . Monitor for confirmation via a bullish candle close above entry with rising volume, leveraging the pair's momentum near support.🌟
Fundamentally , EURUSD is trading around 1.182 in early February 2026, with key events this week potentially driving volatility. For the Euro, Thursday February 5 at 1:15 PM UTC brings the ECB Interest Rate Decision (previous 1.75%), where a hold or dovish signals could weaken EUR amid economic concerns. Also on February 5, the ECB Press Conference at 1:45 PM UTC for policy insights that may cause sharp moves. For the US Dollar, Wednesday February 4 at 2:15 PM UTC features ADP Non-Farm Employment Change (Jan, forecast 41K), potentially pressuring USD if softer. Thursday February 5 at 1:30 PM UTC brings Unemployment Claims (week of Jan 31, forecast 209K), with higher figures weakening USD. Friday February 6 at 1:30 PM UTC includes Non-Farm Payrolls (Jan, forecast 50K) and Unemployment Rate (Jan, forecast 4.4%), the week's highlight—weak data could favor EUR upside. 💡
📝 Trade Setup
🎯 Entry (Long):
1.1800 – 1.1835
(Entry from current price is valid with proper risk & position sizing.)
🎯 Target:
• 1.2080
❌ Stop Loss:
• Daily close below 1.1828
⚖️ Risk-to-Reward:
• ~ 1:2.5
💡 Your view?
Does EURUSD continue higher toward 1.2080, or will ECB/NFP volatility force another consolidation before the next leg up? 👇
EURUSD LONG IDEA1d- bullish
4h - bullish
1h - bullish + hidden bullish divergence
15m - sideways , waiting to turn 15m bullish to continue the trend

#EUR/USD Buy Trade Scenario.Here’s an up-to-date EUR/USD Buy trade outlook (technical + fundamental) to help you assess whether positioning for a Upside makes sense right now.
Thank You......

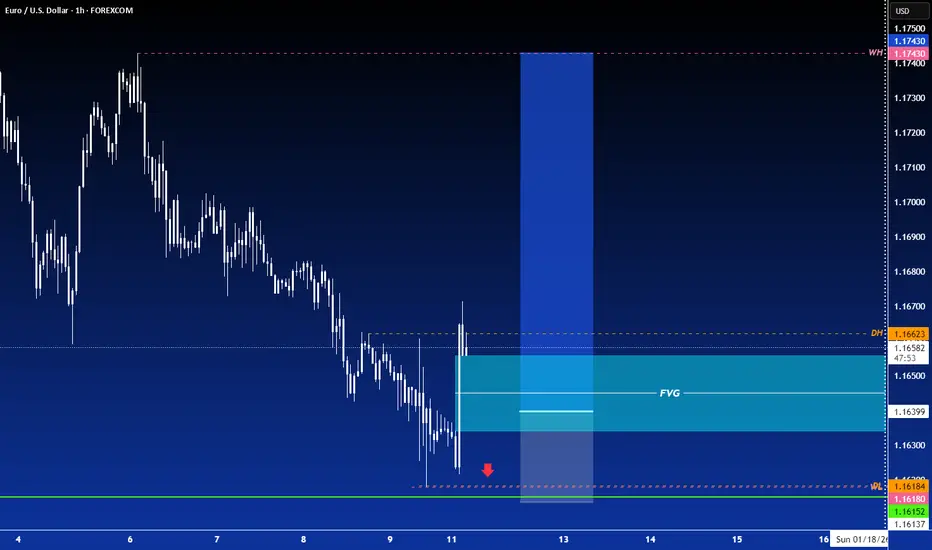
LONG ON EUR/USDEUR/USD has retraced into a nice FVG after giving us a choc (change of character) from down to up.
The dollar (dxy) is bearish which correlates with EU rising.
I will be buying EU looking to catch 100-150 pips to the next swing high.

LONG ON EUR/USDEUR/USD has just given a CHOC (change of character) to the upside from is recent downtrend.
The dollar (DXY) is very bearish and I expect EUR/USD to simply retrace a little deeper into the FVG before it begins to rise.
looking to make 80-100 pips.
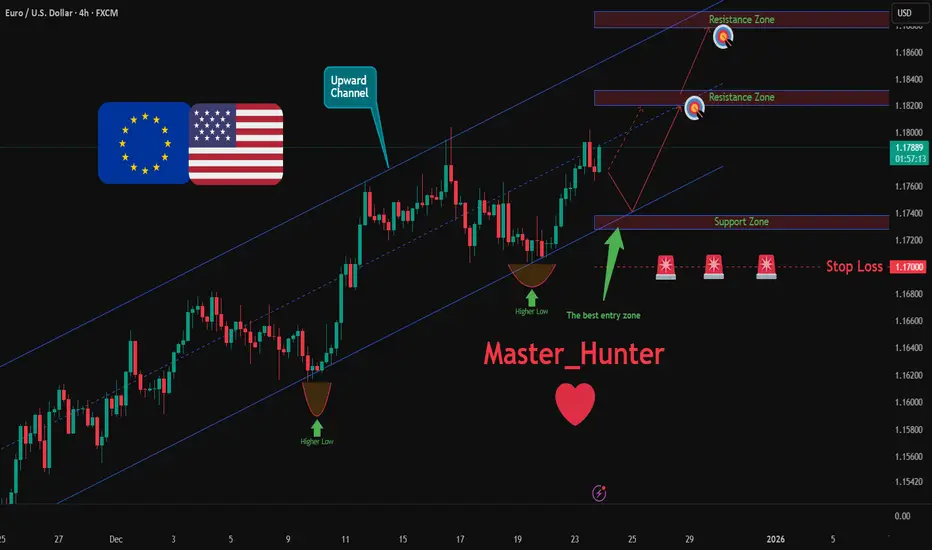
EURUSD: Bullish Push to 1.1878?As the previous analysis worked exactly as predicted, FX:EURUSD is eyeing a bullish breakout on the 4-hour chart , with price rebounding from higher lows in an upward channel after a breakout candle, converging with a potential entry zone that could ignite upside momentum if buyers push through short-term resistance amid recent volatility. This setup suggests a continuation opportunity in the uptrend, targeting higher levels with overall risk-reward exceeding 1:3.5 .🔥
Entry between 1.1728–1.1738 for a long position. Targets at 1.1820 (first), 1.1878 (second). Set a stop loss at a daily close below 1.1700 , yielding a risk-reward ratio of more than 1:3.5 in total . Monitor for confirmation via a bullish candle close above entry with rising volume, leveraging the pair's momentum in the channel.🌟
Fundamentally , EURUSD is trading around 1.178 in late December 2025, with key US Dollar events this week potentially weakening USD if data underperforms, favoring euro strength. For the US Dollar, Tuesday, December 23 at 05:30 AM UTC brings GDP Growth Rate QoQ Q3 (forecast 3.3%, previous 4.3%), Core PCE Prices QoQ Q3 (forecast 2.9%, previous 2.9%), PCE Prices QoQ Q3 (forecast 2.8%, previous 2.8%), and Real Consumer Spending QoQ Q3 (previous 3.5%); followed by CB Consumer Confidence DEC at 07:00 AM UTC (forecast 91, previous 89.1). No major high-impact events for the Euro this week, leaving the pair sensitive to USD catalysts. 💡
📝 Trade Setup
🎯 Entry (Long):
1.1728 – 1.1738
(Entry at these levels is valid with proper risk & capital management.)
🎯 Targets:
• 1.1820 (TP1)
• 1.1878 (TP2)
❌ Stop Loss:
• Daily close below 1.1700
⚖️ Risk-to-Reward:
• > 1:3.5 (total)
💡 Your view?
Does EURUSD defend the channel and push toward 1.1878 — or do we see deeper consolidation before continuation? 👇
Double bottom Is in. 30m confluence. Just at the 200ema in 30m charts.
I saw it lining up for move down further but these levels are better. Buy EURUSD.

EURUSD: Bearish Drop to 1.168?As the previous analysis worked exactly as predicted, FX:EURUSD is eyeing a bearish pullback on the 4-hour chart , with price testing resistance after forming higher lows along an upward trendline and a breakout candle, converging with a potential rejection area that could spark downside momentum if sellers defend amid recent gains. This setup hints at a correction opportunity in the uptrend, targeting lower support levels with risk-reward exceeding 1:2.
Entry between 1.1786–1.1800 for a short position. Target at 1.1682 . Set a stop loss at a daily close above 1.1830 , yielding a risk-reward ratio of more than 1:2 . Monitor for confirmation via a bearish candle close below entry with rising volume, leveraging potential reversal at resistance.🌟
Fundamentally , EURUSD faces key volatility this week with high-impact events on both sides. For the Euro, the ECB Interest Rate Decision on December 18 at 13:15 UTC (previous deposit rate 2.00%) could influence euro strength amid inflation and recession risks, followed by the ECB Press Conference at 13:45 UTC for policy insights that may cause sharp moves. For the USD, the US CPI release on December 18 at 13:30 UTC (previous YoY +3.1%) is a critical inflation gauge that could strengthen the dollar on hot readings or weaken it on cooler ones; additionally, the US Core PCE Price Index on December 19 at 15:00 UTC (previous YoY +2.9%) serves as the Fed's preferred inflation measure, impacting rate expectations. 💡
📝 Trade Setup
🎯 Entry (Short):
1.1786 – 1.1800
(Short entries in this zone are valid with disciplined risk & position sizing.)
🎯 Target:
• 1.1682
❌ Stop Loss:
• Daily close above 1.1830
⚖️ Risk-to-Reward:
• > 1:2
💡 Your view?
Is this the start of a healthy correction toward 1.1682 — or will EURUSD absorb supply and continue its bullish expansion? 👇

EURUSD: Bullish Push to 1.174?As the previous analysis worked exactly as predicted, FX:EURUSD is eyeing a bullish breakout on the 4-hour chart , with price forming a series of lower highs and higher lows in a contraction pattern near resistance and support zones, converging with a potential entry area that could ignite upside momentum if buyers break the downtrend line amid recent consolidation. This setup suggests a reversal opportunity after the pullback, targeting higher levels with strong risk-reward.🔥
Entry between 1.1591–1.1617 for a long position (entry at current levels with proper risk management is recommended). Target at 1.1742 . Set a stop loss at a daily close below 1.1582 , yielding a risk-reward ratio of approximately 1:4. Monitor for confirmation via a bullish candle close above entry with rising volume, leveraging the pair's potential recovery.🌟
Fundamentally , EURUSD is trading around 1.167 in early December 2025, with key events this week potentially influencing direction. For the Eurozone, Tuesday's Flash CPI (YoY: Forecast 2.1%) and Core CPI (YoY: 2.4%) could support EUR if inflation holds steady, signaling ECB policy stability, while Friday's final Q3 GDP (QoQ: 0.2%) may reinforce modest growth. Thursday's Retail Sales (MoM: Actual 0%, Forecast 0.1%; YoY: Actual 1.5%, Forecast 1.3%) showed mixed results, with stronger YoY potentially bolstering consumer demand views but flat MoM raising softness concerns. For the US, Monday's ISM Manufacturing PMI (Forecast 49.0) and Fed Chair Powell's speech could weaken USD if dovish, amid rate cut hopes; Wednesday's ADP Nonfarm (Forecast 19K) and ISM Non-Manufacturing (Forecast 52.0) may pressure USD further on weak data; Thursday's Initial Jobless Claims (Actual 191K, Forecast 220K) beat expectations, suggesting labor resilience that might limit USD weakness; and Friday's Michigan Consumer Sentiment (Forecast 52) could weigh on USD if softer. Overall, disappointing US labor stats (e.g., recent rises pushing EURUSD up 0.40% to 1.1668) and Fed cut optimism could favor EUR strength, though resilient claims may cap gains. 💡
📝 Trade Setup
🎯 Entry (Long):
1.1591 – 1.1617
(Entry at current levels is acceptable with proper risk management.)
🎯 Target:
1.1742
❌ Stop Loss:
Daily close below 1.1582
⚖️ Risk-to-Reward:
≈ 1:3+
💡 Your take?
Does EURUSD break the downtrend and push toward 1.1742, or does USD resilience slow the breakout?

EURUSD Short Term Buy Trading Opportunity SpottedH4 - Price has made a turn around
Expecting short term bullish moves to happen until the two strong support zones hold
👉 If you enjoy this analysis, please Like, Follow, and Support the profile! Your engagement motivates us to share more quality setups.

EURUSD - H4 - Rally towards 1.20 Eurusd - H4 - monthly trend is still up regardless of the noise that's happened in the past few weeks.. I see a pullback into a H4 demand around 1.1620 and then a rally towards 1.20 ultimately

EURUSD 30M: Identifying Key Demand Zone for Potential ReversalEUR/USD 30-Minute Chart Analysis: Signs of Bullish Reversal Amid Downtrend
the EUR/USD currency pair on a 30-minute timeframe. It captures price action from approximately December 3 to December 6, 2025, based on the x-axis labels (21:00 on Dec 3 through 21:00 on Dec 6, though the labels appear truncated). The chart uses a candlestick format to illustrate market movements, with annotations highlighting potential reversal signals. At the time of the snapshot, the pair is quoted at 1.16571, with a daily high of 1.16580, low of 1.16552, close of 1.16573, showing a slight decline of -0.0002 (-0.01%) and volume of 50,509.
The overall visual suggests a short-term downtrend in EUR/USD, characterized by a series of red (bearish) candles, but with emerging bullish cues at lower levels. This could indicate exhaustion in selling pressure and the potential for a reversal. Below, I'll break down the chart in detail, incorporating technical analysis elements, key patterns, and broader context for traders. This explanation is structured as a TradingView-style idea for clarity and professionalism.
Chart Overview and Timeframe Context
The 30-minute chart provides a granular view of intraday price dynamics, ideal for short-term traders like scalpers or day traders. EUR/USD, one of the most liquid forex pairs, often reacts to economic data releases, interest rate differentials between the ECB and Fed, and geopolitical events. On this date (December 4, 2025), the pair appears to be trading in a narrow range around 1.1650–1.1680, following a broader downtrend visible in the left portion of the chart.
The y-axis scales from approximately 1.1635 to 1.1680, with price labels on the right. The x-axis shows time in UTC, spanning multiple trading sessions (including overnight hours), which highlights the 24/5 nature of forex markets. The background is light green, with a horizontal green band marking a "Reversal Zone - Demand Zone" near the lower end, suggesting a support area where buyers may step in.
Key visual elements include:
Candlesticks : Predominantly red bodies with long upper and lower wicks, indicating volatility and seller dominance early on, followed by smaller candles near the bottom, hinting at indecision.
Annotations:
A green horizontal zone labeled "Reversal Zone - Demand Zone" around 1.1645–1.1650, with a green circle at the base.
A purple circle labeled "Volume Burst" at the low point, suggesting a spike in trading activity.
A black arrow pointing upward to "Pattern Bust" near the recent candles, implying a failed bearish pattern.
"Ask" labeled in red at 1.16578, possibly indicating the current ask price or a target level.
A U.S. flag icon and lightning bolt at the bottom, which might represent news events or alerts (common in TradingView).
This setup points to a classic reversal scenario: after a sell-off, the price enters a demand zone with increased volume, busting a potential continuation pattern and signaling bullish momentum.
Technical Analysis: Patterns and Indicators
From a technical perspective, the chart reveals a bearish-to-bullish transition. Let's dissect the key components:
Downtrend Structure: The left side shows a series of lower highs and lower lows, with large red candles from around 1.1680 down to 1.1650. This could represent a pullback within a larger trend, possibly influenced by USD strength (e.g., due to U.S. economic data or Fed policy hints). Wicks on these candles indicate rejection at highs, reinforcing seller control.
Reversal Zone and Demand Zone: The highlighted green band (approximately 1.1645–1.1650) acts as a support area. In price action trading, demand zones are regions where historical buying interest has absorbed selling pressure, often leading to bounces. The price touching this zone with a "Volume Burst" (purple circle) suggests institutional accumulation—traders buying dips amid high turnover. This burst could be measured via volume bars (though not fully visible here), where a spike often precedes reversals.
Pattern Bust: The annotation "Pattern Bust" with an upward arrow likely refers to a failed bearish pattern, such as a head-and-shoulders continuation or a flag breakdown. In trading psychology, a "bust" occurs when a pattern sets up for one direction but reverses sharply, trapping participants (e.g., short sellers covering positions). Here, after probing the demand zone, the price forms a small green candle or doji, indicating bullish rejection and potential for an upside breakout.
Volume and Momentum Insights: The "Volume Burst" at the low is crucial—high volume at support often signals capitulation (final sellers exiting) followed by reversal. If integrated with indicators like RSI or MACD (not shown but implied in TradingView setups), we'd likely see oversold conditions (e.g., RSI below 30 rebounding). The chart's minimalism focuses on pure price action, aligning with strategies like Supply/Demand or ICT (Inner Circle Trader) methodologies.
Broader Trend Lines and Levels: An implied horizontal support at 1.1650 runs across the chart, with potential resistance at 1.1670–1.1680 (from prior highs). The arrow suggests an upward trajectory, possibly targeting the ask at 1.16578 or higher. No explicit trend lines are drawn, but the structure implies a channel breakdown turning into a false breakout.
In summary, this chart embodies a "fakeout" scenario: bears push to new lows, but volume and zone defense by bulls create a springboard for recovery.
Fundamental Context for EUR/USD
While the chart is technical, fundamentals provide color. As of December 4, 2025, EUR/USD might be influenced by:
Eurozone inflation data or ECB meeting outcomes, potentially weakening the euro if dovish.
U.S. non-farm payrolls (NFP) anticipation, often causing volatility—strong data could bolster USD.
Global risk sentiment: Risk-off environments favor USD as a safe haven.
Traders should cross-reference with economic calendars; a volume burst might coincide with news like PMI releases.
Trade Idea: Bullish Reversal Setup
Based on the chart:
Entry: Long above the demand zone confirmation, e.g., a close above 1.1655 with increasing volume. Wait for a bullish candle engulfing the prior red one.
Stop Loss: Below the demand zone low, around 1.1640, to protect against further downside.
Take Profit: Initial target at prior resistance (1.1670), with extensions to 1.1680 or Fibonacci retracement levels (e.g., 50% of the downmove).
Risk-Reward Ratio: Aim for 1:2 or better—risk 10 pips to gain 20+.
Timeframe Suitability: Ideal for intraday trades, holding 1–4 hours. Scale out positions if momentum builds.
This idea assumes no major news breaks; always use a demo account for testing.
Risk Management and Trader Mindset
No trade is without risk—forex markets are prone to whipsaws, especially in ranging conditions like this. Key mindsets:
Discipline Over Emotion: Stick to the zone; don't chase if the reversal fails.
Position Sizing: Risk no more than 1–2% of capital per trade to survive drawdowns.
Confirmation Bias Avoidance: The "Pattern Bust" is promising, but validate with multi-timeframe analysis (e.g., check 1H or 4H for alignment).
Continuous Learning: Charts like this teach the value of volume in reversals—study historical EUR/USD zones for patterns.
In conclusion , this 30-minute EUR/USD chart signals a potential shift from bearish exhaustion to bullish control, driven by the demand zone and volume burst. If confirmed, it could offer a high-probability setup. Monitor for follow-through in subsequent sessions. For real-time updates, refer to TradingView or reliable forex platforms. Trade responsibly.

EURUSD Temporary sellEURUSD Temporary sell to the BUY entry. Let's take sell to the FVG then we will continue with BUY entry afrer confirmation.

EURUSD: Bullish Push to 1.167?FX:EURUSD is eyeing a bullish breakout on the 4-hour chart , with price rebounding from a key support zone near recent lows, converging with cumulative sell liquidation and a potential entry area that could spark upside momentum if buyers hold against short-term pullbacks. This setup hints at a reversal opportunity after the recent downtrend, targeting higher resistance levels with strong risk-reward.
Entry between 1.1490–1.1500 for a long position (aggressive entry right here with proper risk management is recommended). Targets at 1.1590 (first), 1.1670 (second). Set stop loss on a close below 1.14685 , delivering a clean risk-reward ratio of ~1:4+ (full run). Watch for bullish confirmation on lower timeframe breakout or strong green candle with volume surge.⚡
Fundamentally , peace talks between Russia and Ukraine are gaining traction in November 2025, with US officials (including Army Secretary Dan Driscoll) engaging in secret negotiations in Abu Dhabi under a proposed Trump-backed plan, where Ukraine has agreed in principle but minor details remain, though Russia shows reluctance and may reject revisions. This could positively impact the euro's upward trend by reducing geopolitical risks, stabilizing European energy markets, and boosting investor confidence in the region's economy.
📝 Trade Setup
🎯 Entry (Long):
1.1490 – 1.1500
(Aggressive entry at current levels is acceptable with strict risk management.)
🎯 Targets:
• TP1: 1.1590
• TP2: 1.1670
❌ Stop Loss:
• Close below 1.14685
⚖️ Risk-to-Reward:
• ~1:4+ full target
👇 Share your thoughts below! 👇

EUR/USD Long AnalysisEUR/USD Buy Analysis
The EUR/USD pair currently shows a notable draw on sell-side liquidity around the Previous Weekly Low (PWL), alongside an unfilled daily Fair Value Gap (FVG).
This zone aligns with additional confluence factors, including the 0.618 retracement level of the prior Fibonacci range and the Point of Control (POC) from the volume profile.
Given these elements, a retracement into this area is likely, where price may sweep the PWL and mitigate the outstanding daily imbalance before initiating a move toward the buy-side.
It is also important to note the presence of significant buy-side liquidity, including the Previous Daily High (PDH), the London session high, and an H1 SIBI that remains unfilled.
These factors provide a clear upside draw once the sell-side objectives are met.

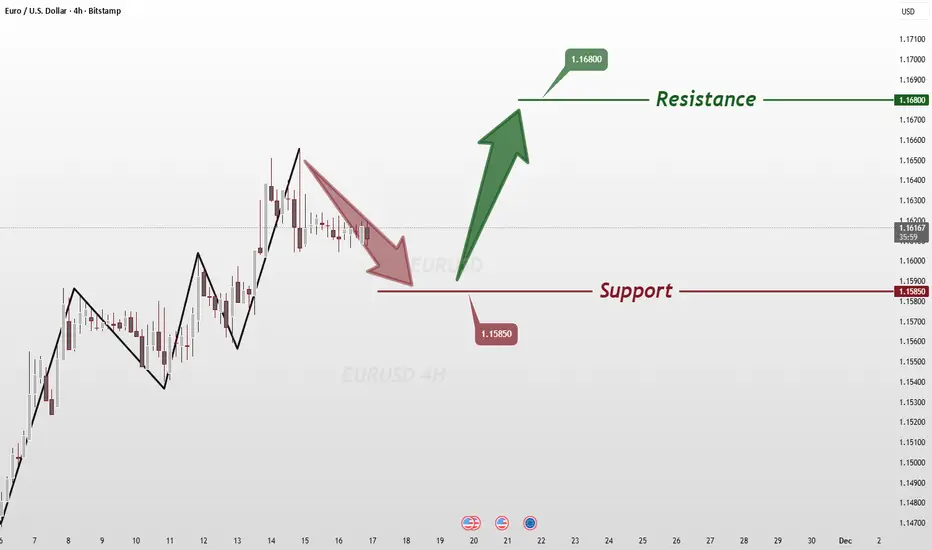
Range-Bound Trading: Awaiting a ReboundThe market is currently in range - bound trading, waiting for a rebound.
Buy 1.15750 - 1.15800
TP 1.16300 - 1.16500 - 1.16750
Accurate signals updated daily. They serve as a reliable guide for trading issues – feel free to refer to them. Hope they help!

Pullback to 1.15850, Uptrend ContinuesLast week saw a distinct uptrend, with a minor retracement afterward. Post-opening, the pullback is likely to extend to 1.15850, then the uptrend will continue
Buy 1.15850 - 1.16000
TP 1.16300 - 1.16500 - 1.16750
Accurate signals updated daily. They serve as a reliable guide for trading issues – feel free to refer to them. Hope they help!
EUR/USD: Bullish Surge to 1.16?As the previous analysis worked exactly as predicted, FX:EURUSD is gearing up for a bullish breakout on the 4-hour chart , with price bouncing firmly off a key support zone and upward trendline, forming higher lows that signal strengthening buyer momentum and potential reversal from recent downtrend pressures. This confluence at the entry zone offers a high-conviction long setup.
Entry between 1.14850-1.15 for a buy position. Target at 1.16 near resistance, delivering a risk-reward ratio greater than 1:4 . Set a stop loss on a close below 1.148 to protect against downside breaks. 🌟 Look for confirmation with a strong bullish candle and rising volume above the entry, capitalizing on EUR resilience.
Fundamentally , this week brings significant news for both EUR and USD—key releases include Eurozone PMI data, US Nonfarm Payrolls, and ongoing FOMC rate decision fallout, all capable of driving sharp moves in the pair. 💡
📝 Trade Plan:
✅ Entry Zone: 1.14850 – 1.1500 (buy near support/trendline)
❌ Stop Loss: Close below 1.1480
🎯 Target: 1.1600 (major resistance zone)
💎 Risk-to-Reward: > 1:4, making this an attractive long opportunity for technical traders.
What's your play on this setup? Drop your thoughts below! 👇
EURUSD BUY TRADE As a key level zone trading strategy trader.
Am seeing an opportunity on EURUSD for a buy
Entry: 1.15469
Stop loss: 1.15274
Take profit: 1.6655
You can comment your opinion

EUR/USD Perspective for the 2nd week of NovEU Weekly Outlook
This week, EU isn’t moving exactly in sync with GU, which is unusual — so we’ll treat it as its own setup and focus purely on what the chart is showing us right now.
- Scenario (A):
I’ll be waiting for a deeper retracement to capitalise on the bullish move and see if a rally can form from the 5hr demand zone below.
- Scenario (B):
Alternatively, if price continues climbing, I’ll be looking for buy setups up towards the 5hr supply zone. From there, I’ll wait to see how price reacts — ideally slowing down before reaching supply, especially with an Asia high sitting just above.
P.S. We’ll see what price does once the market opens Monday morning, but either POI marked could provide a solid setup this week. Stay patient and adaptable! 💪

EUR/USD Market Outlook – Bullish Projection from 1.14586 Demand The EUR/USD pair is expected to pulled back into a major demand zone around 1.14586, which aligns with a previously respected accumulation area on the chart. This zone has consistently acted as a reaction point, and current price behavior shows buyers stepping back in after a corrective move to the downside.
From this 1.14586 zone, I expect EUR/USD to continue pushing higher toward the major liquidity pool and previous swing high located around 1.1917 – 1.1918. This level represents a key supply zone that price left unmitigated during the last impulse, making it a logical target for bullish continuation.
The red line below price marks your stop loss, positioned beneath the deeper demand block around 1.1391 – 1.1392. This is an appropriate structural invalidation point: if price breaks below that zone, bullish momentum would be negated, and the upward projection would no longer be valid.
Summary of the Setup:
• Entry Bias: Bullish from the 1.14586 demand zone
• Stop Loss: Below 1.1391–1.1392 red line (structural invalidation)
• Primary Target: 1.1917–1.1918 previous high/supply zone
• Outlook: Expecting a continuation toward the high as long as price remains above the demand zone
This structure provides a clear risk-to-reward framework and aligns with the zones highlighted on my FOREXCOM:EURUSD chart.

EURUSD is ready to reverse to the UPSIDE! Buy nowEURUSD was stuck inbetween 2 support and resistance trendlines but has now broken above a powerful resistance zone today. The price is now above the resistance zone which means it is very likely to head to the next major resistance level (the green line above) Buy now!
