EUR/USD Breakout: Riding the Bull After the Channel Collapse• The price action has been moving within a descending channel, marked by two parallel trend lines sloping downward.
• This pattern typically reflects bearish consolidation, but also sets up for a potential bullish reversal if the price breaks above the upper boundary.
🔓 Breakout Signal
• The chart shows a clear breakout above the upper trend line, suggesting a shift in momentum from bearish to bullish.
• Breakouts from descending channels often lead to strong upward moves, especially when confirmed by volume or momentum indicators (not shown here).
📈 Trade Setup Details
• Risk-to-Reward Ratio:
• Approximately 1:11, which is extremely favorable.
• This setup offers a tight stop with a large upside potential—ideal for swing traders.
🧠 Strategic Insights
• Momentum Shift: The breakout suggests buyers are gaining control, potentially reversing the prior downtrend.
• Entry Timing: The trade is designed to catch early bullish momentum post-breakout.
• Stop Placement: Smartly positioned to avoid market noise while minimizing risk.
• Target Zone: Ambitious but realistic if supported by broader market sentiment or macroeconomic factors.
🔍 What to Watch Next
• Retest of Breakout Level: A pullback to the breakout zone (around 1.07440) could offer a second entry opportunity.
• Fundamental Alignment: Consider checking economic indicators (e.g., ECB or Fed policy updates) to support the technical setup.
• Trailing Stop Strategy: As price moves toward the target, trailing the stop can help lock in profits
Eurusdbuy

Buy 1.1720 - 1.1740 There’s a pullback today ↘️—we can go long directly now 🐂 and wait for a rebound 📈
Buy 1.1720 - 1.1740
TP 1.1760 - 1.1780 - 1.1800
Accurate signals are updated every day 📈 If you encounter any problems during trading, these signals can serve as your reliable guide 🧭 Feel free to refer to them! I sincerely hope they'll be of great help to you 🌟 👇

EURUSD to return bullish as it gets closer to 1.17000EURUSD is revising the bullish trendline level and is expected to continue its bullish move from there onwards.
DXY also remain bearish despite the heavy correction.
Please watch the video and let me know your thoughts.

EUR/USD Bullish Reversal Setup from Downtrend Channel (30m)”Chart Pattern
The price has been moving in a downward channel (red shaded area).
Recently, it touched the support level around 1.1766 – 1.1733 and is showing signs of slowing bearish momentum.
The setup suggests a potential bullish reversal if the support holds.
2. Key Levels
Support Zone: 1.1766 – 1.1733
Entry Point: Around 1.1766 (marked on chart)
Stop Loss: Below 1.1733
Target Point: 1.1919
3. Risk/Reward
Risk: ~33 pips (from 1.1766 down to 1.1733)
Reward: ~153 pips (from 1.1766 up to 1.1919)
Risk-Reward Ratio: ≈ 1:4.6 (very favorable)
4. Trade Idea
Buy Setup: If price confirms a bounce from the support zone (1.1766 area), a long trade could be valid.
Stop Loss: Keep it just below 1.1733 (to avoid false breakdowns).
Take Profit: 1.1919.
5. Notes
Watch for a confirmation candle (bullish engulfing, pin bar, or strong rejection) before entry.
If the price breaks below 1.1733, the bullish setup is invalid, and further downside may occur.
👉 In short: This chart is showing a potential bullish reversal setup after a downtrend channel, with a very good risk-to-reward ratio if the support holds.

EUR/USD: Bullish Surge to 1.183?FX:EURUSD is setting up for a bullish move on the 4-hour chart , with an entry zone between 1.16335-1.16650 near a key support and trendline.
The target range of 1.1808-1.183 aligns with the next resistance, offering strong upside potential. Set a stop loss on a close below 1.15740 to manage risk effectively. 🌟
A break above 1.1675 with solid volume could trigger this surge, driven by EUR strength and U.S. data shifts. Watch economic releases! 💡 Ready for this push? Drop your take below! 👇
📝 Trade Plan:
✅ Entry Zone: 1.16335 – 1.16650 (support + trendline area)
❌ Stop Loss: Daily close below 1.15740 to manage risk
🎯 Target Zone: 1.1808 – 1.1830 (next resistance)
Ready for this push? Drop your take below! 👇

EURUSD and Continuation of the upward trendWell, as you can see, it grew exactly based on the previous analysis I provided and continued along the same path... @mrshirafkan If it can stabilize at the specified level this week, it can continue its growth trend in the same direction again.

Let me tell you where the important support and resistance are.Hello friends
Given the positive price trend last week, we see that the closer the trend approaches its important resistances, the weaker it becomes, and the more likely the price will correct from these resistances.
If the price corrects from the specified resistances, the price can move to the specified targets, and we also have a good support area below that we expect buyers to support.
*Trade safely with us*

EURUSD target for w/c 15 SepEUR has a confluence of events that indicate where the action is headed. This zone may not be broken, but will likely be tested
1. Two short term Fib extentions to the long
2. a line of resistance from 9 September high

Fundamental Market Analysis for September 11, 2025 EURUSDThe euro is getting support as the market has a calmer view on the Fed: investors expect gentler moves later this year, so the dollar doesn’t look as strong as it did in mid-summer. At the same time, the ECB avoids sharp statements: the regulator is acting cautiously and making sure eurozone inflation doesn’t re-accelerate. In this environment, the euro feels more confident and can slowly climb toward 1.18000.
The US remains the key risk: if inflation or jobs data comes in much stronger than usual, the dollar will rise quickly and the euro may pull back. For now, the backdrop is neutral-to-positive for the euro: fewer market fears, stable rate expectations, and no “hawkish” surprises from Frankfurt. That makes buying moderately justified with controlled risk.
Overall: absent a major upside surprise in US data and without tough signals from the ECB, the pair has a chance to edge higher from current levels. The 1.18000 target looks realistic in the near term, and the stop level helps keep the position under control.
Trade idea: BUY 1.17000, SL 1.16850, TP 1.18000

EUR/USD breakout buy alert EUR/USD Buy Opportunity
Current Price: 1.17500
📈 Buy Entry Active — Targeting higher levels
✨ Euro showing bullish momentum against USD.
✨ Buyers are holding strong support at 1.17500.
✨ Upside pressure is building for a breakout.
✨ Trend indicates further gains ahead toward key resistance.
✨ Market sentiment favors the Euro as strength continues.
⚡ Stay with the buyers — momentum is on your side!
---
Do you want me to add specific target levels (like TP1, TP2, SL) to make it look more like a professional signal?

EURUSD Ahead of NFPEURUSD is holding its upward trend and staying above 1,1600.
Today, the U.S. jobs data will be released.
The news comes out at 1:30 PM London time and usually has a strong impact on the market.
It’s advisable to reduce risk on all open positions and avoid rushing into new trades.
Watch how the price reacts at key levels and whether it has the momentum to continue the trend.

EUR/USD Buy Setup from Support Zone towards 1.1743 TargetEUR/USD 2H Chart Analysis
The chart shows EUR/USD trading within a rising channel, with the price currently retesting the support zone (1.1600–1.1620).
Trend & Structure: Price has been respecting channel support and resistance. Currently, it bounced off the lower boundary of the channel, signaling a potential bullish reversal.
Support & Resistance: Strong support at 1.1600 zone, resistance/target at 1.1743.
Moving Averages: EMA 70 (1.1655) and EMA 200 (1.1648) are near, acting as dynamic resistance. A bullish break above them confirms upside continuation.
Candlestick & Momentum: Long wicks near support indicate buyer interest, suggesting accumulation before reversal.
Risk Management: Stop loss should be placed just below 1.1580 (last swing low).
✅ BUY Setup: From 1.1600–1.1620 support zone, targeting 1.1743 with stop loss below 1.1580.
📊 Strategies Used: Trendline channel, EMA confirmation, support/resistance, candlestick patterns, and risk-reward setup.

Previous EUR/USD Long I am now in the EUR/USD trade. I seen nice price rejection on the 15 minute time frame. TP & SL set.

EUR/USD Possible LongEUR/USD tested a key Fibonacci retracement level and is now retesting the trendline, where it has paused. The next move will depend on whether it can break through with volume and momentum, potentially targeting the key Fibonacci extension levels.

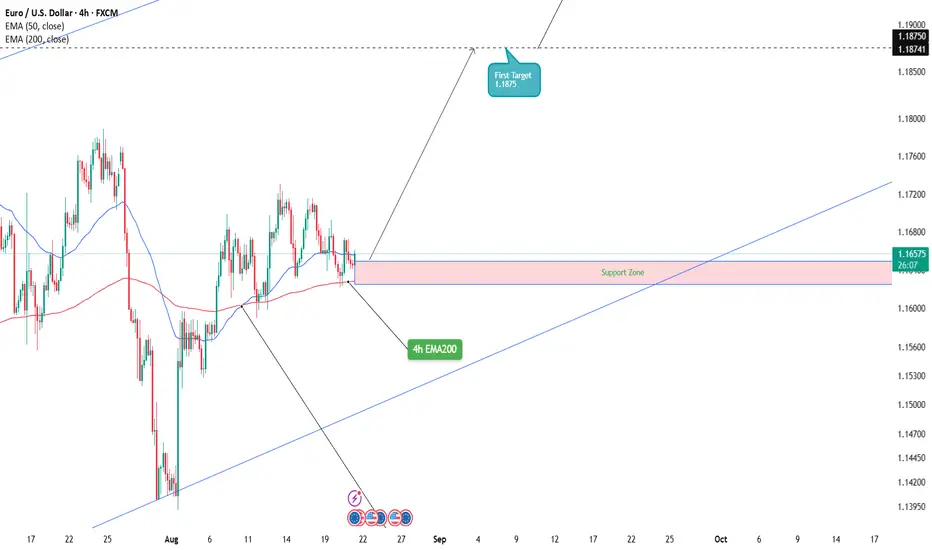
EUR/USD: Euro Rally to 1.197 on the Horizon? FX:EURUSD is poised for a bullish move on the 4-hour chart , with an entry zone at 1.165 near a solid support zone .
First target at 1.1875 marks initial resistance, while the second target at 1.197 aligns with a key psychological level. Set a stop loss on a 4-hours close below the 200 EMA to manage risk effectively.
A break above 1.17 with strong volume could spark this rally, driven by Eurozone data and USD softening. Keep an eye on ECB statements and U.S. economic releases as potential catalysts.
Ready to catch this wave? Share your thoughts below!
#EURUSD #ForexTrading #TechnicalAnalysis #TradingView #CurrencyPairs #DayTrading #MarketSignals
Descending Channel Exhaustion Bullish Reversal on the HorizonEURUSD Descending Channel Exhaustion Bullish Reversal on the Horizon
EURUSD continues to trade inside a clear descending channel, but price action is showing signs of exhaustion as it approaches a key liquidity zone. The structure suggests that buyers may soon take control, pushing price toward higher targets.
📊 MMFLOW Technical Outlook
Liquidity sweep near 1.16126 BUY ZONE signals strong potential for accumulation.
A breakout above the channel trendline will be the trigger for the bullish leg.
Key levels to the upside: 1.16694 – 1.16835 – 1.17064 – 1.17192.
💡 MMFLOW Trading Plan
Primary bias: Bullish – Buy dips near liquidity zones.
Entry ideas: Wait for confirmation at 1.16126 or a clean breakout + retest of 1.16694.
Short-term pullbacks can be scalped, but the main strategy favors swing longs.
📌 Key Levels to Watch:
Supports: 1.16126 – 1.1638
Resistances: 1.16694 – 1.16835 – 1.17064 – 1.17192
🚨 Risk Note:
Failure to hold above 1.16126 could extend the bearish channel lower. Always stick to TP/SL discipline.
✨ MMFLOW Reminder:
👉 Patience at KeyLevels = Profits
👉 Trade with the trend, not against it.

EUR/USD Bullish But... Trendline📊 EUR/USD Technical Analysis – August 19, 2025
The Euro/Dollar pair is currently trading around 1.1657, showing consolidation after recent strong moves.
🔹 Key Fibonacci Levels
Immediate resistance at 1.1687 (38.2%).
Psychological and technical barrier at 1.1775 (50%).
Major resistance at 1.1867 (61.8%).
Upside extension projected towards 1.2159 if the bearish trendline is broken.
🔹 Trend
The descending trendline (in purple) continues to act as a dynamic ceiling. Unless broken decisively, upside potential may remain limited.
🔹 Important Supports
First support at 1.1575 (23.6%).
High-liquidity zone between 1.1450 – 1.1370, crucial to maintain the medium-term bullish structure.
A break below 1.1275 could open the door to a deeper correction.
📌 Conclusion:
The pair is at a decision point. A breakout above the trendline and 1.1687 could trigger fresh bullish momentum. On the other hand, losing the 1.1575 – 1.1450 zone would increase the likelihood of a deeper pullback.

Long Trade Idea: EURUSD (Buy Setup)Market Analysis:
• Overall Trend: Bullish, supported by a clean Break of Structure (BOS) confirming upward momentum.
• Clean inducement identified
• Recent Price Action: The last bullish leg failed to clear the previous swing high and associated liquidity.
As a result, I anticipate a temporary downside move to sweep buy-side liquidity below current levels.
This pullback should create an optimal entry point for a long position, aligning with the broader bullish structure.
Trade Expectation:
Price is expected to dip lower to clear stops and liquidity before resuming the uptrend, providing a high-probability buy opportunity. Monitor for confirmation signals such as a reversal pattern or bullish divergence at lower levels.
Risk Disclaimer:
This is not financial advice. Market prices can move unpredictably due to various factors, including economic data releases, central bank speeches, interest rate decisions, geopolitical events, and policy updates. Always trade responsibly—only risk capital you can afford to lose, and employ sound risk management strategies such as stop-loss orders and position sizing.

EUR/USD 1-Hour Rising Channel – Support Zone & Potential Upside!Chart Breakdown & Technical Insights
Rising Channel Structure
The chart clearly shows EUR/USD trading within a rising channel, marked by higher highs (red arrows) and higher lows (green arrows) forming parallel support and resistance trendlines.
Key Support Zone & Bounce Potential
The price is currently sitting near the ascending trendline support, highlighted by the shaded gray box and emphasized with a circled area. Many analysts note that this lower boundary—around the 1.1690 level—serves as crucial support on a broader time frame
.
Short-Term Momentum Indicators
According to recent technical calls, EUR/USD maintains a short-term bullish bias in the rising channel. However, some momentum indicators, such as RSI, hint at weakening strength—particularly when higher price highs are not matched with higher RSI peaks, suggesting a bearish divergence
Forex Crunch
.
Potential Upside Trajectory
Should the lower channel support hold, the chart suggests a rebound toward mid-channel or potentially up to the upper boundary. Analysts highlight the 1.1720–1.1750 area as a near-term resistance, with the upper channel boundary closer to 1.1850
Alternative Scenario – Breakdown Risk
If EUR/USD breaks below the channel (below ~1.1690), the bullish structure may falter. That could expose the pair to deeper pullbacks, possibly testing lower support levels around 1.1650 or lower
.
** Summary Table**
Scenario Likely Outcome
Bounce off support Move up toward mid-channel (~1.172) or channel top (~1.185)
Breakdown below support Decline toward lower support zones (1.1650 and below)
Conclusion & Strategy Snapshot
The price is positioned at a critical support within a well-defined rising channel.
The bullish favored path: a rebound from the lower trendline toward resistance levels.
The bearish risk: a breakdown would shift momentum, possibly leading to deeper retracements.
Monitor for price action signals (e.g. bounce, candlestick patterns), RSI behavior, and behavior around these key levels.

EUR/USD Buy idea to the upside Weekly EURUSD Analysis
My outlook for EU is similar to GU — I’ll be watching for a retracement into demand before looking for buys back to the upside. The key area on my chart is the 9H demand zone, where I’ll be monitoring for signs of accumulation before entering longs.
At the same time, I’ve marked a 6H supply zone sitting at a strong premium level. If the bullish scenario doesn’t play out, this would be an ideal area to catch potential sells to the downside. Either way, I’ll be waiting for price to slow down and confirm at one of my POIs before committing.
Confluences for EU Buys:
- Strong 9H demand zone responsible for the last break of structure.
- Overall bullish structure → pro-trend trade idea.
- DXY analysis aligns with bullish EU outlook.
- Imbalance above + liquidity that still needs to be taken.
P.S. If price breaks below the 9H demand zone, I’ll be eyeing the 5H demand zone just beneath, as it’s more discounted and potentially offers an even cleaner long setup.
Let’s have a strong week ahead!

EUR/USD Analysis – Hunting a Buy Opportunity from a Key Zone💹 EUR/USD Analysis – Hunting a Buy Opportunity from a Key Zone 🇪🇺💵
After a correction and drop from the recent high, the Euro is approaching a major support area and the Buy Zone.
My scenario: If price reaches this area and confirms with price action, I expect a strong rebound towards higher targets.
📌 Key points:
Short-term bearish structure, but correction nearing completion
Support zone overlapping with Fibonacci confluence
Potential target above the previous high
⚠️ This is a personal view, not financial advice. Always apply risk management.
❓ What do you think? Could this correction be the start of a bullish rally, or will the drop continue?
------------------------------------------------------------------------------------------------------
🚀 Who am I?
I'm Mahdi, a prop firm trader with 7+ years of experience in technical analysis, mainly focusing on Smart Money Concepts and Elliott Wave theory.
I specialize in delivering high-quality trading signals, market insights, and educational content tailored for serious traders and investors.
📊 My Tools: SMC, Elliott Wave, Fibonacci, Liquidity Grabs, Order Blocks
💼 Prop Challenge Passed: Yes | Funded Account: In Progress
🔗 Follow for consistent updates and trading insights.

EUR/USD Bullish Breakout SetupEUR/USD on the 1H chart is forming a descending wedge pattern near support. A breakout above resistance could push the price toward the 1.17500 target.

Buying opportunities on EURUSDEURUSD is currently in an uptrend.
Following Friday’s news, we saw a bounce and a higher low.
The target is a retest and breakout above the previous highs around 1,1800.
The exact entry point can be identified on the lower timeframes after a reaction.
This idea becomes invalid if the price drops below 1.1388!
