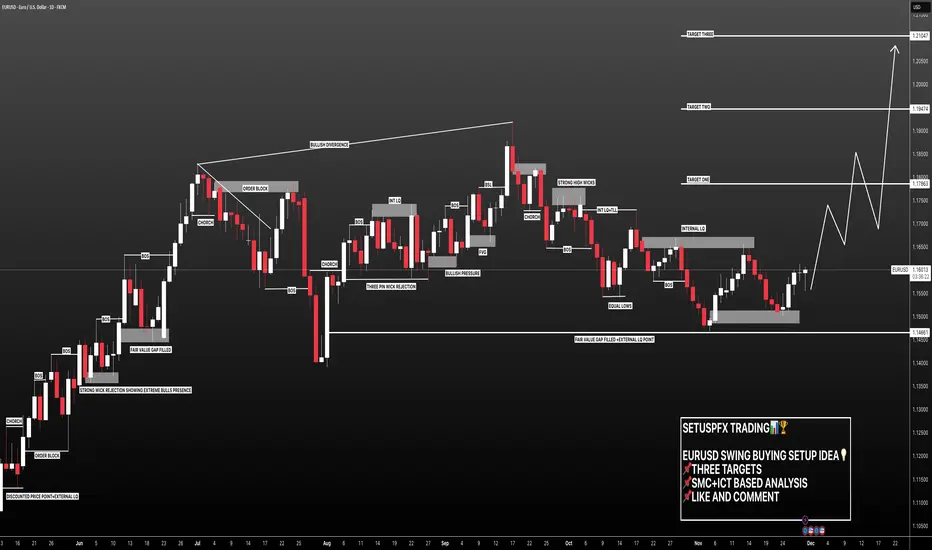
EURUSD: Three Targets Swing Buy, One Entry! **EURUSD ANALYSIS**
🔺The daily timeframe suggests a strong bullish price trend is likely to continue. After hitting some important levels and then reversing, with a big push from bullish volume, we expect the upward momentum to keep going. The lowest point of the day was at 1.1474, where the reversal happened and they broke through the main bearish trendline. Then, they tested 1.1510 again, and things have been moving up steadily since then.
🔺Looking at the basics, the US dollar might keep losing value, mainly because of what’s happening with Venezuela. This could hurt the US dollar but help the euro and other metal prices.
🔺The *Blue Marked Zone* is where we think it’s a good time to buy, and we reckon there’s a good chance of a sharp price change with strong buying pressure. We suggest setting your stop-loss order below this zone.
🔺We’ve set up three different places to make a profit, which you can use in your trading plan. When you get to the first profit level, it’s a good idea to close some of your position and move the rest to the second level. You should do the same thing for the last time you enter.
🔺If you find our work helpful, please like and comment so we can share more. We wish you all the best with your trading and really recommend making sure you have good risk management in place. Also, we suggest doing your own thorough analysis and using this information just to learn.
Team SetupsFX_👨💻📊❤️
Eurusdlongsetup

EURUSD possbly heading to order blockEURUSD with multiple liquidity trigger at the resistance level, forming a double top, price started to reverse late previous week. 4h candlestick pattern shows a strong false breakout with multiple rejection showing price may continue to drop to order block at 1.15297 or below.
Entry to sell on a liquidity sweep is higher probability and if, price hit key level 1.1529 with higher ATR look for buy

EURUSD ... Buy now!EURUSD was in a recent downtrend for the last few weeks and struggled to stay bullish, but recently it has just broken a strong resistance trend line which it tested several times and failed to break through. EURUSD is very likely to hit the next major resistance zone which is market as the "TAKE PROFIT" LEVEL. There are many clear signs of new bullish movements. time to Buy EURUSD..

TheGrove | EURUSD Sell | Idea Trading AnalysisYou can expect a reaction in the direction of selling from the specified Support zone
EURUSD moving higher as it tests the strong resistance level..
We expect a bearish move from the confluence zone.
Hello Traders, here is the full analysis.
I think we can soon see more fall from this range! GOOD LUCK! Great SELL opportunity EURUSD
I still did my best and this is the most likely count for me at the moment.
-------------------
Traders, if you liked this idea or if you have your own opinion about it, write in the comments. I will be glad 🤝

EURUSD Analysis todayHello traders, this is a complete multiple timeframe analysis of this pair. We see could find significant trading opportunities as per analysis upon price action confirmation we may take this trade. Smash the like button if you find value in this analysis and drop a comment if you have any questions or let me know which pair to cover in my next analysis.

EURUSD is in a Downside DirectionHello Traders
In This Chart EURUSD HOURLY Forex Forecast By FOREX PLANET
today EURUSD analysis 👆
🟢This Chart includes_ (EURUSD market update)
🟢What is The Next Opportunity on EURUSD Market
🟢how to Enter to the Valid Entry With Assurance Profit
This CHART is For Trader's that Want to Improve Their Technical Analysis Skills and Their Trading By Understanding How To Analyze The Market Using Multiple Timeframes and Understanding The Bigger Picture on the Charts

EUR/USD 4H Technical OutlookEUR/USD is currently trading in a clear bullish structure, supported by a rising trendline that has held price since the early December lows. The market has been printing higher highs and higher lows, confirming buyers remain in control.
Price recently broke above a prior resistance zone (marked with XXX), turning it into a key support area. The current consolidation above this level suggests healthy bullish continuation, rather than weakness.
The projected path shows a potential pullback toward the ascending trendline, which would offer a higher-low entry opportunity if buyers step in. From there, price is expected to resume its upward move, targeting the next resistance zone and ultimately the major high / highest target around 1.1918, which aligns with previous market structure resistance.
As long as price respects the rising trendline and holds above the broken resistance, the bullish bias remains intact. A clean break below the trendline would be the first warning sign of momentum loss.

EURUSD Yearly AnalysisAs the year comes to an end, 2025 was a bullish year for this pair, more-so the first part of the year.
I anticipate that 2026 might continue with the bullish momentum towards the supply zone.POI art 1.237, 1.256, 1.334.

Is EUR/USD Entering a Bullish Continuation Phase?📌 EUR/USD – “THE FIBRE”
💱 Forex Market Trade Opportunity Guide
(Swing Trade | Day Trade)
🔵 Market Bias
🟢 BULLISH STRUCTURE CONFIRMED
Price action aligns with trend continuation mechanics, supported by multi-indicator confluence and momentum expansion.
🧠 Trade Plan – Technical Confluence
✔️ Triangular Moving Average BREAKOUT
✔️ Hull Moving Average Pullback & Retest (dynamic support confirmation)
✔️ CCI Oscillator Golden Cross (momentum acceleration signal)
📊 This setup reflects trend resumption after healthy retracement, often favored by smart money continuation models.
🎯 Entry Strategy
🟢 YOU CAN ENTER AT ANY PRICE LEVEL
🔹 Traders may scale in using price acceptance above dynamic averages
🔹 Suitable for layered entries based on individual risk frameworks
🛑 Risk Management
🔴 Stop Loss (Reference Level): 1.16500
⚠️ Dear Ladies & Gentlemen (Thief OG’s)
Risk parameters must always be adjusted based on your own strategy, capital, and exposure model.
This level is not mandatory.
🏁 Profit Zone / Exit Logic
🎯 Primary Target: 1.18500
🚓 Police force zone acting as:
Strong historical resistance
Overbought price area
Liquidity trap potential
High probability reaction / correction zone
➡️ Protect profits aggressively near this zone.
⚠️ Dear Ladies & Gentlemen (Thief OG’s)
TP levels are guidelines, not financial advice. Partial profits are encouraged.
🔗 Related Pairs to Watch (Correlation & Confirmation)
💵 USD-Driven Correlation
TVC:DXY (US Dollar Index)
🔻 Weakness in DXY generally supports EUR/USD upside
🔺 Any sharp DXY reversal may cap EUR/USD gains
💶 EUR Strength Basket
OANDA:EURJPY
📈 Bullish momentum confirms EUR strength vs safe-haven JPY
OANDA:EURGBP
🔄 Range behavior here helps identify relative EUR demand
OANDA:EURCHF
🧭 Stability above key levels supports risk-on EUR flows
💷 Cross-Market Confirmation
FX:GBPUSD
✔️ Parallel bullish structure adds USD weakness confirmation
OANDA:USDCHF
🔻 Bearish bias here often aligns with EUR/USD bullish continuation
🧩 Key Insight
📌 When EUR pairs show synchronized strength and USD pairs weaken,
➡️ EUR/USD continuation probability increases significantly.
🏁 Final Note
This setup is built on trend alignment, momentum confirmation, and structured risk logic.
Discipline, patience, and execution consistency are what turn setups into profits.
📈 Trade smart. Manage risk. Protect capital.

EUR/USD Market Structure Signals Upside Potential🔔 EUR/USD Breakout Watch — Is the Fibre Ready for the Next Leg Higher?
📌 Asset
EUR/USD — “THE FIBRE”
FOREX Market Trade Opportunity Guide (Day / Swing Trade)
📈 Market Bias
🟢 Bullish Plan — Pending Order Setup
Momentum is building as price approaches a key resistance breakout zone, suggesting potential continuation once liquidity above the level is cleared.
🎯 Entry Strategy
✅ Buy after confirmed resistance breakout @ 1.18000
📌 You may enter at any price level after breakout confirmation
📌 Patience is key — let the market show acceptance above resistance
🛑 Stop Loss
🔻 Thief SL @ 1.17500
⚠️ Dear Ladies & Gentlemen (Thief OG’s):
Adjust your stop-loss according to your own risk management & position sizing.
I do not recommend blindly following my SL.
🎯 Target Zone
🚔 Police Barricade Area @ 1.18700
Strong resistance zone
Overbought conditions may appear
Possible bull trap & corrective move
👉 Escape with profits once price reacts
⚠️ Dear Ladies & Gentlemen (Thief OG’s):
I do not recommend using only my TP. Secure profits based on your own trading plan.
🔗 Related Pairs to Watch (USD Correlation)
💵 GBP/USD
Positive correlation with EUR/USD
Strength here often confirms USD weakness
💵 AUD/USD
Risk-on sentiment gauge
Bullish AUD/USD supports EUR/USD upside
💵 USD/JPY
Inverse correlation
Weak USD usually pushes USD/JPY lower while EUR/USD rises
💵 DXY (US Dollar Index)
Key driver
Sustained weakness below resistance favors EUR/USD bulls
🌍 Fundamental & Economic Factors to Monitor
📊 Eurozone Factors
ECB policy outlook & interest rate guidance
Inflation (CPI) and PMI data affecting EUR strength
Economic growth stability across core EU economies
📊 US Factors
Federal Reserve rate expectations
Inflation data (CPI, PCE) impacting USD demand
Labor market releases influencing USD volatility
📰 Upcoming High-Impact Events
Central bank speeches
Inflation & employment reports
Risk sentiment from global macro developments
📌 Volatility is expected around major data releases — manage exposure wisely.
🧠 Trader’s Reminder
💡 Trade the confirmation, not the hope
💡 Protect capital first, profits second
💡 Discipline > Emotion
👍 If this setup aligns with your market view, drop a like & share your thoughts below.
📊 Follow for more structured Forex, Index & Commodity trade blueprints.
⚔️ Trade smart. Trade disciplined.

TheGrove | EURUSD buy | Idea Trading AnalysisEURUSD is moving in an UP trend channel and moving on Resistance area .
The chart is above the support level, which has already become a reversal point twice.
We expect a decline in the channel after testing the current level.
We expect a decline in the channel after testing the current level which suggests that the price will continue to rise
Hello Traders, here is the full analysis.
I think we can soon see more fall from this range! GOOD LUCK! Great BUY opportunity EURUSD
I still did my best and this is the most likely count for me at the moment.
-------------------
Traders, if you liked this idea or if you have your own opinion about it, write in the comments. I will be glad

EURUSD: Reversal Almost Confirmed +1500 Pips In Making! FX:EURUSD
As outlined in our previous analysis, the price fell further than anticipated. Given this region, we believe the price has reversed from a crucial level. Consequently, we anticipate a significant price increase. A swing bullish move is possible, potentially gaining around +1500 pips if successful. Please like and comment if you enjoy our work.
Good luck and trade safely!
Team Setupsfx_
EURUSD: Wave Dynamics Between Correction and ImpulseEURUSD: Wave Dynamics Between Correction and Impulse
EURUSD Wave Overview (D1 and H4)
As a trader who has been practicing wave analysis for over ten years, I note that the current structure of the EURUSD pair demonstrates the completion of an extended correction and the potential for a new move.
Chart D1: The global picture indicates that the market is ending its sideways phase. The wave structure appears to be the end of a corrective sequence, which serves as the foundation for the next trend move.
Chart H4: Local dynamics confirm the formation of key entry points. Here, the first signs of an emerging impulse are visible, which could mark the beginning of a larger wave.
Main Scenario
After the completion of the corrective phase, a downward impulse sequence is expected to develop. This movement will be accompanied by increased seller activity and a gradual shift in priority to the downside.
Alternative Scenario
If the price holds above recent highs and forms a stable upward impulse structure, the priority will shift to continued growth. In this case, the correction will be considered incomplete, and the pair may experience a further rebound.
Trading Idea
Conservative approach: wait for confirmation of a breakout of key levels and enter with the trend.
Aggressive approach: use local impulses on H4 for earlier entries, but with tight stops.
In both cases, it is important to maintain strict risk management and adjust the plan as new impulses emerge.
Results
EURUSD is at the transition point between a correction and a new impulse. The wave structure on D1 and H4 provides clear guidelines for trading: watch for confirmation of the scenario and act with discipline.

EURUSD 30M | Price at Key Demand Zone – Bullish Reversal 📊 EURUSD – 30M
Price Approaching Key Reversal Demand Zone | Waiting for Confirmation
This EURUSD 30-minute chart highlights a well-defined bullish reversal zone formed after a strong impulsive move earlier in the session. Price has completed a clear bearish retracement from the recent swing high and is now trading directly inside a previous demand area, marked by strong institutional participation.
🔍 Market Structure Overview
The market previously printed a strong bullish impulse, breaking structure to the upside.
After the impulse, price entered a corrective phase, forming lower highs and lower lows.
The current decline appears corrective rather than impulsive, suggesting profit-taking instead of trend reversal.
Price has now returned to a high-probability demand zone, aligned with prior consolidation and strong bullish departure.
🟩 Reversal Zone (Demand Area)
The highlighted green zone represents a high-liquidity demand area where buyers previously entered aggressively.
This zone also aligns with:
Prior structure support
High-volume bullish candles (Volume Burst area)
Discount pricing relative to the previous impulse leg
These confluences increase the probability of a bullish reaction from this area.
📌 What We Need (Confirmation)
Price is currently inside the reversal zone, but no entry is taken blindly.
Looking for:
Bullish engulfing candle
Strong rejection wicks (liquidity sweep)
Shift in market structure on lower timeframes
Volume expansion confirming buyer interest
➡️ Patience is key — confirmation will validate institutional participation.
🎯 Trade Plan (If Confirmed)
Bias: Bullish continuation
Entry: After bullish confirmation inside the demand zone
Invalidation: Clean break and close below the demand zone
Targets:
First target: Nearest internal resistance
Second target: Previous swing high
Extended target: Continuation toward higher liquidity pools
Risk-to-reward remains favorable due to tight invalidation and higher-timeframe alignment.
🧠 Trading Psychology Note
This setup emphasizes discipline and confirmation, not prediction. High-probability trades come from waiting for price to react, not guessing bottoms. Let the market show its hand.

EURUSD(20251224) Today's AnalysisMarket News:
The US economy expanded at a rate of 4.3% in the third quarter, the fastest growth in two years, but the US consumer confidence index declined for the fifth consecutive month.
ADP Weekly Employment Report: In the four weeks ending December 6, 2025, private sector employers added an average of 11,500 jobs per week.
Trump: Those who disagree with him will never become Fed Chair. Next Fed candidate Hassett: Predicts monthly job growth may return to 100,000+, and the Fed is far behind the times on interest rate cuts.
Technical Analysis:
Today's Buy/Sell Threshold:
1.1783
Support and Resistance Levels:
1.1828
1.1811
1.1800
1.1766
1.1755
1.1738
Trading Strategy:
If it breaks above 1.1800, consider buying, with a first target price of 1.1828.
If it breaks below 1.1783, consider selling, with a first target price of 1.1766.

EURUSD Technical Analysis and Trade IdeaI’m currently keeping a close eye on EURUSD, which has been trading in a strong bullish trend. Price pushed higher with solid momentum during the Asian session, showing clear strength from buyers 📈.
That said, price is starting to look overextended, so a pullback or retracement during the London session would not be a surprise. This would be healthy price action within an overall uptrend and something worth watching closely 👀.
Later today, during the New York session, we have the Prelim GDP data release, which is a high-impact news event ⚠️. This data could inject volatility into the market.
If the GDP numbers come out negative for the US dollar, I’ll be looking for buy opportunities on EURUSD, aligning with the higher-timeframe bullish bias and waiting for price to show confirmation after the news 🟢.
As always, patience is key—let the market show its hand before committing to a trade.
Not financial advice.

EURUSD ... time to buyEURUSD was in a recent downtrend for the last few weeks and struggled to stay bullish, but recently it has just broken a strong resistance trend line which it tested several times and failed to break through. EURUSD is very likely to hit the next major resistance zone which is market as the "TAKE PROFIT" LEVEL. There are many clear signs of new bullish movements. time to Buy EURUSD...

EURUSD H1 – Institutional Volume Zones & Reversal Setup📊 EURUSD – H1 Market Structure & Volume-Based Reversal Analysis
🔍 Technical Analysis
EURUSD on the 1-hour timeframe shows a corrective phase after a prior bearish move. Price previously experienced aggressive selling pressure, followed by consolidation and a gradual recovery. The chart highlights key volume reaction zones that are now playing a decisive role in short-term direction.
📉 Previous Price Action
The left side of the chart shows strong bearish momentum, characterized by long red candles and impulsive downside moves.
This selling phase ended with capitulation-style candles, indicating exhaustion of sellers.
After the sell-off, price transitioned into a range-bound structure, forming higher lows and absorbing liquidity.
🟩 Demand Zone & Volume Burst (Lower Area)
The lower green zone represents a high-volume demand area.
Multiple rejections from this zone confirm institutional buying interest.
Volume bursts at this level indicate absorption of sell orders, often seen before a directional move.
This zone acted as a base for the current bullish push, validating it as a strong short-term support.
📈 Bullish Reaction & Structural Shift
Price broke above internal consolidation highs, signaling a short-term bullish structure shift.
Higher highs and higher lows suggest buyers are currently in control.
The bullish candles show improving momentum, but price is now approaching a critical area.
🟥 Supply / Reversal Zone (Upper Area)
The upper marked zone is a potential reversal and supply area, aligned with:
Previous price imbalance
Prior rejection zone
Expected volume expansion (Volume Burst)
This area is likely to attract profit-taking and fresh sell orders.
The highlighted circle marks a reaction point, where price may show:
Rejection wicks
Slowing momentum
Bearish candle formations
🔄 Expected Scenarios
Scenario 1 – Bearish Rejection (High Probability):
If price shows rejection within the upper zone, a pullback toward the demand zone is likely.
This would be a healthy retracement within the current structure.
Scenario 2 – Bullish Continuation:
A strong break and close above the reversal zone with volume would invalidate the short-term sell bias.
This could open the door for trend continuation toward higher liquidity levels.
🧠 Trading Insight
Avoid chasing price inside premium areas.
Best opportunities come from reaction, not prediction.
Watch for volume behavior and candle confirmation at the highlighted zones.
📌 Key Levels to Watch
Support: Lower Volume Burst / Demand Zone
Resistance: Upper Reversal & Volume Expansion Zone
Bias: Neutral to bearish at resistance, bullish only on clean breakout
💬 Always wait for confirmation. Volume + structure gives clarity, not indicators alone.

EURUSD – 30M Liquidity, QFL & Bullish Reversal Zone AnalysisEURUSD – 30M Liquidity, QFL & Reversal Zone Analysis
This 30-minute EURUSD chart presents a classic smart money setup, where price is reacting around sell-side liquidity, a QFL level, and a high-interest reversal zone. The structure clearly shows how liquidity is being engineered before a potential directional move.
Bearish Market Structure & Distribution Phase
On the left side of the chart, EURUSD forms a distribution top, followed by a strong bearish impulse. This move breaks internal structure and confirms that sellers are in control. The aggressive candles and shallow pullbacks indicate institutional selling, not retail noise.
After the initial drop, price attempts a corrective move but fails to sustain higher highs, keeping the overall bias bearish.
QFL (Quasimodo / Failed Level) Interaction
In the mid-section, price reacts around a clearly marked QFL zone. This level acts as a decision point, where previous structure fails and liquidity is manipulated. The rejection from this area reinforces bearish continuation and confirms that buyers are weak and reactive.
The QFL failure sets the stage for price to seek liquidity lower.
Liquidity Sweep Into Reversal Zone
Price then accelerates downward into the highlighted Reversal Zone, accompanied by a volume burst. This move represents a sell-side liquidity sweep, where stops below equal lows are taken.
The long lower wick and slowing momentum at this level suggest selling pressure is being absorbed, not extended. This is typically where smart money looks to close shorts or initiate early long positions.
Confirmation Is Key – Pattern or Double QFL
The note on the chart, “Need a pattern otherwise double the QFL”, is critical. It highlights two scenarios:
Bullish scenario: A clear bullish confirmation pattern (engulfing, structure break, or strong close) from the reversal zone can trigger a corrective rally.
Bearish continuation: Failure to confirm will likely result in another push lower, forming a double QFL, trapping early buyers before the real reversal.
This reinforces the idea of reaction, not prediction.
Drafted Zone as Upside Target
Above current price lies a Drafted Zone, which represents a future liquidity draw. If the reversal zone holds and confirmation appears, this area becomes a logical upside target, where price may rebalance inefficiencies and test previous supply.
The “2x” projection further supports the potential for a measured corrective move if buyers step in.
Overall Bias & Trading Insight
Primary bias: Bearish, but short-term corrective bounce possible
Key area: Reversal zone with volume confirmation
Best approach: Wait for confirmation before entry
Risk zone: Early longs without confirmation
This chart perfectly illustrates how EURUSD is moving from liquidity grab to decision point, and the next candles will reveal whether this is a true reversal or just another trap.
Final Thoughts
EURUSD is at a critical inflection point. Smart traders will stay patient, let the market show its hand, and trade after confirmation, not before.
⚠️ This analysis is based on technical and liquidity concepts and is not financial advice.

EURUSD Still Bearish | Perfect Sell-on-Rally Zone FormingEURUSD is trading inside a clear descending channel on the H1 timeframe. Price action continues to respect the channel structure, forming lower highs and lower lows, which confirms ongoing bearish momentum.
The pair recently pulled back toward the channel midline / dynamic resistance, where selling pressure re-emerged. Moving averages are also acting as dynamic resistance, keeping price capped to the downside.
As long as price remains below the upper channel boundary, the bearish bias remains valid.
🔴 Sell Trade Setup
Sell Zone: 1.1720 – 1.1730
Stop Loss: 1.1765
Take Profit 1: 1.1690
Take Profit 2: 1.1665
Risk–Reward: 1:2+
📌 Trade Logic
Descending channel intact.
Price below key moving averages.
Rejection from resistance zone.
Bearish structure remains unbroken.
Selling rallies inside the channel offers. the best probability setup.
❌ Invalidation
A strong H1 close above 1.1765 will invalidate this bearish setup and suggest a possible trend shift.
⚠️ Notes:
Watch for volatility during upcoming economic events
Wait for H1 candle confirmation before entry
Apply proper risk management (1–2% per trade)
📊 Market Bias
Trend: Bearish
Strategy: Sell on pullbacks
Timeframe: H1
👍 Like & follow for more clean price action setups.
💬 Comment if you see a breakout or continuation.

EURUSD is in a Downside DirectionHello Traders
In This Chart EURUSD HOURLY Forex Forecast By FOREX PLANET
today EURUSD analysis 👆
🟢This Chart includes_ (EURUSD market update)
🟢What is The Next Opportunity on EURUSD Market
🟢how to Enter to the Valid Entry With Assurance Profit
This CHART is For Trader's that Want to Improve Their Technical Analysis Skills and Their Trading By Understanding How To Analyze The Market Using Multiple Timeframes and Understanding The Bigger Picture on the Charts

EURUSD SELL | Idea Trading AnalysisEURUSD is moving on resistance zone
The chart is above the support level, which has already become a reversal point twice.
We expect a decline in the channel after testing the current level.
We expect a decline in the channel after testing the current level
Hello Traders, here is the full analysis.
I think we can soon see more fall from this range! GOOD LUCK! Great SELL opportunity EURUSD
I still did my best and this is the most likely count for me at the moment.
-------------------
Traders, if you liked this idea or if you have your own opinion about it, write in the comments. I will be glad ⚜️

EURUSDEURUSD
- Completed " 123 " Impulsive Waves
- Fibonacci Level - 161.80%
- Buy Side Liquidity
- Break of Structure
- S / R Level
