EURUSD Still Bearish | Perfect Sell-on-Rally Zone FormingEURUSD is trading inside a clear descending channel on the H1 timeframe. Price action continues to respect the channel structure, forming lower highs and lower lows, which confirms ongoing bearish momentum.
The pair recently pulled back toward the channel midline / dynamic resistance, where selling pressure re-emerged. Moving averages are also acting as dynamic resistance, keeping price capped to the downside.
As long as price remains below the upper channel boundary, the bearish bias remains valid.
🔴 Sell Trade Setup
Sell Zone: 1.1720 – 1.1730
Stop Loss: 1.1765
Take Profit 1: 1.1690
Take Profit 2: 1.1665
Risk–Reward: 1:2+
📌 Trade Logic
Descending channel intact.
Price below key moving averages.
Rejection from resistance zone.
Bearish structure remains unbroken.
Selling rallies inside the channel offers. the best probability setup.
❌ Invalidation
A strong H1 close above 1.1765 will invalidate this bearish setup and suggest a possible trend shift.
⚠️ Notes:
Watch for volatility during upcoming economic events
Wait for H1 candle confirmation before entry
Apply proper risk management (1–2% per trade)
📊 Market Bias
Trend: Bearish
Strategy: Sell on pullbacks
Timeframe: H1
👍 Like & follow for more clean price action setups.
💬 Comment if you see a breakout or continuation.
Eurusdlongterm

EUR/USD 4H Technical Analysis: Breakout Confirmation & Next MoveOn the 4-hour timeframe, EUR/USD has successfully broken out of a long-term descending trendline. After the breakout, the pair made a retest, confirming bullish continuation. Currently price is slightly correcting downward but still holding above key support zones.
🔍 Key Technical Highlights
📌 1. Breakout From Downtrend
The downward sloping trendline has been broken.
Price retested the breakout area — confirming valid breakout.
📌 2. Moving Averages (SMA Support)
SMA (9) remains above SMA (20) — showing short-term bullish momentum.
Current correction is holding around SMA (20), acting as support.
📌 3. Higher Lows Forming
Since mid-November, price has been forming higher lows.
This pattern supports bullish continuation.
📊 Important Price Levels
Zone Type Price
Immediate Support 1.1600
SMA Support Zone 1.1625
Major Support 1.1500
Immediate Resistance 1.1680
Major Resistance 1.1750
🧭 Market Sentiment
Bias remains bullish as long as:
EUR/USD trades above 1.1600
No strong candle closes below SMA (20)
🎯 Potential Future Scenarios
📈 Bullish Scenario
If price bounces from 1.1625 and breaks 1.1680:
➡️ Next Target: 1.1750
📉 Bearish Scenario
If price drops below 1.1600:
➡️ Next Downside Target: 1.1500
Outlook Summary
Trend Direction Confidence
Bullish Uptrend Medium–Strong
Frequently Asked Questions
Q1: Should traders look for buying opportunities?
Yes — above 1.1600, but with bullish confirmation.
Q2: Where is short (sell) opportunity?
Below 1.1600 (strong candle close preferred).
Q3: Was the breakout fake?
No. The breakout and retest confirm validity.
📌 Final Thoughts
EUR/USD remains technically bullish. The breakout structure is healthy, moving averages support the trend, and the market may aim for 1.1750 if 1.1680 breaks.

EURUSD FRGNT Daily Forecast -Q4 | W45 | D3| Y25 |📅 Q4 | W45 | D3| Y25 |
📊 EURUSD FRGNT Daily Forecast
🔍 Analysis Approach:
I’m applying Smart Money Concepts, focusing on:
Identifying Points of Interest on the Higher Time Frames (HTFs) 🕰️
Using those POIs to define a clear trading range 📐
Refining those zones on Lower Time Frames (LTFs) 🔎
Waiting for a Break of Structure (BoS) for confirmation ✅
This method allows me to stay precise, disciplined, and aligned with the market narrative, rather than chasing price.
💡 My Motto:
"Capital management, discipline, and consistency in your trading edge."
A positive risk-to-reward ratio, paired with a high win rate, is the backbone of any solid trading plan 📈🔐
⚠️ Losses?
They’re part of the mathematical game of trading 🎲
They don’t define you — they’re necessary, they happen, and we move forward 📊➡️
🙏 I appreciate you taking the time to review my Daily Forecast.
Stay sharp, stay consistent, and protect your capital
— FRNGT 🚀
OANDA:EURUSD

EURUSD Daily Forecast -Fun Coupon Fri - Q3 | W39 | D26 | Y25|📅 Q3 | W39 | D26 | Y25|
📊 EURUSD Daily Forecast
Fun Coupon Fri
🔍 Analysis Approach:
I’m applying Smart Money Concepts, focusing on:
Identifying Points of Interest on the Higher Time Frames (HTFs) 🕰️
Using those POIs to define a clear trading range 📐
Refining those zones on Lower Time Frames (LTFs) 🔎
Waiting for a Break of Structure (BoS) for confirmation ✅
This method allows me to stay precise, disciplined, and aligned with the market narrative, rather than chasing price.
💡 My Motto:
"Capital management, discipline, and consistency in your trading edge."
A positive risk-to-reward ratio, paired with a high win rate, is the backbone of any solid trading plan 📈🔐
⚠️ Losses?
They’re part of the mathematical game of trading 🎲
They don’t define you — they’re necessary, they happen, and we move forward 📊➡️
🙏 I appreciate you taking the time to review my Daily Forecast.
Stay sharp, stay consistent, and protect your capital
— FRNGT 🚀
FX:EURUSD

EURUSD – DAILY FORECAST Q3 | W35 | D28 | Y25📊 EURUSD – DAILY FORECAST
Q3 | W35 | D28 | Y25
🔍 Daily Forecast | EURUSD
Here’s a concise breakdown of the current chart setup 🧠📈:
📌 Higher time frame order blocks have been identified — these are our patient points of interest 🎯🧭.
We wait for a confirmed break of structure 🧱✅ before executing any position.
This keeps us disciplined, and in sync with what the price action is actually telling us — not what we want it to say.
📈 Risk Management Protocols
🔑 Core Principles:
Max 1% risk per trade
Execute only at pre-identified levels
Use alerts, not emotion
Stick to your RR plan (minimum 1:2)
🧠 You’re not paid for how many trades you take — you're paid for how well you manage risk.
"Trade what the market gives, not what your ego wants."
Stay mechanical. Stay focused. Let the probabilities work for you. 🎯📊
FRGNT
FX:EURUSD

EURUSD Daily Forecast — Q3 W35 D27 Y25📈 EURUSD Daily Forecast — Q3 W35 D27 Y25
Some solid long Points of Interest (POIs) lining up. Here’s the current landscape:
🔹 Technical Overview:
📍 Price is sitting on the Daily 50 EMA
→ A critical support & rejection zone we're closely monitoring.
📊 Break of Structure confirmed on both 1H and 15-min, showing strong bullish intent from our POI.
🔍 Trade Scenarios:
🟢 Aggressive Entry:
Look for a BoS from the 15' Order Block created in Asia
Enter on confirmation, and aim to move to breakeven quickly
🟡 Conservative Entry:
Wait for a 15-min BoS
Enter on a pullback into OBs or imbalances — many align with the Daily 50 EMA
🧭 Both strategies offer a strong Risk-to-Reward (R:R) if executed with discipline.
🌍 Session Outlook — London Open:
Expect London to open at Asia session lows
Watch for a liquidity sweep
Then anticipate a move to fill Asia highs
✅ Even without additional confluence, this is a viable intraday opportunity.
⚠️ Final Notes:
💼 Manage your risk
🎯 Focus on one clean setup at a time
🧠 Stack confluence — then pull the trigger with confidence
FRGNT
FX:EURUSD

EUR USDHello Traders. I want to share my weekly analysis for EURUSD with you. We have a channel from July 2008 to April 2025. Currently, it has made a breakout and I hope it will continue the bullish scenario.
I am not a professional trader and I would be happy if you share your views regarding EURUSD.

EURUSD: holds gains above 1.1500EUR/USD is finding support at the start of the week, holding above 1.1300 in European trading. A weaker US Dollar, fueled by renewed trade worries and pre-Fed positioning, is boosting the pair ahead of the US ISM Services PMI release.
EUR/USD remains capped below 1.1400, bullish bias prevailsEUR/USD's near-term outlook is neutral. The pair oscillates below a flat 20 SMA, while longer-term (100/200) SMAs maintain upward slopes. Momentum is flat around 100, and the RSI is only slightly higher near 45, suggesting limited upward potential.

EURUSD Tests 17-Year Long-Term Trend!!!After Trump announced an additional 20% in tariffs, EURUSD made a relatively surprising move and surged sharply. This marks the second leg of the upward trend that began in early March. However, the sharp rise has now brought EURUSD to the doorstep of a very long-term resistance level.
Since testing 1.60 in 2008, EURUSD has been moving lower within a wide descending trend channel that has held for 17 years. Since 2015, the pattern has evolved into a wedge formation within this broader channel. The most recent test of this resistance came last year, but at the time, a weak Eurozone economy, crowded Euro long positions, and a hawkish Fed prevented a breakout.
This time, the landscape is different. The Eurozone is showing early signs of recovery, the ECB’s rate cuts appear to be nearing their end, and European countries have started to band together following a decline in confidence in their biggest ally and decide to increase technology, defence spending.
Despite these developments, the medium-term effects of the new tariffs and the strength of the long-term resistance level are likely to prevent a clear breakout for now. Still, the long-term outlook is beginning to shift in favor of the euro, and a breakout later this year carries a significant probability.

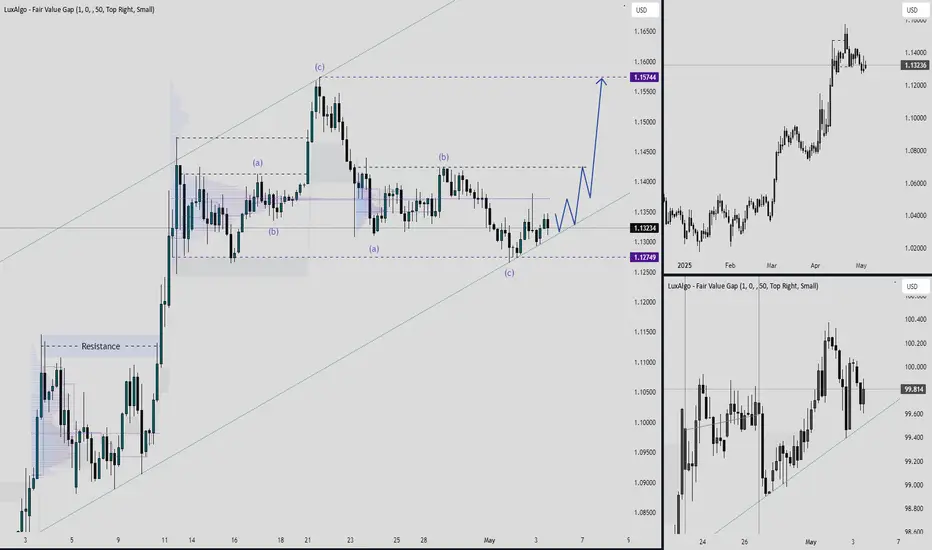
EURUSD: Trade Plan - 26/Jan/2025Hi Traders,
In the bigger picture EU has already completed the potential correction and is ready to push up.
We are going to track the behavior in smaller timeframes in order to get the better entry along with confirmation (the same has been shared separately).
Now without going into depth, looing at EU, it loos it n make a new low before final push up or can go up without breaking the recent low in LTFs. All in all the bias is up.

Bear Alert: When the Market Plays Dress-Up!Alright, traders, let’s talk about what’s happening here. This chart? Oh, it’s the drama queen of patterns—the classic Head and Shoulders. It’s the “I’m tired of pretending to go up” signal, and boy, did it deliver. 💔
Let’s break it down (literally):
1️⃣ The Head and Shoulders 🧠💪👖
First, we’ve got the Left Shoulder flexing, then the Head pretending it’s on top of the world 🌍, and finally, the Right Shoulder, which just gave up and said, “Nope, I’m out.”
Once the neckline broke? 🚨 Lights out. It’s game over for the bulls.
2️⃣ The Bear Flag Formation 🚩🐻
After that dramatic neckline drop, we saw a little consolidation—aka the bear flag. It’s like the market paused to catch its breath before diving straight into the abyss. 😱
3️⃣ RSI Drama 📉:
The RSI is down there chilling in the “oversold” lounge, but let’s be honest—oversold in a bear market is like yelling “fire” in a burning building. 🚒 It’s not a bounce until the trend says so.
What’s Next?
💥 TP Incoming:
If you measure the height of the Head and apply it below the neckline, this thing could go even lower. Think of it as the final stage dive. 🎤🎸
💡 For the Shorts:
If you’re already in, congrats—you’re riding this bear like a pro. 🐻
If not, you might want to wait for a dead cat bounce (poor cat 😢) before hopping in.
Final Thoughts:
The market is throwing tantrums, and the Head and Shoulders just served as its resignation letter. Bulls? Pack it up. Bears? 🐻 This is your time.
Remember, no paywalls, no hidden agendas—just raw, unfiltered trades and analysis like this one. If you’re ready to step into the arena, we’re here for it. 🚀
Stay savage, stay relentless, and keep an eye on those charts.

EUR USD Entry Setup EUR USD Entry Setup 1 hour timeframe.
The price has been bouncing from a trendline breaking a previous high and currently retesting it
entry is taken on the retest level.
Do you think EU will buy ?

EURUSD - This might be the one 50:1 RRR!! Hello everyone!
I shared a buy opportunity on FX:EURUSD earlier today that got stopped out unfortunately but I think everything happens for a reason and we managed to get a entry even lower for a better possibility to catch the reversal.
This trade gonna require a lot of mental and patience however my positions are in BE and login deleted on metatrader. Gonna be interesting to see how it plays out.
What do you think?

EUR USD PRICE - NEED TO BALANCE THE LIQUIDITY AT RESISTANCE ZONEHELLO TRADERS have a look of EUR USD price need to BALANCE the
LIQUIDITY which is IMBALANCED ZONE in the up ward direction,we can see that at 4h time frame from the past price in the up ward direction all the LIQUIDITY got FILLED, now its time to break the DOWN TREND LINE after that wait for the pullback then 1st target is 1.09134 nd 2nd target is 1.09952 nd 3rd target is 1.10882 , FOLLOW FORE LIVE CONTENTS

🟢🟢 (EURUSD pullback momentum technical support 💪💡Hello traders what do you think about eurusd) FX:EURUSD
Technical analysis 🟢
EURUSD pullback resistance levels 1.10000 eurusd bullsh momentum technical support Arya 1.07500 breakdown fullback Up long )🟢
Long signals 🟢 FX:EURUSD
Safe trade ❤🙏 pales like ❣️ and comments your support 💪 follow for next analysis 😀

EURUSD going bullish We currently on a retracement after price gave us a new minor HH on the trend.
Looking at placing a buy limit@1.08564.
USD is still facing a declining economy as regards to the PMI today which is a leading indicator.
We going bullish all the way.

EURUSD is ready to go shortThe price movements from 1.0980 are viewed as a corrective pattern for the preceding uptrend. While further upward movement cannot be ruled out, the rally appears to be capped by the break of the 1.0920 level, signaling a potential sell-off towards the target at 1.0768.
Therefore, we are opening a short position to target the mentioned objective as the next goal.

EURUSD Long term short ideas from 1.10500 (or 1.11000)This idea is based on my higher time frame bias that I have marked out from a while back, as we are steadily approaching a key level on the HTF. I'm going to be expecting EU to melt back down towards 1.07500 or lower to fill in major imbalances that have been left from before. In addition to this, we are entering the 0.78 region of the fib range which is a more premium zone to sell.
As of now I will be waiting for price to slow down momentum and start showing some signs of weakness, in order for give us a a better sign that price is ready for a reversal. Ideally I want to wait for the 8hr supply on top of the daily however, if we see our lower time confluence i.e. Wyckoff distribution & CHOCH, I will be then looking to enter and hold on an intra-day basis.
Confluences for long term EURUSD shorts are as follows:
- EU is overall bearish on the higher time frame like the (monthly and weekly)
- This is a pro trend trade that will be following the overall market trend.
- Internal structure is also bearish as we have CHOCH on the higher time frame with a BOS.
- Price is approaching a daily supply zone that has caused a BOS to the downside.
- Price is also entering the 0.78 area of the fibonacci range good sign for a potential reaction.
- Lots of FVGs on the higher time frame below as well as major pools of liquidity points.
- Price has also swept lots of liquidity to the upside and has take out most of trend line Liq.
P.S. Personally, I see price most likely reacting off the 8hr supply above the daily, just because there was a previous consolidation that still holds some liquidity above it. Hence why I will be waiting for that to get swept to mitigate the institutional candle that was left by the 8hr POI.

EURUSD getting weakerWeekly key level around $1.07.
In long term EURUSD buyer seems like not so interested, as the choppy movements showing on H4. Minor resistance is so close between the H4 waves indicates weak buyer, the movements almost flat. Strong movements is when the price move rocketing steep no retracement with small "pause" which SMC trader usually called them as "rally base rally" or RBR. But since the 1st wave after H4 "choch", there is no "RBR" formed in H4 structure. Even inside H4 waves showing price have to build some other smaller waves to keep push the price up. Now it's in 4th waves. If observe carefully, it's build up rising flag pattern which usually the sign of downtrend will continue.
I expecting will massive drop after 5th waves complete. If Euro "want" to still continue upward, then it need strong fundamental data to support it to go beyond key level $1.07.

Top Down Analysis for EURUSD - Q4The multi time frame analysis is in the updates below the main Idea.
Since we have flipped bullish on the higher time frames, I'll give my big picture view on EU. I look at the timeframes like a gearbox or transmission. The H4 is a gear that, on one revolution will turn the H1 gear four times and the H1, in turn will turn the M15 four times and so on all the way down to the micro time frames. I think that having a grip on all of the relevant time frames is good for forecasting. I believe that once we smesh this H4 supply zone we will have a bullish monthly internal trend, a bullish weekly internal trend, a bullish major daily trend and bullish major H4 trend aswell as the H1 and M15 also being bullish. September and Q4 are looking, well... ching ching!
The last time I did a thorough analysis like this it was flagged by Tradingview, sadly due to my shameless plugging! So I will behave!

EUR/USD - (massive!) SHORTThis is the point where this pair becomes a monetary appliance - i.e., a cash machine -, much like a George Foreman Grill; "Just set it and forget it!"
(Here, the levels are accurate enough to be tradeable.) "Just SELL it and forget it!"
It doesn't get any easier than this.

EURUSDI think the euro can go down to the price range of 1 and pull back and then go up for a breakout
