EUR/USD Rejects Resistance: Bears Setting Up the Next Move📊 EUR/USD Chart Analysis
1. Strong Resistance Hit at ~1.1700
The price made a sharp impulsive rally into the 1.1700 zone, which is marked as a major horizontal resistance.
Wicks at the top suggest rejection pressure, meaning buyers struggled to break higher.
---
2. Possible Pullback Structure Forming
The black “M-shape” sketch on your chart suggests the idea of a short-term distribution pattern forming after the rally:
First drop after hitting resistance
Small corrective bounce
Potential continuation downward
This usually signals exhaustion after a strong move.
---
3. First Support Level: 1.1684 – 1.1670
You marked a key support shelf:
This is the first liquidity pool below current price
Price may retest this area after the rejection at resistance
A break below it could trigger momentum toward deeper support
---
4. Deep Support Zone: ~1.1664
Highlighted in red on your chart:
This aligns with the top of the Ichimoku cloud
Also sits near previous consolidation and structure
If price reaches this level, it may act as a strong reaction zone
---
5. Broken Downtrend Line Re-Test
Earlier in the chart, price broke above the diagonal downtrend line.
It's common after such a breakout for the pair to:
Pull back into the broken trendline
Retest it as support
Then resume upward movement
Your current price action looks like it is setting up for such a retest.
---
6. Ichimoku Cloud Context
Price is well above the cloud, showing:
Current momentum is still bullish
Pullbacks are expected but do not invalidate overall strength
Cloud’s angle is turning upward, reinforcing bullish shift.
---
7. “No Sell” Icon Meaning
The chart includes a crossed-out SELL symbol, implying:
Selling immediately after a breakout is risky
Market may still show bullish continuation despite pullbacks
Bears only gain control if support breaks decisively
---
📌 Summary
Based on the chart:
Strong resistance at 1.1700 rejected price
Short-term pullback is likely toward 1.1684 → 1.1670
Major support at 1.1664 may be the deeper target
Trend remains bullish, but retracements are natural
Key decision zone is the support shelf beneath current price
Eurusdsetup

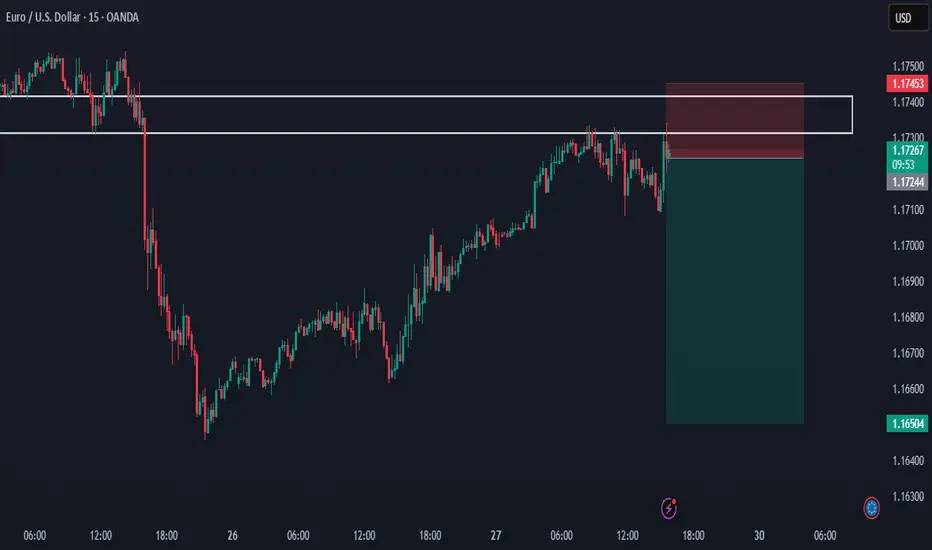
EURUSD BUY SETUP 📊 EURUSD UPDATE — Buy Setup in Focus
EURUSD is holding above a key support zone, and price action suggests bullish continuation if structure remains intact. Buyers are stepping in with controlled risk and clear upside potential.
📌 Trade Levels
🔓 Entry: 1.17233
❌ Stop Loss: 1.16945
🎯 Target: 1.17373
Trade with confirmation, not emotions. Let the market do the work.
⚠️ For educational purposes only. Not financial advice.

EURUSD | 15M TIME FRAME BUY SETUP ANALYSISEURUSD — Trade Setup
📈 Bias: Bullish
🎯 Entry: 1.7100 / 1.7150
🛑 Stop Loss: 1.7000
🎯 Target: 1.7205
📊 Technical Reasoning:
EURUSD is maintaining bullish momentum after holding above a key support zone. The entry area is positioned where buyers are expected to defend price and continue the move higher. The stop loss is placed beyond the invalidation level to manage downside risk, while the target is aligned with a higher liquidity objective and continuation structure.
📌 Execution Plan:
* Buy from the marked entry zone
* Apply disciplined risk management
* Monitor price behavior as it approaches the target
❌ Invalidation:
A clear break and close below 1.7000 would invalidate this bullish setup.
💬 Do you expect continuation toward 1.7205, or consolidation before the next leg up?
⚠️ This analysis is for educational purposes only. Not financial advice.

EURUSD SELL | Idea Trading AnalysisEURUSD is moving on resistance zone
The chart is above the support level, which has already become a reversal point twice.
We expect a decline in the channel after testing the current level.
We expect a decline in the channel after testing the current level
Hello Traders, here is the full analysis.
I think we can soon see more fall from this range! GOOD LUCK! Great SELL opportunity EURUSD
I still did my best and this is the most likely count for me at the moment.
-------------------
Traders, if you liked this idea or if you have your own opinion about it, write in the comments. I will be glad ⚜️

EURUSD_Sell_Idea4h is bearish and now price is in 4h Premium and gives 2 fractal choch
on 15m we see that 15m internal in Bearish
that zone where i am happy to sell ( have inducement below but it there is another double top so i am caution and wait for 15m choch )
Negative confluence : 15m Swing is still bullish and already mitigated to it discount

Range-Bound Trading: Awaiting a ReboundThe market is currently in range - bound trading, waiting for a rebound.
Buy 1.15750 - 1.15800
TP 1.16300 - 1.16500 - 1.16750
Accurate signals updated daily. They serve as a reliable guide for trading issues – feel free to refer to them. Hope they help!

EURUSD before the news On Thursday, the U.S. September jobs data will be released.
This could trigger increased volatility and sharp price movements.
Technically, the outlook remains unchanged. We’re watching closely for a higher low, which would confirm potential for another bullish move.
For buys, the main target remains a break above the previous high.
Don’t rush before the news - wait for clear reasons to enter.

EURUSD Under PressureEURUSD remains under pressure after breaking below 1,1500.
On the upside, key resistance levels are found at 1,1550 and 1,1580.
Watch how the price reacts around these levels to determine the next move.
At current levels, there’s no reason to take aggressive entries.

EURUSD - Looking To Sell Pullbacks In The Short TermH1 - Strong bearish move.
No opposite signs.
Currently it looks like a pullback is happening.
Expecting bearish continuation until the two Fibonacci resistance zones hold.
If you enjoy this idea, don’t forget to LIKE 👍, FOLLOW ✅, SHARE 🙌, and COMMENT ✍! Drop your thoughts and charts below to keep the discussion going. Your support helps keep this content free and reach more people! 🚀
-------------------------------------------------------------------------------------------------------------------

EURUSD before the FED decisionToday, the FED will announce its interest rate decision, followed by a press conference half an hour later.
Expectations point toward a rate cut, but the main focus will be on the tone and guidance for upcoming meetings.
⚠️ Avoid taking unnecessary risks before the news!
Wait for the market reaction and confirmation of the move before entering any trades.

Time for some news!Today at 1:30 PM (London), the U.S. inflation data will be released.
This announcement is highly anticipated and will have a major impact on the markets.
Make sure to manage your risk and avoid opening new positions before the news.
The confirmed opportunities will come after the market reacts.

EURUSD remains unchangedThe market is calm ahead of key U.S. news.
A retest of previous lows is possible before the next move.
Expectations still point to a continuation of the uptrend, but traders should stay cautious about volume and risk ahead of Friday’s data.

Important week for EURUSDOn Friday, the U.S. inflation data will be released, despite the temporary government shutdown.
The results will play a key role in shaping the Federal Reserve’s decision on interest rates next Wednesday.
These two events are expected to drive the market for the rest of the month.
The trend remains bullish, but a short-term correction may occur before the next upward move.

EUR/USD Made Clear Reversal Pattern,Long Setup To Get 200 Pips !Here is my 4H Chart On EUR/USD , The price creating a very clear reversal pattern ( Double Bottom pattern ) and the price made a very good bullish price action now and the price above my neckline. so we can enter a buy trade right now and targeting from 50 to 100 pips with a decent stop loss , if we have a 4H Closure below neckline this idea will not be valid anymore.
Reasons To Enter :
1- Perfect Touch For The Area .
2- Clear Bullish Price Action .
3- Bigger T.F Giving Good Bullish P.A .
4- Reversal Pattern Confirmed By Closing Above Neckline .
5- Perfect 15 Mins Closure .
6- Clear Reversal Pattern .

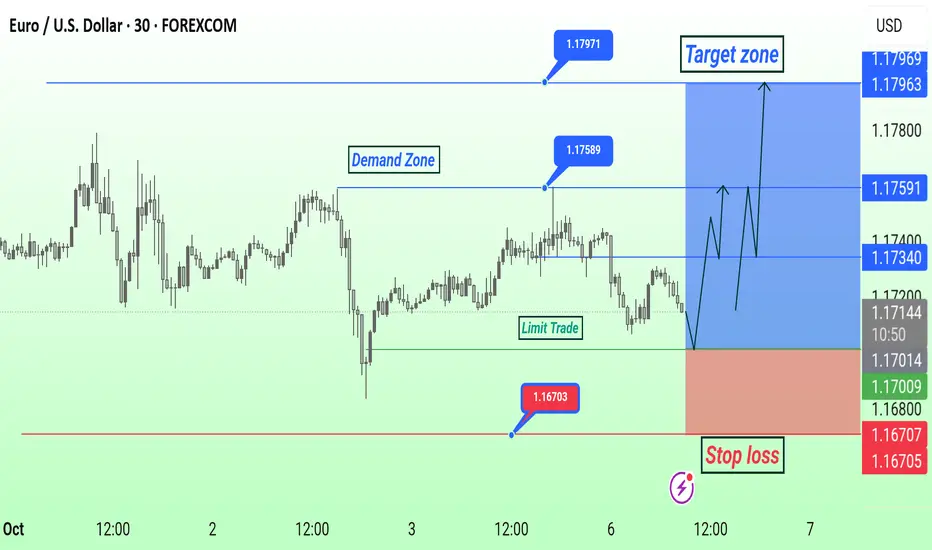
EUR/USD bullish setupEUR/USD is forming a bullish setup. Price is expected to retrace to the demand zone near 1.1650–1.1660 before moving upward toward the target zone at 1.1712–1.1743. Stop loss is set below 1.1609.

EUR/USD 4HR Trendline Breakout. Daily Continuation.I will be taking a long trade looking for further upside.
Trade management will be trailing stop loss below 4HR lows when I feel appropriate to do so based on my discretion.
Simple effective trading.

EURUSD - Looking To Sell Pullbacks In The Short TermH4 - Strong bearish move.
No opposite signs.
Currently it looks like a pullback is happening.
Expecting bearish continuation until the two Fibonacci resistance zones hold.
If you enjoy this idea, don’t forget to LIKE 👍, FOLLOW ✅, SHARE 🙌, and COMMENT ✍! Drop your thoughts and charts below to keep the discussion going. Your support helps keep this content free and reach more people! 🚀
-------------------------------------------------------------------------------------------------------------------

EURUSD retracement continuesYesterday, EURUSD failed to form a higher low and extended its correction.
The next key support levels are 1,1593 and 1,1506.
Watch for a reaction around these support zones and potential buying opportunities.
Current levels are not suitable for aggressive entries!

EUR/USD Bullish Setup EUR/USD 30M Analysis:
Price is approaching the demand zone for a potential buy entry around 1.1700.
Stop loss: 1.1670
Target zone: 1.1759 – 1.1796
Setup suggests a bullish reversal from the demand area toward upper resistance levels.
EUR/USD – Short Setup After Retracement to Resistance ZoneChart Context
Pair: EUR/USD
Timeframe: 4H
Current Price: 1.1713
Trend Channel: Ascending parallel channel (light pink/blue zone).
Structure: Price is consolidating mid-channel after a previous bullish leg.
Setup Summary
Entry Zone: Around 1.1860 – 1.1866
Stop Loss: Around 1.1955 – 1.1957
Target Zone: Around 1.1368 – 1.1377
Risk-Reward Ratio: Roughly 1 : 4.5
Technical Breakdown
Price Action:
The pair is currently consolidating near the midpoint of an ascending channel.
The chart suggests an expected bullish retracement to the upper channel boundary (1.1860–1.1950) before reversing lower.
Pattern:
The setup forms a bearish correctional structure — a potential rising wedge / channel top.
The projection shows a short (sell) setup after the retracement to the resistance area.
Key Zones:
Resistance / Sell Zone: 1.1860 – 1.1950
(Coincides with previous swing highs + upper channel boundary)
Support / Take Profit Zone: 1.1368 – 1.1377
(Matches previous structural low support)
Momentum View:
The sideways action indicates weak bullish momentum, possibly preparing for a downside breakout.
If price rejects near 1.1860 with bearish confirmation (e.g., engulfing candle or divergence), a drop toward 1.14 and 1.1360 becomes likely.
Trading Outlook
📉 Bias: Bearish setup (short after retracement)
🎯 Target: 1.1368
⛔ Stop Loss: 1.1955
⚖️ Risk/Reward: Strong, ~1:4.5
🕒 Confirmation Needed: Wait for rejection signals near 1.1860–1.1950 zone before entry.

No change in EURUSDThe EURUSD movement remains in line with the expected scenario.
It is holding above 1,1700, and we continue to watch for the formation of a higher low.
Such a setup would confirm buying opportunities and the potential resumption of the uptrend.
The main focus remains on Friday’s NFP release, which could trigger stronger moves.

A short setup based on previous HTF analysisHello traders!
We’re selling EURUSD here.
You can check the higher timeframe analysis in the related article.
Manage your risk and trade safe!
Support levels on EURUSDEURUSD bounced off 1,1817 and continues its correction.
These are the resistance levels formed after last week’s news.
We’re now watching the support zone for a reaction and a potential new move higher.
All positions remain strictly in the direction of the trend!
