EURUSD H1 | Bearish Reaction Off Pullback ResistanceMomentum: Bearish
Price is currently below the ichimoku cloud.
Sell entry: 1.18866
- Pullback resistance
- 61.8% Fib retracement
Stop Loss: 1.19225
- Multi-swing high resistance
Take Profit: 1.18359
- Overlap support
High Risk Investment Warning
Stratos Markets Limited (fxcm.com/uk), Stratos Europe Ltd (fxcm.com/eu):
CFDs are complex instruments and come with a high risk of losing money rapidly due to leverage. 69% of retail investor accounts lose money when trading CFDs with this provider. You should consider whether you understand how CFDs work and whether you can afford to take the high risk of losing your money.
Stratos Global LLC (fxcm.com/en): Losses can exceed deposits.
Please be advised that the information presented on TradingView is provided to FXCM (‘Company’, ‘we’) by a third-party provider (‘TFA Global Pte Ltd’). Please be reminded that you are solely responsible for the trading decisions on your account. Any information and/or content is intended entirely for research, educational and informational purposes only and does not constitute investment or consultation advice or investment strategy. The information is not tailored to the investment needs of any specific person and therefore does not involve a consideration of any of the investment objectives, financial situation or needs of any viewer that may receive it. Past performance is not a reliable indicator of future results. Actual results may differ materially from those anticipated in forward-looking or past performance statements. We assume no liability as to the accuracy or completeness of any of the information and/or content provided herein and the Company cannot be held responsible for any omission, mistake nor for any loss or damage including without limitation to any loss of profit which may arise from reliance on any information supplied by TFA Global Pte Ltd.
Stratos Trading Pty. Limited (fxcm.com/au):
Trading FX/CFDs carries significant risks. FXCM AU (AFSL 309763), please read the Financial Services Guide, Product Disclosure Statement, Target Market Determination and Terms of Business at fxcm.com/au
Eurusdshort

EURUSD H1 | Bearish Reaction Off Key ResistanceMomentum: Bearish
Price is currently below the ichimoku cloud.
Sell entry: 1.19093
- Pullback resistance
- 78.6% Fib retracement
- Fair value gap
Stop Loss: 1.19310
- Swing high resistance
Take Profit: 1.18726
- Swing low support
High Risk Investment Warning
Stratos Markets Limited (fxcm.com/uk), Stratos Europe Ltd (fxcm.com/eu):
CFDs are complex instruments and come with a high risk of losing money rapidly due to leverage. 69% of retail investor accounts lose money when trading CFDs with this provider. You should consider whether you understand how CFDs work and whether you can afford to take the high risk of losing your money.
Stratos Global LLC (fxcm.com/en): Losses can exceed deposits.
Please be advised that the information presented on TradingView is provided to FXCM (‘Company’, ‘we’) by a third-party provider (‘TFA Global Pte Ltd’). Please be reminded that you are solely responsible for the trading decisions on your account. Any information and/or content is intended entirely for research, educational and informational purposes only and does not constitute investment or consultation advice or investment strategy. The information is not tailored to the investment needs of any specific person and therefore does not involve a consideration of any of the investment objectives, financial situation or needs of any viewer that may receive it. Past performance is not a reliable indicator of future results. Actual results may differ materially from those anticipated in forward-looking or past performance statements. We assume no liability as to the accuracy or completeness of any of the information and/or content provided herein and the Company cannot be held responsible for any omission, mistake nor for any loss or damage including without limitation to any loss of profit which may arise from reliance on any information supplied by TFA Global Pte Ltd.
Stratos Trading Pty. Limited (fxcm.com/au):
Trading FX/CFDs carries significant risks. FXCM AU (AFSL 309763), please read the Financial Services Guide, Product Disclosure Statement, Target Market Determination and Terms of Business at fxcm.com/au

EURUSD 1HOUR PRICE OUTLOOK|SHORT|SELLI'm considering this trade as a EURUSD Retracement before going for higher positions,
it's worth taking,
it's about 70+ pips, if the trade succeeds.

EURUSD H4 | Bearish Reaction Off Pullback ResistanceMomentum: Bearish
Price is currently below the ichimoku cloud.
Sell entry: 1.18502
- Pullback resistance
- 23.6% Fib retracement
- 38.2% Fib retracement
Stop Loss: 1.19153
- Overlap resistance
Take Profit: 1.17769
- Swing low support
High Risk Investment Warning
Stratos Markets Limited (fxcm.com/uk), Stratos Europe Ltd (fxcm.com/eu):
CFDs are complex instruments and come with a high risk of losing money rapidly due to leverage. 69% of retail investor accounts lose money when trading CFDs with this provider. You should consider whether you understand how CFDs work and whether you can afford to take the high risk of losing your money.
Stratos Global LLC (fxcm.com/en): Losses can exceed deposits.
Please be advised that the information presented on TradingView is provided to FXCM (‘Company’, ‘we’) by a third-party provider (‘TFA Global Pte Ltd’). Please be reminded that you are solely responsible for the trading decisions on your account. Any information and/or content is intended entirely for research, educational and informational purposes only and does not constitute investment or consultation advice or investment strategy. The information is not tailored to the investment needs of any specific person and therefore does not involve a consideration of any of the investment objectives, financial situation or needs of any viewer that may receive it. Past performance is not a reliable indicator of future results. Actual results may differ materially from those anticipated in forward-looking or past performance statements. We assume no liability as to the accuracy or completeness of any of the information and/or content provided herein and the Company cannot be held responsible for any omission, mistake nor for any loss or damage including without limitation to any loss of profit which may arise from reliance on any information supplied by TFA Global Pte Ltd.
Stratos Trading Pty. Limited (fxcm.com/au):
Trading FX/CFDs carries significant risks. FXCM AU (AFSL 309763), please read the Financial Services Guide, Product Disclosure Statement, Target Market Determination and Terms of Business at fxcm.com/au

EUR/USD – H1 - Fundamental Pressure Takes Control 📝 Description🔍 Setup (Fundamental + Technical) FX:EURUSD
EUR/USD has lost bullish structure after breaking below the rising trendline and confirming a bearish retest. Price is also trading below the Ichimoku cloud, with a bearish cloud crossover, signaling trend weakness.
📉 Fundamental catalyst:
1.Announcement of a new Fed Chair and political agreement to avoid a U.S. government shutdown
2. This reduces uncertainty and supports USD strength, pressuring EUR/USD lower
📍 Support & Resistance
🟨 Resistance Zone: 1.1980 – 1.2030
🟥 1st Support: 1.1715
🟥 2nd Support: 1.1620
Volume profile shows thin demand below, favoring continuation
#EURUSD #ForexTrading #FundamentalAnalysis #TrendlineBreak #BearishBias #USDStrength #PriceAction #TradingView #Kabhi_TA_Trading
⚠️ Disclaimer
This analysis is for educational purposes only.
Trading involves risk — always use proper risk management and trade with confirmation.
💬 Support the Idea👍 Like if you see EUR/USD heading lower
💬 Comment: Sell the retest or wait for breakdown continuation?
🔁 Share with traders watching USD fundamentals

EUR/USD – Trendline Breakdown| Deeper Pullback Incoming?EUR/USD previously showed strong bullish momentum , but price is now losing strength after the breakout and has broken below the rising trendline. This shift suggests a potential corrective move toward lower key demand zones before the next major decision.
🔍 Technical Breakdown
📈 Previous bullish breakout into premium supply zone
❌ Trendline breakdown confirms momentum weakness
🔁 Failed continuation near highs → sellers stepping in
🔻 Downside targets aligned with:
First Key Support Zone (intraday demand)
Major Lower Demand Zone (structure support)
Bias remains bearish short-term unless price reclaims the trendline.
✅Psychological Discipline:
1️⃣Stick to plan – No Revenge Trades.
2️⃣Accept losing trades as part of the strategy.
3️⃣Risk only 1–2% of your account balance per trade.
✅ Support this analysis with a
LIKE 👍 | COMMENT 💬 | FOLLOW 🔔
It helps a lot & keeps the ideas coming!
⚠️ Disclaimer: This analysis is for educational purposes only and does not constitute financial advice. Forex trading involves high risk. Trade only with capital you can afford to lose and always do your own research.

EUR/USD Ready To Go Down , Are You Ready For 150 Pips ?Here is my 1H Chart on EUR /USD and it`s The Same GBP/USD , We Have A Fake Breakout and then the price Back below my old res and we have a very good bearish Price Action on 1 And 2 Hours T.F Also the price playing very good around my res and i`m waiting the price to retest the broken area and giving a good bearish price action For the second time on smaller time frames to can get a confirmation to enter , So i see it`s a good chance to sell this pair if it go up a little to retest the broken area and then we can sell it and targeting 100 to 150 pips . and if we have a daily closure again above my new res then this idea will not be valid anymore .
Reasons To Enter :
1- Perfect Breakout .
2- Clear Bearish Price Action .
3- Bigger T.F Giving Good Bearish P.A .
4 - Perfect 15 Mins Closure .
5- The Price Respect The Res Again .

EUR/USD - H4 Weekly Outlook - Breakout Loading ?📝 Description 🔍 Market Structure
EUR/USD remains in a strong H4 uptrend, supported by a rising trend OANDA:EURUSD line and higher-high / higher-low structure. Price is currently compressing below a key resistance zone, suggesting a breakout or pullback scenario is loading.
🔴Trendline support respected multiple times
🔴Price holding above key moving averages
🔴Momentum slowing near resistance → decision zone
📍 Key Support & Resistance
🟢 Resistance Zone: 1.1760 – 1.1800
(June & September highs in focus)
🔴 1st Support: 1.1600 – 1.1580
🔴 2nd Support: 1.1540 – 1.1520
#EURUSD #ForexTrading #WeeklyOutlook #BreakoutSetup #PriceAction #SupportResistance #TradingView #Kabhi_TA_Trading
⚠️ Disclaimer
This analysis is for educational purposes only.
Forex trading involves risk — always manage position size and use a stop-loss.
💬 Support & Engagement👍 Like if you’re waiting for the breakout
💬 Comment: Breakout or Pullback first?
🔁 Share with traders watching EUR/USD

Short term sellEURUSD broke below a 15min support/resistance level.
entry: 1.16905
SL: 1.16936
Partial TP: 1.16830
Final TP: 1.16726

EURUSD SHORT IDEAbullish trend, and finally the price in my opinion will want another peak up, since there is still no bearish divergence for the beginning of the correction of the last leg up by 1x. There are definitely two peaks that were broken with great momentum (marked in blue), that is, a liquidity void. Before that, the price supposedly started to make some correction down, but then they pumped up. It is logical for me that the price will return down, with the first target being 1.16455 by 15m, and then it will show whether it wants a deeper correction by 1x 😊 + there is a absorption of the last bullish bar up, so I think a new peak and then a continuation down 😊

EURUSD – Daily Timeframe (SELL Setup)Market Structure Analysis
EURUSD is currently showing bearish price action on the Daily timeframe. After failing to sustain above the recent swing high, price has formed a lower high and is now moving downward, indicating ongoing selling pressure. Momentum remains weak, and buyers are struggling to regain control.
Key Resistance Zone
Resistance: 1.1700 – 1.1750
This zone previously acted as a strong rejection area. Price was rejected from this level and resumed bearish movement, confirming it as a valid resistance.
Key Support Zones
Support 1: 1.1600 – 1.1580
Support 2: 1.1500 – 1.1480
These levels are important demand zones where partial profit booking is expected.
Trade Plan (SELL Setup)
Entry (SELL): Around 1.1650 – 1.1670 (pullback preferred)
Stop Loss (SL): 1.1760
(Above the resistance and recent swing high for safety)
Take Profit 1 (TP1): 1.1580
Take Profit 2 (TP2): 1.1480
Confirmation Notes
Daily candle structure favors sellers
RSI is below strong bullish territory, indicating weak buying momentum
Trend bias remains bearish below 1.1700
Bias: Bearish
Risk Management: Use proper lot size and manage risk accordingly
This setup is suitable for swing traders and aligns well with disciplined, professional trading strategies.

Fundamental Market Analysis for January 16, 2026 EURUSDEUR/USD on Friday, January 16, 2026, is trading near 1.16100, but the single currency’s position remains fragile. The US dollar is supported by strong US data and fading expectations of near-term policy easing: the market is increasingly pricing in a longer period of high rates, which keeps demand for the dollar steady from investors and companies hedging currency risks.
The backdrop for the euro is mixed. The European Central Bank emphasizes its readiness to keep rates at current levels as long as inflation stays close to target and no new shocks emerge. At the same time, a stronger dollar and competition in external markets weigh on the region’s export outlook, while talk of possible turbulence in global markets periodically brings back interest in the dollar as a safe-haven currency.
Over the day, the key driver remains US releases and commentary: any signs that inflation pressure is holding up will work against EUR/USD. The euro could find support if euro area data improves confidence in sustainable growth, but in the base case market participants remain inclined to hold dollars, increasing the likelihood of a moderate decline in the pair.
Trading recommendation: SELL 1.16150, SL 1.16350, TP 1.15250

[CRT]Weekly outlook -> EURUSD & GBPUSD (week of January 12)After a bearish week and to everyone’s surprise considering it was NFP week, leaving one of the targets uncompleted (specifically the two-week timeframe one), and in order not to lose track of last week’s CRT analysis , we already have direction for the start of this week:
Biweekly timeframe chart for FX:EURUSD
Here we have two targets for Monday or Tuesday:
The low of Friday, January 9 of this year
The low of Thursday, December 9, 2025
But before going into more intraday trading details, let’s analyze higher timeframes from a broader perspective:
Yearly timeframe chart for FX:EURUSD
As we already concluded last week when analyzing the yearly close , our target is the wick of the 2025 high, but that does not mean price will head there in a straight line right at the start of the year.
Let’s now move down to the semiannual chart. This time we will look at euro futures CME:6E1! because the semiannual close is very close to the high of the first six months of 2025, and the picture may change depending on whether the second semester actually closes inside or not for our analysis:
Semiannual timeframe chart for EURUSD futures CME:6E1!
And indeed, it closes inside the range, so we have a first possible reversal point at the low of the second semester of the year, which happens to be August 1, 2025:
Daily timeframe chart for EURUSD futures CME:6E1!
We all agree that this target is still very far away , but it never hurts to keep it in mind to see whether it aligns with lower timeframe targets .
Let’s remember that last week we were considering the possibility of a monthly failure swing, speculating that price was already ready to move lower without the need to take December’s high , and it seems we were right, so we also mark December’s low as a target:
Daily timeframe chart of FX:EURUSD
If we take a look at DXY, we also confirm targets and direction for the upcoming week:
Monthly chart of TVC:DXY
Let’s now bring things down to what we can expect for this week, which I expect to be another bearish one:
For me to confidently enter short positions, I would expect price to take the high left by NFP, because that is where the most important movements occurred and it also coincides exactly with Friday’s PO3 zone:
4h timeframe chart of FX:EURUSD
Why those highs and not the high of the next 4h candle?
Because even though the trend is bearish and bullish ranges usually do not complete, those highs are where the “most relevant” movement took place (even though it was a rather weak NFP), and that is where price is more likely to be attracted.
Before finishing, let’s take a quick look at the British pound:
Weekly timeframe chart of the FX:GBPUSD
The pound last week activated a bearish weekly range from which the internal target has already been taken, but the external one is still pending, which—if we are not wrong on FX:EURUSD — FX:GBPUSD should also complete.
So my sell zone is more or less the same as for FX:EURUSD , but with a small nuance:
4h timeframe chart of the FX:GBPUSD
FX:GBPUSD , by liquidating the high generated by NFP, is also liquidating Friday’s high, so if price reaches this zone, there will be more confluences for bearish continuation than on its European cousin $FX:EURUSD.
And that’s it for my weekly projection for this week. I hope it was useful and, above all, don’t forget to like the post and follow me if you want to support this type of content!
Have a great start to the week everyone and many profits!
EUR/USD 2026: Why the Dollar Dominates Despite Global UnrestThe EUR/USD pair entered January 2026 under significant pressure. The U.S. dollar recently hit a three-week high against the euro. While geopolitical headlines scream of regime change in South America, the market remains cold. Investors are ignoring the noise to focus on iron-clad economic fundamentals. Current price action near $1.1704 reflects a clear preference for U.S. assets.
Geostrategy: The Venezuela Pivot and Risk Primacy
Geopolitics took center stage on January 3 with Operation Absolute Resolve in Venezuela. The capture of President Maduro signaled a shift in Washington’s geostrategy. Analysts initially feared a "safe-haven" stampede. However, the currency markets remained remarkably stable.
Traders now view this move as a reassertion of the Monroe Doctrine. The U.S. is securing its own hemisphere while becoming more transactional elsewhere. This strategic focus reduces long-term energy risks for the American economy. Consequently, the dollar’s "exorbitant privilege" remains unchallenged by recent kinetic actions in Latin America.
Macroeconomics: The Growth Divergence Gap
The underlying economics favor a stronger dollar throughout early 2026. The U.S. economy projects a 1.9% growth rate. Meanwhile, the Eurozone stumbles at just 1.1% [/b. This divergence stems from sticky inflation and differing fiscal capacities.
While the Federal Reserve maintains a cautious stance, the European Central Bank (ECB) faces stagnation. High energy costs continue to haunt German industry. Markets now price in fewer U.S. rate cuts than previously expected. This interest rate differential acts as a gravity well for global capital.
Leadership: The Fed’s High-Stakes Regime Change
Management and leadership at the Federal Reserve are currently under the microscope. Jerome Powell’s term concludes in May 2026. President Trump has signaled a preference for a more "pro-growth" successor. Speculation surrounds candidates like Kevin Hassett or Christopher Waller.
A leadership shift toward looser policy could theoretically weaken the dollar. However, the market currently bets on institutional continuity. Investors trust the Fed’s mandate to protect the dollar’s purchasing power. This "credibility premium" keeps the greenback resilient against a fragmented European political landscape.
High-Tech and Patents: The Innovation Deficit
A deep-dive patent analysis reveals a widening chasm between the two regions. The U.S. leads in high-tech sectors like AI and quantum computing. European innovation remains fragmented across national borders. In 2025, the U.S. outpaced the EU in AI-related patent filings by nearly 3 to 1 .
* R&D Spend: The U.S. invests roughly 3.5% of GDP into R&D.
* Venture Capital: U.S. fund sizes dwarf European counterparts by double.
* Business Model: The EU’s "precautionary principle" slows high-tech adoption.
Europe’s "middle-technology trap" limits its productivity growth. Without a unified capital markets union, the Eurozone cannot fund the next technological revolution. This structural weakness creates a long-term bearish outlook for the euro.
Technology and Cyber: Securing the Digital Dollar
Cybersecurity and financial technology also play a pivotal role. The U.S. is rapidly integrating AI into its demand forecasting and logistics. These "high-tech" efficiencies lower the cost of doing business. Furthermore, the U.S. leads in developing secure, digital-first financial architectures.
European firms struggle with high regulatory hurdles like the AI Act. While these laws protect privacy, they often stifle rapid scientific advancement. Consequently, global investors view the U.S. as a safer, more innovative harbor for digital capital.
Market Outlook: January 7 and Beyond
All eyes now turn to the mingling U.S. manufacturing data and non-farm payrolls. These indicators will confirm if the U.S. "A-pillars" of growth remain intact. If data stays firm, the EUR/USD may test support at $1.1650 . The dollar's dominance is not just a trend; it is a structural reality.

EURUSD: Bearish Drop to 1.146?FX:EURUSD is eyeing a bearish reversal on the 4-hour chart , with price approaching a key resistance zone near recent highs, converging with a downward trendline touch and a potential entry area that could trigger downside momentum if sellers defend against further upside. This setup suggests a pullback opportunity amid the ongoing rally, targeting lower support levels with approximately 1:3 risk-reward .🔥
Entry between 1.176–1.180 for a short position. Target at 1.146 . Set a stop loss at a daily close above 1.187 , yielding a risk-reward ratio of approximately 1:3 . Monitor for confirmation via a bearish candle close below entry with rising volume, leveraging the pair's volatility near resistance.🌟
Fundamentally , EURUSD is trading around 1.178 in late December 2025, with a quiet week ahead due to holiday-thin markets, but key US Dollar events could influence direction. For the US Dollar, Tuesday December 30 at 8:30 AM ET brings GDP Growth Rate Q3 Third Estimate (forecast 3.2%), where upward revisions could strengthen USD. Followed by CB Consumer Confidence DEC at 10:00 AM ET (forecast 91), with stronger sentiment potentially bolstering USD. For the Euro, no major high-impact releases this week, leaving the pair sensitive to USD catalysts amid low volume from New Year transitions. 💡
📝 Trade Setup
🎯 Entry (Short):
1.1760 – 1.1800
(Entry within this zone is valid with proper risk & capital management.)
🎯 Target:
• 1.1460
❌ Stop Loss:
• Daily close above 1.1870
⚖️ Risk-to-Reward:
• ~ 1:3
💡 Your view?
Does EURUSD reject the 1.18 zone and roll over toward 1.1460 — or will thin liquidity fuel another squeeze higher first? 👇

EUR/USD: Sellers Defending Value — Breakdown or Continuation HigEUR/USD is showing clear seller presence after a strong rejection at the HVN, confirming that this area remains a key supply zone.
However, price is still holding above the dynamic support, suggesting that the next move will be decided by whether this level breaks or attracts fresh buyers.
📊 What the chart is telling us:
HVN rejection → sellers active at value
A break below the support area could trigger strong momentum toward 1.1540
👉 What’s your take — support breakdown and continuation lower, or buyers step in for another push higher?
Based on:
- Fundamental analysis
- HVN & Volume Profile levels
- Quantitative analysis

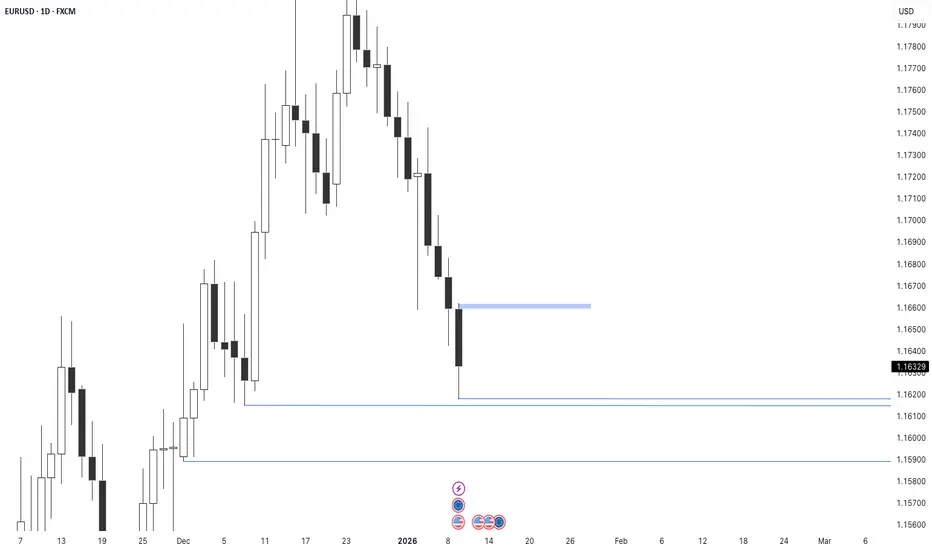
EUR/USD Rejects Resistance: Bears Setting Up the Next Move📊 EUR/USD Chart Analysis
1. Strong Resistance Hit at ~1.1700
The price made a sharp impulsive rally into the 1.1700 zone, which is marked as a major horizontal resistance.
Wicks at the top suggest rejection pressure, meaning buyers struggled to break higher.
---
2. Possible Pullback Structure Forming
The black “M-shape” sketch on your chart suggests the idea of a short-term distribution pattern forming after the rally:
First drop after hitting resistance
Small corrective bounce
Potential continuation downward
This usually signals exhaustion after a strong move.
---
3. First Support Level: 1.1684 – 1.1670
You marked a key support shelf:
This is the first liquidity pool below current price
Price may retest this area after the rejection at resistance
A break below it could trigger momentum toward deeper support
---
4. Deep Support Zone: ~1.1664
Highlighted in red on your chart:
This aligns with the top of the Ichimoku cloud
Also sits near previous consolidation and structure
If price reaches this level, it may act as a strong reaction zone
---
5. Broken Downtrend Line Re-Test
Earlier in the chart, price broke above the diagonal downtrend line.
It's common after such a breakout for the pair to:
Pull back into the broken trendline
Retest it as support
Then resume upward movement
Your current price action looks like it is setting up for such a retest.
---
6. Ichimoku Cloud Context
Price is well above the cloud, showing:
Current momentum is still bullish
Pullbacks are expected but do not invalidate overall strength
Cloud’s angle is turning upward, reinforcing bullish shift.
---
7. “No Sell” Icon Meaning
The chart includes a crossed-out SELL symbol, implying:
Selling immediately after a breakout is risky
Market may still show bullish continuation despite pullbacks
Bears only gain control if support breaks decisively
---
📌 Summary
Based on the chart:
Strong resistance at 1.1700 rejected price
Short-term pullback is likely toward 1.1684 → 1.1670
Major support at 1.1664 may be the deeper target
Trend remains bullish, but retracements are natural
Key decision zone is the support shelf beneath current price

EURUSD Price Action Entry | Failure Setup After NewsI did an analysis on the EURUSD expectation just before the news. We saw the noise as expected, now we have been presented with a cleaner price action which presented us with a failure entry.
Failure Setup Criteria:
Break of the Previous High (LPH)
Lack of Follow-Through after the break
Bearish close below a Momentum Low (ML) bar
✅ Short trade triggered
This type of price action failure trade offers high-probability entries for traders who have the patience and discipline to wait for confirmation rather than chasing impulsive moves.
If you found this analysis helpful, hit the boost and follow for more forex market education and analysis

EURUSD – 1-Hour Timeframe Tradertilki AnalysisMy friends, good morning,
I have prepared an EURUSD analysis for you on the 1-hour timeframe.
My friends, if EURUSD reaches the positive levels between 1.16418 and 1.16216, I will open a buy position and target the 1.17075 level.
Additionally, buy opportunities may also come from the 1.16604-1.16542 levels, but for me, the most suitable positive buy zone is between 1.16418 and 1.16216.
My friends, I share these analyses thanks to each like I receive from you. Your likes increase my motivation and encourage me to support you in this way.🙏✨
Thank you to all my friends who support me with their likes.❤️

EURUSD Sell Setup: Rejection at Resistance, Potential DowntrendEUR/USD is encountering strong resistance near the swing high. After a break of structure (BOS) and change of character (ChOCH), a reversal seems likely. Price action shows slowing momentum at this resistance zone, which suggests a potential decline towards the demand zone. Sellers should look for confirmation of rejection at this level, such as a bearish candle formation or a failed attempt to break the resistance. A successful rejection could trigger a short position targeting lower support areas. Watch for price to test the demand zone for further signs of a continued downtrend.

EURUSD_Sell_Idea4h is bearish and now price is in 4h Premium and gives 2 fractal choch
on 15m we see that 15m internal in Bearish
that zone where i am happy to sell ( have inducement below but it there is another double top so i am caution and wait for 15m choch )
Negative confluence : 15m Swing is still bullish and already mitigated to it discount

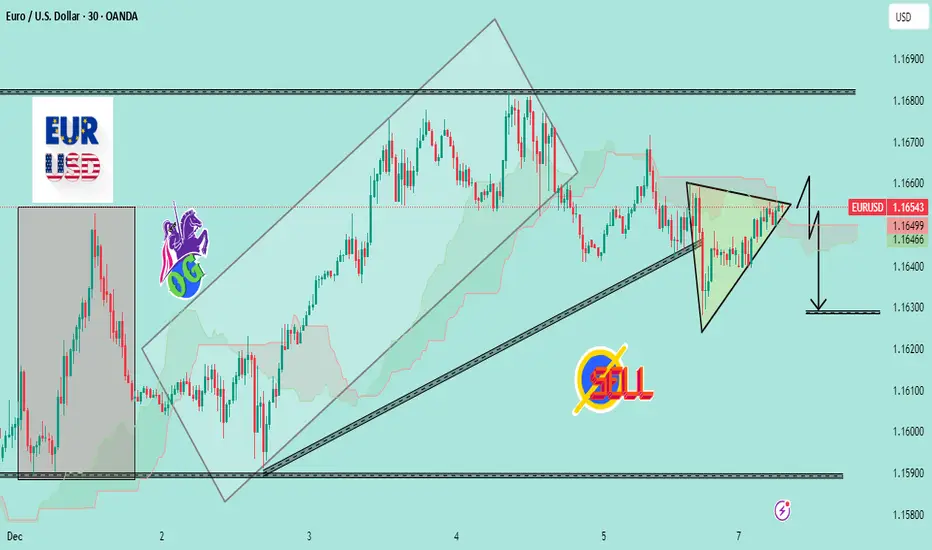
EURUSD Coiling for Breakdown — Triangle Ready to Crack📉 EURUSD Analysis — Bearish Breakout Setting Up
EURUSD is trading inside a tight symmetrical triangle after breaking its previous ascending channel. Price is compressing right under the Ichimoku cloud, showing weak buying momentum.
The structure suggests a bearish continuation:
The uptrend channel is already broken, shifting market bias from bullish to neutral–bearish.
Price is repeatedly getting rejected at the triangle’s upper boundary — showing sellers defending the level.
The cloud is flat and thin, signaling lack of bullish strength.
A clean break below the triangle support should trigger downside continuation toward the next demand level.
📌 Bearish Trigger
A breakout below 1.1640 with momentum confirms the sell.
🎯 Downside Target
TP: 1.1630 zone (marked on chart)
⚠ Invalid Setup
If price breaks above the triangle and closes inside the previous range, the bearish setup weakens
Short eurusd I'm looking forward to selling eurusd with the high of the candle with Fvg as my stop loss. Risk to reward is at least 1:3. All the best
