EUR/USD Mean Reversion Opportunity | Bearish Bias🎯 EUR/USD "THE FIBER" - BEARISH HEIST SETUP | Day Trade Alert 💰
📊 ASSET BREAKDOWN
Pair: EUR/USD (Euro/US Dollar) - "The Fiber" 🌍💵
Market: Forex | Major Currency Pair
Session Focus: European + US Overlap (High Liquidity Zone)
Trade Style: Day Trade Setup - Bearish Bias 🐻📉
🎯 TRADE PLAN - THE HEIST BLUEPRINT
🔴 Entry Strategy
Entry Zone: Any Current Price Level (Market Execution Preferred)
Bias: Bearish Momentum Expected
🎁 Target Zone - "THE VAULT"
TP Level: 1.17500 🏦💎
Reasoning: Moving Average acting as police barricade 🚧 = Strong Support + Oversold Conditions + Bull Trap Formation + Technical Correction Zone = Escape Route with Profits! 💸
⚠️ Note for Thief OG's: This TP is MY level, not financial advice. You make YOUR money, you take YOUR money at YOUR risk. Your bag, your rules! 🎒✨
🛑 Stop Loss - "THE EMERGENCY EXIT"
SL Level: 1.18200 🚨
Thief's Insurance Policy - Protect your capital, protect your craft!
⚠️ Note for Thief OG's: This SL is MY safety net. Trade smart, not hard. Your risk tolerance = your decision. Don't let the market rob YOU! 🏃♂️💨
🔗 CORRELATED PAIRS TO WATCH - THE CREW 👀
💵 USD Pairs (Dollar Strength Plays)
GBP/USD (Cable) - Watch for USD strength confirmation
USD/JPY (The Gopher) - Risk-on/Risk-off sentiment gauge
USD/CHF (The Swissie) - Safe-haven flow indicator
AUD/USD (The Aussie) - Commodity currency correlation
NZD/USD (The Kiwi) - Risk appetite barometer
🌍 EUR Cross Pairs (Euro Weakness Plays)
EUR/GBP - European currency dynamics
EUR/JPY - Euro risk sentiment
EUR/CHF - Regional strength comparison
📈 Key Correlation Points:
DXY (US Dollar Index) ⬆️ = EUR/USD ⬇️ (Inverse correlation)
If USD pairs rally together → Strong dollar environment = EUR/USD bearish ✅
If EUR crosses weaken → Euro weakness = Support for bearish setup ✅
📰 FUNDAMENTAL & ECONOMIC FACTORS - THE INTEL 🕵️♂️
🇺🇸 US Economic Factors (USD Bullish Drivers)
Federal Reserve Policy: Hawkish stance + higher-for-longer rates narrative 📈
US Economic Data: Strong employment data (NFP) + resilient GDP growth
Inflation Watch: Core PCE, CPI data influencing Fed decisions
Treasury Yields: Rising 10Y yields = USD demand ⬆️
🇪🇺 Eurozone Economic Factors (EUR Bearish Risks)
ECB Policy Divergence: Potential rate cut discussions vs Fed hawkishness
Economic Growth: Sluggish German manufacturing + EU recession concerns
Energy Prices: European energy dependency = economic headwind
Political Uncertainty: EU fiscal policy debates
📅 UPCOMING NEWS TO WATCH ⏰
US NFP (Non-Farm Payrolls) - Major USD volatility event
FOMC Minutes/Speeches - Fed policy direction clues
ECB Press Conference - Euro rate path guidance
US CPI/PPI Reports - Inflation trajectory data
EU PMI Data - Economic health indicators
Retail Sales (US & EU) - Consumer strength metrics
🎲 Risk Events:
Geopolitical tensions affecting EUR sentiment
Central bank surprise announcements
Energy market shocks impacting Eurozone
🎭 THIEF TRADER STYLE - MOTIVATION VAULT 💪
"The market doesn't reward the greedy; it rewards the patient thief who knows when to strike." 🦊💰
"Bulls make money, bears make money, pigs get slaughtered—but THIEVES? We take what the market gives and vanish into profit!" 🏃♂️💨✨
"Every trade is a heist. Plan your entry, execute flawlessly, and escape with the bag before the market knows you were there." 🎯🎒
"Stop losses aren't losses—they're the cost of doing business in the greatest casino on Earth. Protect your capital like it's the Crown Jewels!" 👑🛡️
"Technical analysis is your blueprint. Fundamentals are your intel. Risk management is your getaway car. NEVER forget the car!" 🚗💨
"In trading, like in heists: Amateurs focus on the prize. Professionals focus on the exit strategy." 🚪✅
"The best traders don't predict the future—they prepare for multiple scenarios and profit from ANY outcome." 🧠📊
⚡ FINAL WORDS FROM THE THIEF 🎩
Ladies & Gentlemen, Thief OG's, market ninjas, and chart wizards!
This ain't financial advice—this is a treasure map 🗺️. Whether you follow it or forge your own path, remember: The market pays those who respect it and punishes those who don't.
Set your alerts 🔔, manage your risk 🛡️, and may the pips be ever in your favor! 🍀💵
Stay sharp. Stay profitable. Stay legendary. 🔥👑
💬 Drop a 🚀 if you're riding this trade with me! Comment your TP level below! 👇
🔥 LIKE & FOLLOW for more Thief-Style setups that print! 💰📈
Eurusdtrendanalysis

EUR/USD Price Outlook – Trade Setup📊 Technical Structure
TICKMILL:EURUSD EUR/USD is showing signs of short-term exhaustion after failing to sustain momentum above the 1.1955–1.1975 resistance zone. Price has started to rotate lower, suggesting that sellers are stepping in near the supply area following the recent rally.
The structure favours a corrective downside move as long as price remains capped below resistance. The projected path indicates a minor pullback toward resistance for liquidity before a continuation lower toward the 1.1860–1.1845 support zone.
🎯 Trade Setup (Bearish Bias)
Entry Zone: 1.1955 – 1.1975
Stop Loss: 1.2005
Take Profit 1: 1.1860
Take Profit 2: 1.1845
Risk–Reward Ratio: Approx. 1 : 2.31
📌 Invalidation:
A sustained break and close above 1.2000 would invalidate the bearish setup and signal renewed bullish strength.
🌐 Macro Background
The US Dollar is attempting a modest recovery after hitting multi-year lows, creating short-term pressure on EUR/USD. Additionally, ECB officials have expressed concern about the Euro’s rapid appreciation, which could further limit upside momentum.
With markets reassessing USD positioning and monitoring central bank signals, the near-term macro backdrop supports the possibility of a technical pullback rather than immediate continuation higher.
🔑 Key Technical Levels
Resistance Zone: 1.1955 – 1.1975
Support Zone: 1.1845 – 1.1860
Bearish Invalidation: Above 1.2000
📌 Trade Summary
EUR/USD is struggling to hold above a key resistance area after an extended rally. As long as price stays below 1.1975, the bias favors a sell-on-rallies approach, targeting a corrective decline toward the support band.
⚠️ Disclaimer
This analysis is for reference only and does not constitute trading advice. Financial markets involve significant risk; proper risk and position management are essential.

EURUSD Bullish Breakout!
HI,Traders !
#EURUSD is trading in an
Uptrend and the pair made
A strong bullish breakout
Of the key horizontal level
Of 1.17784 and the breakout
Is confirmed so we will be
Expecting a further bullish
Move up on Monday !
Comment and subscribe to help us grow

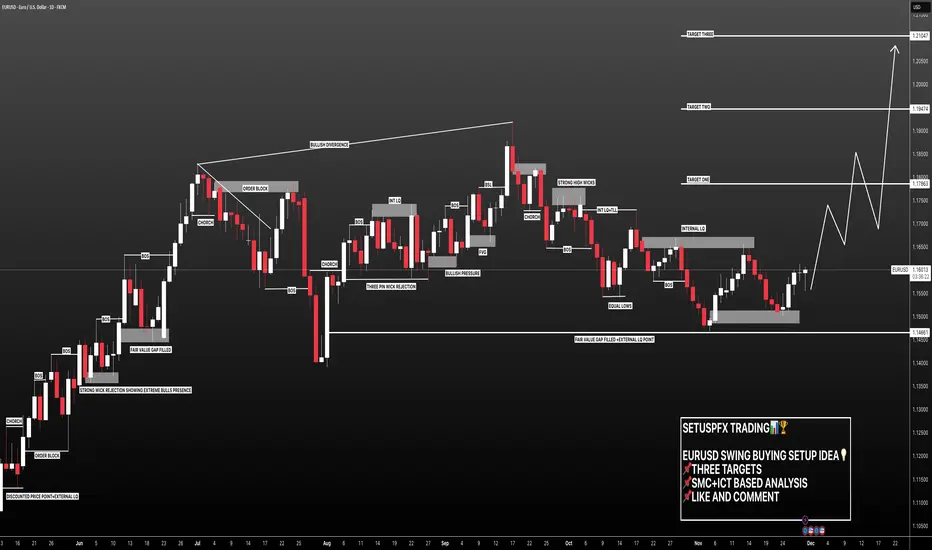
EURUSD: 600+ Pips Trading Setup Idea! Comment Your Views! Dear Traders,
EURUSD dropped recently mostly taken out our sell side liquidity, now reversed nicely and moving up sharply. There are three targets and each target can be adjust based on your lot size and risk management. DXY is likely to drop further down which will help our trading setups to hit the targets that are already set.
If you like our trading ideas then please do consider liking and commenting our ideas and for more please do follow us for more.
Team Setupsfx_

EURUSD: Three Targets Swing Buy, One Entry! **EURUSD ANALYSIS**
🔺The daily timeframe suggests a strong bullish price trend is likely to continue. After hitting some important levels and then reversing, with a big push from bullish volume, we expect the upward momentum to keep going. The lowest point of the day was at 1.1474, where the reversal happened and they broke through the main bearish trendline. Then, they tested 1.1510 again, and things have been moving up steadily since then.
🔺Looking at the basics, the US dollar might keep losing value, mainly because of what’s happening with Venezuela. This could hurt the US dollar but help the euro and other metal prices.
🔺The *Blue Marked Zone* is where we think it’s a good time to buy, and we reckon there’s a good chance of a sharp price change with strong buying pressure. We suggest setting your stop-loss order below this zone.
🔺We’ve set up three different places to make a profit, which you can use in your trading plan. When you get to the first profit level, it’s a good idea to close some of your position and move the rest to the second level. You should do the same thing for the last time you enter.
🔺If you find our work helpful, please like and comment so we can share more. We wish you all the best with your trading and really recommend making sure you have good risk management in place. Also, we suggest doing your own thorough analysis and using this information just to learn.
Team SetupsFX_👨💻📊❤️

#EUR/USD Buy Trade Setup.Here’s an up-to-date EUR/USD Buy trade outlook (technical + fundamental) to help you assess whether positioning for a Upside makes sense right now.
Thank You......

EU Buying opportunity for this weekMy outlook on EU is similar to GU. I’m expecting price to slow down and accumulate before continuing higher. I’m focused on a 45-minute demand zone that sits at a strong technical location.
Ideally, I want to see price sweep the Asia low, react from this demand, and form a CHOCH, which could set up a London session buy opportunity.
Confluences for EU Buys:
• Clean 45-minute demand zone that previously caused a BOS to the upside
• Liquidity and trendline resistance resting above price
• DXY approaching supply, supporting upside in EU
• Higher-time-frame structure remains bullish over the past few months
P.S. If price fails to respect this demand, I’ll wait for a retracement into a supply zone to assess short opportunities. That said, my primary bias remains bullish unless higher-time-frame structure shifts.

EURUSD – Momentum Is ShiftingEURUSD – Momentum Is Shifting
Weekly Insight:
EURUSD is showing early signs of weakness after a strong bullish phase. The loss of bullish momentum and the break of key structure suggest that the pair may be preparing
for a deeper move to the downside.
A short-term pullback is possible, but as long as price remains below resistance, bearish pressure is likely to dominate.
EURUSD confirms trend reversal
(Uptrend break → structure shift → waiting retest AOI)
DXY confirms trend weakness
(Downtrend break → higher high broken → waiting AOI retest)
📌 Correlation is clear:
Strength DXY = Weak on EURUSD
❓Is this just a pause… or the beginning of a larger bearish move?

Is EUR/USD Entering a Bullish Continuation Phase?📌 EUR/USD – “THE FIBRE”
💱 Forex Market Trade Opportunity Guide
(Swing Trade | Day Trade)
🔵 Market Bias
🟢 BULLISH STRUCTURE CONFIRMED
Price action aligns with trend continuation mechanics, supported by multi-indicator confluence and momentum expansion.
🧠 Trade Plan – Technical Confluence
✔️ Triangular Moving Average BREAKOUT
✔️ Hull Moving Average Pullback & Retest (dynamic support confirmation)
✔️ CCI Oscillator Golden Cross (momentum acceleration signal)
📊 This setup reflects trend resumption after healthy retracement, often favored by smart money continuation models.
🎯 Entry Strategy
🟢 YOU CAN ENTER AT ANY PRICE LEVEL
🔹 Traders may scale in using price acceptance above dynamic averages
🔹 Suitable for layered entries based on individual risk frameworks
🛑 Risk Management
🔴 Stop Loss (Reference Level): 1.16500
⚠️ Dear Ladies & Gentlemen (Thief OG’s)
Risk parameters must always be adjusted based on your own strategy, capital, and exposure model.
This level is not mandatory.
🏁 Profit Zone / Exit Logic
🎯 Primary Target: 1.18500
🚓 Police force zone acting as:
Strong historical resistance
Overbought price area
Liquidity trap potential
High probability reaction / correction zone
➡️ Protect profits aggressively near this zone.
⚠️ Dear Ladies & Gentlemen (Thief OG’s)
TP levels are guidelines, not financial advice. Partial profits are encouraged.
🔗 Related Pairs to Watch (Correlation & Confirmation)
💵 USD-Driven Correlation
TVC:DXY (US Dollar Index)
🔻 Weakness in DXY generally supports EUR/USD upside
🔺 Any sharp DXY reversal may cap EUR/USD gains
💶 EUR Strength Basket
OANDA:EURJPY
📈 Bullish momentum confirms EUR strength vs safe-haven JPY
OANDA:EURGBP
🔄 Range behavior here helps identify relative EUR demand
OANDA:EURCHF
🧭 Stability above key levels supports risk-on EUR flows
💷 Cross-Market Confirmation
FX:GBPUSD
✔️ Parallel bullish structure adds USD weakness confirmation
OANDA:USDCHF
🔻 Bearish bias here often aligns with EUR/USD bullish continuation
🧩 Key Insight
📌 When EUR pairs show synchronized strength and USD pairs weaken,
➡️ EUR/USD continuation probability increases significantly.
🏁 Final Note
This setup is built on trend alignment, momentum confirmation, and structured risk logic.
Discipline, patience, and execution consistency are what turn setups into profits.
📈 Trade smart. Manage risk. Protect capital.

EUR/USD Market Structure Signals Upside Potential🔔 EUR/USD Breakout Watch — Is the Fibre Ready for the Next Leg Higher?
📌 Asset
EUR/USD — “THE FIBRE”
FOREX Market Trade Opportunity Guide (Day / Swing Trade)
📈 Market Bias
🟢 Bullish Plan — Pending Order Setup
Momentum is building as price approaches a key resistance breakout zone, suggesting potential continuation once liquidity above the level is cleared.
🎯 Entry Strategy
✅ Buy after confirmed resistance breakout @ 1.18000
📌 You may enter at any price level after breakout confirmation
📌 Patience is key — let the market show acceptance above resistance
🛑 Stop Loss
🔻 Thief SL @ 1.17500
⚠️ Dear Ladies & Gentlemen (Thief OG’s):
Adjust your stop-loss according to your own risk management & position sizing.
I do not recommend blindly following my SL.
🎯 Target Zone
🚔 Police Barricade Area @ 1.18700
Strong resistance zone
Overbought conditions may appear
Possible bull trap & corrective move
👉 Escape with profits once price reacts
⚠️ Dear Ladies & Gentlemen (Thief OG’s):
I do not recommend using only my TP. Secure profits based on your own trading plan.
🔗 Related Pairs to Watch (USD Correlation)
💵 GBP/USD
Positive correlation with EUR/USD
Strength here often confirms USD weakness
💵 AUD/USD
Risk-on sentiment gauge
Bullish AUD/USD supports EUR/USD upside
💵 USD/JPY
Inverse correlation
Weak USD usually pushes USD/JPY lower while EUR/USD rises
💵 DXY (US Dollar Index)
Key driver
Sustained weakness below resistance favors EUR/USD bulls
🌍 Fundamental & Economic Factors to Monitor
📊 Eurozone Factors
ECB policy outlook & interest rate guidance
Inflation (CPI) and PMI data affecting EUR strength
Economic growth stability across core EU economies
📊 US Factors
Federal Reserve rate expectations
Inflation data (CPI, PCE) impacting USD demand
Labor market releases influencing USD volatility
📰 Upcoming High-Impact Events
Central bank speeches
Inflation & employment reports
Risk sentiment from global macro developments
📌 Volatility is expected around major data releases — manage exposure wisely.
🧠 Trader’s Reminder
💡 Trade the confirmation, not the hope
💡 Protect capital first, profits second
💡 Discipline > Emotion
👍 If this setup aligns with your market view, drop a like & share your thoughts below.
📊 Follow for more structured Forex, Index & Commodity trade blueprints.
⚔️ Trade smart. Trade disciplined.

EURUSD: Reversal Almost Confirmed +1500 Pips In Making! FX:EURUSD
As outlined in our previous analysis, the price fell further than anticipated. Given this region, we believe the price has reversed from a crucial level. Consequently, we anticipate a significant price increase. A swing bullish move is possible, potentially gaining around +1500 pips if successful. Please like and comment if you enjoy our work.
Good luck and trade safely!
Team Setupsfx_
EUR/USD – Price Action Triggers Bearish Opportunity🚀 EUR/USD “FIBRE” Metals Market Profit Playbook 🪓 (Day-Trade Setup)
🧠 Market Overview
Rob the Market here — diving into EUR/USD (“FIBRE”) with a bearish day-trade plan.
The 200 SMA is rejecting bull riders, and a SMA 786 breakout just slashed through dynamic support — giving us the green light for a downside play.
This setup runs on my signature “Thief Layered Strategy” — a professional-style, multi-entry approach that adds precision, reduces exposure, and keeps emotions cool.
💣 Trade Plan
Bias: Bearish ✅
Technical Confirmation:
• 200 SMA acting as key resistance — bulls got denied hard.
• SMA 786 breakout confirms bearish pressure.
• Dynamic support line flipped to resistance — trend favoring shorts.
🎯 Thief Layered Entry Strategy 💼
Instead of dumping one big order, this method spreads multiple sell-limit entries to scale in smartly as price develops.
💡 Why Layered Entries?
• Avoids premature entries in volatile moves.
• Smooths your average entry price for better R:R.
• Lets you add positions only when the market confirms your bias.
• Keeps the mind calm and the account safe — stealth moves only 😎
🔥 Example Layer Levels (Sell Limits):
First layer ➤ 1.16400 — initial resistance test zone.
Second layer ➤ 1.16200 — confirms rejection from 200 SMA.
Third layer ➤ 1.16000 — mid-zone entry, balanced risk.
Fourth layer ➤ 1.15800 — deep retrace trap entry, sniper fill zone.
🧠 Pro Tip: Adjust or add more layers depending on volatility and position size comfort. The Thief never rushes — he scales with patience.
🛡️ Stop Loss (Thief SL)
🔒 1.16800
Dear Ladies & Gentlemen (Thief OG’s): This is my thief-style stop, not a fixed rule.
Trade at your own risk — protect your loot before you rob the market! 🏦💨
💰 Target Zone (Thief TP)
🎯 1.14500 — major support zone + oversold levels + liquidity trap potential.
Perfect spot to escape with profits before the crowd catches on.
Again — this TP is flexible. The Thief exits quietly when the bag is full. 🤑
🔗 Related Pairs & Correlations to Watch
Keep your thief’s radar open for USD movement across majors:
• OANDA:USDCHF – Usually mirrors EUR/USD in reverse.
• FX:GBPUSD – Helps confirm overall USD strength or weakness.
• OANDA:EURGBP – Reveals EUR’s independent strength.
• TVC:DXY (US Dollar Index) – Strong DXY usually drags EUR/USD lower.
🔍 Key Points to Monitor
• Will the 200 SMA hold as resistance?
• Does the SMA 786 breakout retest fail or bounce?
• Volume + momentum alignment near entry layers.
• Any macroeconomic event shaking USD or EUR sentiment.
✨ “If you find value in my analysis, a 👍 and 🚀 boost is much appreciated — it helps me share more setups with the community!”
#EURUSD #Forex #DayTrade #ThiefStrategy #BearishSetup #LayeredEntries #SmartMoney #ForexCommunity #TradingViewIdeas #MetalsMarket #PriceAction

Can EUR/USD Continue Lower? MA Breakout Signals Weakness📊 EUR/USD "The Fiber" - Bearish Breakout Setup | Thief's Layer Entry Strategy 🎯
🔍 Market Overview
Asset: EUR/USD (The Fiber)
Market: Forex
Strategy Type: Swing/Day Trade
Bias: 🐻 BEARISH CONFIRMED
📉 Technical Analysis
The Euro has shown bearish momentum with a confirmed moving average breakout to the downside. This technical signal suggests potential continuation of the downtrend as sellers maintain control. The setup presents a structured approach for traders looking to capitalize on this bearish pressure.
🎯 The "Thief Strategy" - Layered Entry Approach
💡 What's the Thief Strategy?
This method uses multiple sell limit orders (layering technique) to scale into positions after confirmation. Think of it as setting multiple traps at key levels rather than going all-in at once!
📍 Entry Levels (Sell Limit Layers):
⚠️ CRITICAL: Only set these limit orders AFTER the breakout is confirmed. Don't jump the gun!
Layer 1: 1.16200
Layer 2: 1.16000
Layer 3: 1.15800
Layer 4: 1.15600
Note: You can add more layers based on your risk appetite and account size
🛑 Stop Loss:
Thief's SL: 1.16600
⚠️ Risk Disclaimer: This is my stop loss level, but YOU are the captain of your own ship! Set your SL based on YOUR risk tolerance and account management rules. Trade at your own risk, legends!
🎯 Take Profit Target:
Primary TP: 1.14400
Why this level?
✅ Strong historical support zone
✅ Oversold conditions likely
✅ Potential bull trap area
💰 Smart Money Move: Consider taking partial profits along the way and secure your gains before the target. Don't be greedy, be strategic!
⚠️ Profit Disclaimer: This is my target, but remember - YOU decide when to take YOUR money off the table. Manage your trades actively!
🔗 Related Pairs to Watch (Correlation Play)
Keep an eye on these correlated pairs for confluence:
GBP/USD (Cable) - Often moves in tandem with EUR/USD; bearish EUR typically means bearish GBP
DXY (US Dollar Index) - Inverse correlation; strong DXY = weak EUR/USD
EUR/GBP - Cross pair that shows relative Euro strength/weakness
XAU/USD (Gold) - Risk-off asset; if EUR falls alongside gold, confirms broader USD strength
🇺🇸 Key Point: This setup assumes USD strength. Watch Federal Reserve commentary and US economic data for catalysts that could accelerate or reverse this move.
⚙️ Trade Management Tips
✅ Wait for confirmation before setting limit orders
✅ Scale in using the layer strategy - don't use full position size on one entry
✅ Move SL to breakeven after Layer 2-3 fills
✅ Take partial profits at psychological levels (1.15000, 1.14500)
✅ Monitor DXY and US data for trend continuation signals
📊 Risk-Reward Profile
With proper layering and stops:
Potential Risk: ~40-60 pips (depending on entry)
Potential Reward: ~160-180 pips to target
R:R Ratio: Approximately 1:3+ 🎯
🎭 The Thief's Final Word
This is a strategic layered approach designed for traders who prefer calculated entries over gambling. The market is a game of probabilities, not certainties. Stay sharp, manage your risk, and remember - preserve capital first, make profits second!
Happy hunting, Thief OG's! 🏴☠️💰
✨ If you find value in my analysis, a 👍 and 🚀 boost is much appreciated — it helps me share more setups with the community!
⚠️ Disclaimer
This analysis represents the "Thief Style" trading strategy and is shared for educational and entertainment purposes only. This is NOT financial advice. Forex trading involves substantial risk of loss. Always conduct your own research, use proper risk management, and never trade with money you cannot afford to lose. Past performance does not guarantee future results.
#EURUSD #Forex #ForexTrading #TechnicalAnalysis #PriceAction #SwingTrading #DayTrading #TheFiber #BearishBreakout #LayerEntry #ForexStrategy #ForexSignals #TradingView #ForexAnalysis #USD #CurrencyTrading #ForexSetup #RiskManagement #TradingStrategy #ForexCommunity

EURUSD: Dollar Strength Still In Charge, Euro Is The PassengerEURUSD , Looking at this with the chart not mentally flipped, the structure is clearly one of exhaustion on the euro side. We’ve got a series of lower swing highs against a dominant dollar backdrop, and price is grinding along support rather than impulsively breaking higher. Fundamentally this lines up with a market that still prefers USD carry and safety over a low-growth eurozone.
Current Bias
Bearish.
On a non-inverted EURUSD chart, the dominant idea is USD strength: rallies are selling opportunities while price stays capped below recent highs and trend resistance.
Key Fundamental Drivers
Fed vs ECB policy path
Fed: Still on track for rate cuts, but at a measured pace, with Powell making it clear that the FOMC will react to data, not chase market pricing. That keeps US real yields relatively attractive and supports the dollar.
ECB: Growth is softer, inflation is easing, and officials are signalling “policy in a good place” with strong data dependence. There is little appetite for a hawkish surprise, which leaves EUR without a clear policy advantage.
Growth and labor dynamics
US: Data points to a cooling but still resilient economy. Labor market is loosening, but not breaking. That combination justifies gradual easing rather than aggressive cuts.
Eurozone: Sentiment and activity indicators are weak or only stabilising. Lower growth means the ECB cannot diverge hawkishly from the Fed for long without harming already-fragile demand.
Risk and safe-haven flows
In risk-off or “policy confusion” episodes, USD still benefits more than EUR. That underpins a downside bias in EURUSD when volatility picks up.
Net: Fundamentals still favour USD over EUR, which on a standard chart is bearish EURUSD.
Macro Context
Rates:
Market pricing has shifted toward fewer / slower Fed cuts than the most dovish scenarios. The ECB is also expected to cut, but the eurozone’s weaker growth gives it less room to signal anything hawkish. Rate differentials stay either neutral or mildly USD-supportive.
Growth:
US growth is moderating from strong levels, eurozone growth is stuck near stagnation. That relative story helps the dollar on a “least-ugly” basis.
Geopolitics and trade:
Trade tensions (US–China, EU–China, tariff talk) and geopolitical risk favour USD demand over EUR, because the dollar is still the primary global hedge.
Put together, the macro picture argues against a sustained euro bull run and supports a sell-the-rally EURUSD regime.
Primary Risk to the Bearish View
The main risk is a sharp dovish pivot from the Fed driven by:
A clear downside surprise in US labor or inflation data that forces the market to price a much faster and deeper rate-cut cycle.
Any signal that the Fed is more willing to tolerate overshooting on inflation to protect growth and employment.
That type of shift would knock US yields lower, hurt the dollar, and could squeeze EURUSD sharply higher, invalidating the downside structure.
Most Critical Upcoming News/Event
US: CPI, PCE, NFP, and Powell/Fed speeches – anything that changes the timing or depth of 2026 rate cuts.
Eurozone: Inflation prints and ECB communication; not because they are likely to be hawkish, but because any hint of “less dovish than feared” could temporarily lift EUR.
For direction, though, the USD leg is still more important than the EUR leg.
Leader/Lagger Dynamics
EURUSD is a lagger, not a leader.
It tends to follow DXY and US yields, rather than set the tone.
When DXY strengthens on higher US yields or risk aversion, EURUSD typically moves lower.
Crosses like EURJPY, EURGBP, and risk sentiment via US indices often move first and EURUSD confirms.
So for timing, I’d look at DXY, US10Y, and broader risk sentiment, then use EURUSD to express the USD view.
Key Levels
Support Levels (bearish targets):
1.1500–1.1520: local support and mid-channel area.
1.1400: key structural support; break here opens the door to deeper downside.
Resistance Levels (sell zones):
1.1700–1.1750: recent swing highs and clear horizontal resistance.
1.1800–1.1850: major supply zone and invalidation area for the medium-term bearish bias.
Stop Loss (SL) for a bearish swing idea:
Above 1.1850 on a daily close, which would signal that the current USD-strength narrative has been materially challenged.
Take Profit (TP) for a bearish swing idea:
First TP around 1.1500,
Second TP extension toward 1.1400 if US data stays solid and the dollar bid persists.
Summary: Bias and Watchpoints
Re-reading this with the chart correctly interpreted, EURUSD is fundamentally and technically bearish, not bullish. The story is still one of relative USD strength: a Fed that cuts, but slowly, versus an ECB constrained by weak growth and little scope to lean hawkish. That leaves rallies toward 1.17–1.18 as potential selling opportunities, with the bearish structure only really invalidated if price closes convincingly above that 1.18–1.1850 zone.
On the downside, I’d watch how price behaves around 1.15 first and 1.14 second. Strong US data and firm yields could push us there; a sudden dovish Fed pivot is the main risk that would blow this view up and squeeze EURUSD higher instead. Until that happens, I’m treating EURUSD as a lagger that confirms the broader dollar story, not a pair that sets it.

Is EUR/USD Preparing for a Deeper Bearish Continuation Move?EUR/USD BEARISH SWING 🐻 | Layer Entry "Thief" Strategy | MA Pullback Confirmation
🎯 TRADE SETUP: EUR/USD "The Fibre" - BEARISH SWING
Hey Traders! 👋 Ready for a potential swing move? The Fibre is showing a classic bearish setup, and we're deploying a strategic entry to catch the wave. Let's break it down! ⬇️
📉 MARKET BIAS & STRATEGY
Bias: Strong Bearish
Strategy: "Thief" Layer Entries + Moving Average Pullback & Trend Reversal
The bearish structure is confirmed! Price is respecting key resistance and showing weakness after a pullback to the moving average. We're using a "Thief" style layer strategy to scale into the position optimally. 🎯
⚙️ TRADE PLAN & EXECUTION
🎯 ENTRY (Thief Layer Method):
We are not chasing price! We are placing multiple SELL LIMIT orders at key levels to get a favorable average entry.
✅ Layer 1 (Initial): 1.15800
✅ Layer 2 (Add): 1.15600
✅ Layer 3 (Add): 1.15400
💡 Pro Tip: You can increase or adjust these layers based on your capital and risk appetite.
🛑 STOP LOSS (Risk Management):
A unified Stop Loss is set at 1.16000.
⚠️ IMPORTANT NOTE: This is MY SL based on MY strategy. Dear Thief OG's 🦹♂️🦹♀️, you MUST adjust your SL based on your own risk tolerance and account size. Protect your capital!
💰 TAKE PROFIT TARGET:
Our primary target is the strong support zone at 1.14300.
This level aligns with:
📉 Strong Support
🩹 Oversold Conditions
Potential Bull Trap
🔗 Positive Correlation Confirmation
🚨 Another Critical Note: Take profits based on YOUR plan! If you're in profit, feel free to escape early. Manage your own trade!
🔍 CORRELATION & PAIRS TO WATCH
A move in EUR/USD doesn't happen in isolation. Keep these on your radar:
TVC:DXY (US Dollar Index): 🚨 KEY DRIVER! A stronger DXY = Bearish EUR/USD. Watch for bullish breaks in the DXY to confirm our bearish bias.
GBP/USD ( FX:GBPUSD ): Often moves in correlation with EUR/USD. If Cable is also falling, it reinforces the USD strength narrative.
USD/CHF ( OANDA:USDCHF ): Typically inverse to EUR/USD. A bullish USD/CHF supports our bearish EUR/USD outlook.
EUR/GBP ( OANDA:EURGBP ): Watch for relative strength/weakness. If EUR/GBP is also falling, it confirms broad EUR weakness.
💎 FINAL WORDS
This is a swing trade plan. Patience is key! 🗝️
If you found this idea helpful:
👍 Smash that LIKE button!
🔔 Follow me for more "Thief" strategies and clear setups!
💬 Comment below with your thoughts or questions!
Let's get those pips! 🏴☠️
Happy Trading, and remember, the trend is your friend (until it ends)!

EUR/USD 4H Technical Analysis: Breakout Confirmation & Next MoveOn the 4-hour timeframe, EUR/USD has successfully broken out of a long-term descending trendline. After the breakout, the pair made a retest, confirming bullish continuation. Currently price is slightly correcting downward but still holding above key support zones.
🔍 Key Technical Highlights
📌 1. Breakout From Downtrend
The downward sloping trendline has been broken.
Price retested the breakout area — confirming valid breakout.
📌 2. Moving Averages (SMA Support)
SMA (9) remains above SMA (20) — showing short-term bullish momentum.
Current correction is holding around SMA (20), acting as support.
📌 3. Higher Lows Forming
Since mid-November, price has been forming higher lows.
This pattern supports bullish continuation.
📊 Important Price Levels
Zone Type Price
Immediate Support 1.1600
SMA Support Zone 1.1625
Major Support 1.1500
Immediate Resistance 1.1680
Major Resistance 1.1750
🧭 Market Sentiment
Bias remains bullish as long as:
EUR/USD trades above 1.1600
No strong candle closes below SMA (20)
🎯 Potential Future Scenarios
📈 Bullish Scenario
If price bounces from 1.1625 and breaks 1.1680:
➡️ Next Target: 1.1750
📉 Bearish Scenario
If price drops below 1.1600:
➡️ Next Downside Target: 1.1500
Outlook Summary
Trend Direction Confidence
Bullish Uptrend Medium–Strong
Frequently Asked Questions
Q1: Should traders look for buying opportunities?
Yes — above 1.1600, but with bullish confirmation.
Q2: Where is short (sell) opportunity?
Below 1.1600 (strong candle close preferred).
Q3: Was the breakout fake?
No. The breakout and retest confirm validity.
📌 Final Thoughts
EUR/USD remains technically bullish. The breakout structure is healthy, moving averages support the trend, and the market may aim for 1.1750 if 1.1680 breaks.

EUR/USD: Momentum Break or Wave (4) – Prepare for a ReversalEUR/USD: Momentum Break or Wave (4) – Prepare for a Reversal
📈 Weekly Scenarios
Bearish scenario (correction): Price breaks support at ~1.1650 → wave (4) develops → possible decline to ~1.1550–1.1530.
Sideways scenario: The pair consolidates between ~1.1650 and ~1.1800, accumulating energy for the next trend.
Bullish scenario (momentum): EUR/USD holds support at ~1.1650 and breaks above ~1.1800 → wave (5) begins → target ~1.1900 and above.
✅ Conclusion
On the weekly timeframe, EUR/USD is at a key point for choosing a scenario:
Holding support at ~1.1650 and breaking resistance at ~1.1800 could trigger a new upward momentum.
A breakout below ~1.1650 signals a deeper correction by wave (4).
It's important to monitor the wave structure and price reaction at these levels before entering a position.

EURUSD: Three Targets, One Entry, Swing Buy! Dear Traders,
EURUSD has broken through the trendline liquidity, providing us with the confirmation we needed to buy big. We believe the price is likely to head towards three targets. The first target is nearby, and once it’s hit, we may see price retesting and confirming the trend change. At this point, it would be safe to enter with accurate risk management.
Good luck and trade safely!
Team Setupsfx_

EUR/USD Bearish Setup – Liquidity Zone or Last Stand for Bulls?💼 EUR/USD “FIBRE” – Metals Market Profit Playbook (Swing / Day Trade)
Plan: 🐻 Bearish Setup
EUR/USD (aka “The Fibre”) is stepping into a profit ambush zone!
Price currently approaching a liquidity trap region, where sellers have quietly stacked their orders like it’s a secret vault raid.
📉 Technical Breakdown:
Price tapping into Police Barricade Resistance Zone @ 1.1500 🧱
Market showing overbought conditions with divergence signals flashing red 🚨
Strong supply block + liquidity trap = high probability rejection zone
Momentum losing steam — bears could reload for another downside sweep 💣
🎯 Target: 1.1500 zone (expected rejection region)
🧨 This area is where the “Police Barricade” holds strong — better take your profits before the market cuffs your gains.
💣 Stop-Loss (Thief’s personal SL): 1.1650
⚠️ Dear Ladies & Gentlemen (Thief OG’s), I’m not recommending to copy my SL — it’s just my personal risk plan. You can trade your own story, make your own money, and take your profits responsibly.
🧩 Related Market Correlations to Watch
Keep an eye on these correlated pairs — they often move in sync or opposite flow with EUR/USD:
💵 TVC:DXY (US Dollar Index) → Inverse correlation; if DXY rises, EUR/USD usually dips.
💷 FX:GBPUSD (“Cable”) → Tends to follow similar directional flow with EUR/USD.
💴 FX:USDJPY (“Ninja”) → Watch for dollar strength confirmation.
OANDA:XAUUSD (Gold) → Dollar sentiment can reflect through gold momentum.
📊 These pairs give confirmation clues — when the dollar flexes, the Fibre usually folds.
💬 Final Words from Thief OG
This analysis isn’t a financial signal — it’s my Thief-style trading playbook, crafted for entertainment and education only.
Trade smart, respect your risk, and remember — every profit is a successful heist only if you exit before the market catches you. 😎💰
✨ “If you find value in my analysis, a 👍 and 🚀 boost is much appreciated — it helps me share more setups with the community!”
Disclaimer: This is a Thief-style trading strategy just for fun and educational insights only. Not financial advice.
#EURUSD #ForexAnalysis #SwingTrade #DayTrading #PriceAction #TechnicalAnalysis #DXY #Fibre #ForexCommunity #TradingView #BearishSetup #SmartMoneyConcepts #LiquidityTrap #SupplyDemand #FXStrategy

EURUSD Trade: Anticipating a Pullback Before the Next Leg Down💹 EURUSD Analysis & Outlook
I'm currently watching the EURUSD, and the broader structure tells a clear story 📉. On the higher timeframe (weekly chart), the pair remains firmly in a bearish trend, signaling that institutional capital is positioned short — big money continues to lean on the downside.
On the lower timeframe, we can identify a clean three-drive structure, where price has already traded down into previous external range liquidity 🏦. From a technical perspective, it makes sense to anticipate a reaction off this level, leading to a retracement back toward the previous 4-hour order block and potentially into the VWAP zone ⚖️.
Should this reaction materialize, I’ll be eyeing that retrace area as my point of interest (POI) for a potential short setup 🎯. However, if price fails to pull back as expected, I’ll stand aside and invalidate this trade idea — discipline over bias always.
⚠️ Disclaimer: This is not financial advice. The analysis shared here is for educational purposes only. Always conduct your own due diligence before trading.

#EURUSD (H4 & D1) – Trend Retest and Potential Wave 3 Formation#EURUSD (H4 & D1) – Trend Retest and Potential Wave 3 Formation
Current price: 1.1631
The euro is showing signs of a bullish continuation, with price testing the trendline support on H4 and setting up for a potential third-wave expansion. The same impulse structure is visible on the daily chart, suggesting multi-timeframe alignment.
🧩 Technical Overview (H4)
• Price successfully retested the ascending trendline, confirming short-term structural support near 1.1580–1.1600.
• The current recovery move is developing into a third impulsive leg after completing a corrective pullback.
• The structure remains bullish as long as the market stays above the previous swing low.
📈 Scenario
• Stop-loss: below the prior swing low at 1.1579 (wave 1 base).
• Upside objectives:
– 1.1755–1.1765 — first confirmation zone
– 1.1840–1.1850 — key extension target (1.618 Fib projection)
– 1.1910–1.1920 — extended cycle target (2.0 projection)
– 1.2020 — potential completion of wave sequence
• A breakout above 1.1650–1.1670 would confirm the start of the next bullish leg.
⚙️ Market Context (D1)
• On the daily timeframe, price is forming a larger potential wave 3, aligning with the bullish H4 impulse.
• The broader trendline from mid-summer lows continues to hold as structural support.
• The setup reflects early signs of euro strength amid easing USD momentum.
🧭 Summary
EUR/USD remains in a constructive technical position, consolidating before a potential impulsive breakout.
• While above 1.1579, bias stays bullish, targeting 1.1755 → 1.1845 → 1.1915.
• A close above 1.1650 would confirm bullish acceleration, while a drop below 1.1579 would invalidate the setup.

EURUSD FRGNT FORECAST - Q4 | W44 Y25 |📅 Q4 | W44 Y25 |
📊 EURUSD FRGNT FORECAST
🔍 Analysis Approach:
I’m applying Smart Money Concepts, focusing on:
Identifying Points of Interest on the Higher Time Frames (HTFs) 🕰️
Using those POIs to define a clear trading range 📐
Refining those zones on Lower Time Frames (LTFs) 🔎
Waiting for a Break of Structure (BoS) for confirmation ✅
This method allows me to stay precise, disciplined, and aligned with the market narrative, rather than chasing price.
💡 My Motto:
"Capital management, discipline, and consistency in your trading edge."
A positive risk-to-reward ratio, paired with a high win rate, is the backbone of any solid trading plan 📈🔐
⚠️ Losses?
They’re part of the mathematical game of trading 🎲
They don’t define you — they’re necessary, they happen, and we move forward 📊➡️
🙏 I appreciate you taking the time to review my Daily Forecast.
Stay sharp, stay consistent, and protect your capital
— FRNGT 🚀
OANDA:EURUSD

EUR/USD: Wave (5) or a bull trap?EUR/USD: Wave (5) or a bull trap?
📈 Weekly Scenarios
Bullish scenario: EUR/USD holds the ~1.1540 level, breaks through ~1.1727 → wave (5) to ~1.1917 is initiated.
Consolidation: movement in the ~1.1540–1.1727 range without a clear breakout → waiting for a signal.
Bearish scenario: breakout below ~1.1540 with volume confirmation → correction to ~1.1390 and the beginning of a downward A-B-C structure.
✅ Conclusion
Neutral-bullish sentiment dominates for the EUR/USD pair over the coming week, with a bias toward growth if key conditions are met.
Holding support at ~1.1540 is important to maintain bullish sentiment.
A breakout of resistance at ~1.1727 is a signal for growth.
A breakout of support at ~1.1540 signals a correction and a possible decline to ~1.1390.
