EURUSDEURUSD
- Completed " 123 " Impulsive Waves
- Fibonacci Level - 161.80%
- Buy Side Liquidity
- Break of Structure
- S / R Level
Eurusdupdate

EURUSD: the development of the 5th waveThe Elliott Wave pattern on EURUSD points to a final upward wave. Following the corrective phase (Wave 4), the formation of the concluding impulse (Wave 5) has begun, known for its powerful and often emotional dynamics.
Wave 5 appears to be gaining momentum, as evidenced by the consistent sequence of higher highs and higher lows. Further advancement toward targets, calculated based on the proportions of the prior waves, is expected.
The primary risk is the potential exhaustion of the current impulse, signs of which will first be visible on lower timeframes. While the base scenario remains bullish, it is crucial to monitor for signals indicating the completion of the entire cycle, which would precede a trend reversal.

EUR/USD Turning Point – Trend Continuation or Trap Setup?🥇 EUR/USD "The Fiber" Setup: The Institutional Pullback Heist 🥇
The Fiber is serving up a classic institutional-grade pullback, and the thief is ready to load up! A confluence of bullish signals is aligning, suggesting the dip might be a gift.
📊 The Master Plan (Bullish Confluence)
Trend & Momentum: Price is holding beautifully above the key 786 Volume Weighted Moving Average, confirming the underlying bullish momentum.
Pattern Recognition: A pristine Double Bottom pattern is in play, and we are currently witnessing the crucial pullback retest of its neckline.
Reversal Signal: The retest is being validated by a Heiken Ashi Doji reversal candle, indicating a potential exhaustion of the bearish move right at a key support level.
This isn't just one signal; it's a symphony of confirmation. 🎻
🎯 The Thief's Entry Strategy (Layered Limit Orders)
Why enter at one price when you can scale in like a pro? The "Thief Strategy" uses multiple buy limit orders to average into the position.
🛒 Buy Limit Layers:
Layer 1: 1.16600
Layer 2: 1.16400
Layer 3: 1.16200
Layer 4: 1.16000
💡 Pro Tip: Feel free to adjust the number of layers and prices based on your own risk appetite and market depth.
🚨 Risk Management (The Escape Plan)
Stop Loss (The Getaway Car): 1.15800
A note from the Thief: "Dear Thief OGs, this is MY planned escape route. Your risk tolerance is your own; manage it accordingly. A true thief always has an exit plan!"
Take Profit (The Score): 1.17600
This target aligns with a strong resistance zone. With potential overbought conditions and liquidity traps, it's wise to escape with your profits intact!
Another note: "Ladies & Gentlemen, profit is profit. Take it at your own discretion. I'm just showing you the vault; you decide how much to carry!"
🌐 Related Pairs to Watch
FX:GBPUSD (Cable): Often moves in correlation with EUR/USD. A strong bullish move in the Fiber should be confirmed by Cable.
OANDA:USDCHF : The classic "anti-EUR." A bearish USD view here (CHF strengthening) would support a bullish EUR/USD thesis.
TVC:DXY (U.S. Dollar Index): THE KEY ONE TO WATCH! A drop in the DXY is a direct tailwind for EUR/USD. If the DXY is breaking support, our bullish heist is a go.
✨ Final Community Message
✨ “If you find value in my analysis, a 👍 and 🚀 boost is much appreciated — it helps me share more setups with the community!”
#Forex #EURUSD #TradingSetup #SwingTrading #TechnicalAnalysis #DoubleBottom #TradingStrategy #ThiefStyle

EUR/USD Slide Begins! Market Flow Shifts Bearish🎯 EUR/USD "THE FIBER" 🔥 | Cash Flow Heist Strategy (Swing/Day Trade)
📊 MARKET SETUP
🐻 Bias: BEARISH CONFIRMED
✅ Technical Confirmation: Triangular Moving Average Breakout
⚡ Strategy Type: The Thief Layering Method
🎯 THE HEIST PLAN (Entry Strategy)
🔫 Thief Style = Layered Limit Orders
Instead of one entry, we're placing multiple sell limit orders to catch the best average price:
Suggested Entry Layers:
🎯 Layer 1: 1.17000
🎯 Layer 2: 1.16800
🎯 Layer 3: 1.16500
🎯 Layer 4: 1.16300
Note: You can add more layers based on your account size and risk appetite. This is NY session pricing strategy.
🛡️ RISK MANAGEMENT
🚨 Stop Loss: 1.17300
💰 Take Profit Target: 1.15400
⚠️ IMPORTANT DISCLAIMER:
Dear Ladies & Gentlemen (Thief OG's) - These are MY levels for reference only. Always manage your own risk! If you see profit, secure it. Your account, your rules. Don't be greedy when the market pays you! 💵
Why 1.15400 Target?
Strong historical support zone
Oversold conditions likely
Bull trap territory - time to escape with the loot before reversal! 🏃♂️💨
🔗 CORRELATED PAIRS TO WATCH
Keep your eyes on these connected moves:
📈 Positive Correlation (Move together):
EURGBP
- Euro strength indicator
EURJPY
- Risk sentiment gauge
EURCHF
- Safe haven flow monitor
📉 Inverse Correlation (Move opposite):
DXY
(US Dollar Index) - The boss! Strong DXY = Weak EUR/USD
GBPUSD
- Cable follows Fiber's lead often
AUDUSD
- Risk-on/risk-off cousin
💡 Pro Tip: If DXY breaks higher while EUR indices weaken, this setup gets SPICY! 🌶️
🎓 KEY TECHNICAL POINTS
✅ Triangular MA Breakout = Momentum shift confirmed
✅ Multi-layer entries = Better average cost & lower risk per position
✅ 1.17300 SL = Tight stop above resistance
✅ 1.15400 TP = Major support + psychological level
✅ Risk:Reward = Solid 2:1+ depending on entry layers
📍 Current Levels (Oct 8, 2025):
Weekly High: 1.177
Weekly Low: 1.1663
Trend: Bearish pressure continuing
⚠️ FINAL DISCLAIMER
🎭 This is "Thief Style" trading strategy - created for educational and entertainment purposes only!
This analysis represents my personal trading approach and should NOT be considered financial advice. Trading forex carries substantial risk. Past performance does not guarantee future results. Always:
Do your own analysis
Risk only what you can afford to lose
Use proper position sizing
Never trade with borrowed money
YOU are responsible for YOUR trading decisions! 🎰
✨ If you find value in my analysis, a 👍 and 🚀 boost is much appreciated — it helps me share more setups with the community!
#EURUSD #Forex #TradingStrategy #SwingTrading #DayTrading #ForexSignals #TechnicalAnalysis #PriceAction #ForexTrading #CurrencyTrading #FiberSetup #ThiefStrategy #LayeredEntry #ForexCommunity #TradingView #ForexIdeas

EURUSD DAILY TIME FRAME STRUCTURE : BEARISH SETUP Greetings 👋
We Are Selling Eurusd
REASONS ?
:Order Block
:Supply Zone
:Head & Shoulders Patterns
:Market Structure Shift In Bullish Direction
We Have A Lot Pf Reasons To Sell Eurusd With Confidence And You Can Also See At The Charts That Why We Are Selling Eurusd
Hope Guys You Have Got It We Have To Hit Our Sell Targets , Letsss Gooo

EURUSDEURUSD
- Falling Wedge as an corrective pattern in Short Time Frame
- Change of Characteristics
- Completed " 12345 " Impulsive Waves
- RSI - Divergence
- Demand Zone

EUR/USD Price Outlook – Trade Setup📊 Technical Structure
FOREXCOM:EURUSD EUR/USD is trading just below 1.1700, pulling back from the sharp upside move that broke out of its multi-day descending channel. Price may retest the 1.1648–1.1656 support zone, which previously acted as channel resistance. As long as price holds above this newly reclaimed zone, the bullish breakout structure remains intact.
Overhead, the 1.1702–1.1708 resistance zone remains the next key barrier. The rejection wick at the top shows early signs of exhaustion, making a corrective pullback into support likely before any continuation higher. Should price stabilize above the support zone and form higher lows, a renewed push toward resistance is the preferred scenario.
🎯 Trade Setup
Bias: Buy the pullback toward support.
Entry: 1.1656 – 1.1648
Stop Loss: 1.1643
Take Profit 1: 1.1702
Take Profit 2: 1.1708
Risk–Reward Ratio: approx. 1 : 3.74
Setup remains valid while price holds above 1.1648.
A 1H close below the support zone invalidates the bullish outlook.
🌐 Macro Background (Simplified)
The Fed delivered a 25 bps rate cut, but Powell signalled the central bank is likely done easing for now, which limited downside pressure on the USD. Markets now expect the Fed to keep rates unchanged in January, softening the impact of the cut itself.
Meanwhile, expectations that the ECB will not cut rates further support the Euro. ECB officials, including Lagarde, emphasized that policy is “in a good place,” suggesting no urgency to ease again. This policy divergence—Fed slowing easing vs. ECB holding steady—helps stabilize EUR/USD after the initial Fed-driven spike.
USD direction today may respond to the upcoming US Initial Jobless Claims, which could add short-term volatility.
🔑 Key Technical Levels
Resistance Zone: 1.1702 – 1.1708
Support Zone: 1.1648 – 1.1656
Invalidation Level: 1.1643
📌 Trade Summary
EUR/USD is pulling back after breaking above its descending channel, with the 1.1648–1.1656 zone now acting as key demand. A corrective dip into this support offers a potential long setup targeting a retest of 1.1700. As long as price holds above 1.1648, the bullish continuation structure remains favourable.
⚠️ Disclaimer
This analysis is for reference only and does not constitute trading advice. Trading involves significant risk, and proper risk management is essential.

EURUSD H4 : Bearish Setup ! Can We Catch The Target ??Greetings 👋
Eurusd Looking Bearish
Bearish Setup
Reasons For Sell On EU ?
1: Liquidity Sweeped
2: Supply Zone
3: TBS (Turtle Body Soup)
4: Sell Side Pending Liquidity
Letsss Gooo Guyss

EUR/USD Price Outlook – Trade Setup📊 Technical Structure
TICKMILL:EURUSD EUR/USD is stabilizing around 1.1625, trading quietly beneath the 1.1637–1.1640 resistance zone. Price action shows repeated rejections from this supply area, keeping the short-term structure slightly bearish.
At the same time, the 1.1620–1.1623 support zone continues to hold, forming a tight consolidation range as the market awaits the upcoming FOMC decision. A break above 1.1637–1.1640 could open the path toward a broader recovery, while another rejection from resistance would likely push the pair back toward support.
For now, structure favours a buy-the-dip scenario from support, as long as the pair holds above 1.1618.
🎯 Trade Setup
Bias: Looking for long setups from support after a liquidity sweep.
Entry: 1.1620 – 1.1623
Stop Loss: 1.1618
Take Profit 1: 1.1637
Take Profit 2: 1.1640
Risk–Reward Ratio: ~1 : 2.62
The bullish scenario remains valid as long as price holds above 1.1618.
If EUR/USD breaks below the support zone with a 1H close, the setup becomes invalid.
🌐 Macro Background (Simplified)
Markets are fully focused on the Federal Reserve’s rate decision tonight, where a 25 bps cut is almost completely priced in. Despite this expected easing, traders are cautious because Powell may deliver a hawkish tone, signalling fewer cuts ahead. That uncertainty is keeping EUR/USD range-bound.
On the Euro side, expectations that the ECB is done with rate cuts offer mild support. Lagarde recently noted that the Eurozone economy is in a “good place,” suggesting the ECB is comfortable pausing policy changes for now.
With the Fed potentially hawkish and ECB neutral, the pair remains stuck in a tight consolidation awaiting clarity from tonight's decision.
🔑 Key Technical Levels
Resistance Zone: 1.1637 – 1.1640
Support Zone: 1.1620 – 1.1623
Invalidation Level: Break and close below 1.1618 (1H)
📌 Trade Summary
EUR/USD is moving sideways ahead of the FOMC decision, holding between a clean support and resistance structure. As long as support holds, bullish setups toward 1.1637–1.1640 remain favourable. A breakdown below 1.1618 cancels the idea and shifts bias lower.
⚠️ Disclaimer
This analysis is for reference only and does not constitute trading advice. Trading involves significant risk, and proper risk management is essential.

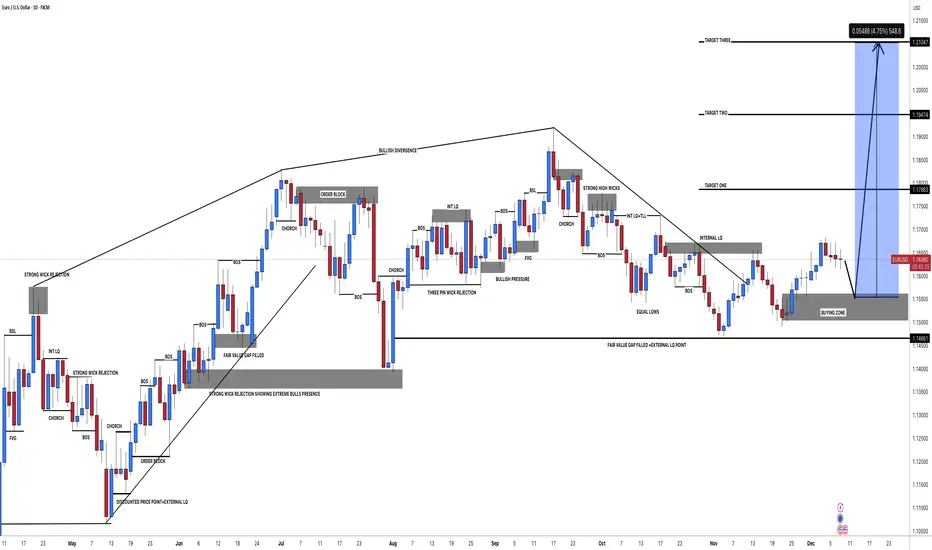
#EURUSD: +548 Pips Opportunity; Entry at Drawn Area! The EURUSD price is likely to reject from the drawn area presenting a potential buying opportunity. This could be a swing trade with a target of approximately 548 pips. Three targets are available for selection to suit your trading plan.
Team Setupsfx_🚀❤️
EURUSD EURUSD 8 Dec time frame 1H
🔶 Support & Resistance Zones Analysis
🔹 Support Zones:
1️⃣ 1.16448
2️⃣ 1.16234
3️⃣ 1.16133
🔸 Resistance Zone:
• 1.16588
✨ I only take trades on these zones if I get a CHOCH + Break of Structure confirmation.
❌ I do not use limit orders without confirmation.

EURUSDEURUSD
- Bullish Channel as an corrective pattern in Short Time Frame
- Resistance Level
- Break of Structure
- Completed " 12345 " Impulsive Waves and " ABC " Corrective Waves
- RSI - Divergence

EUR/USD Price Outlook – Trade Setup (EUR/USD)📊 Technical Structure
TICKMILL:EURUSD EUR/USD extended its climb toward 1.1615, but the pair remains capped below the 1.1620–1.1627 Resistance Zone, where repeated rejections and slowing bullish momentum indicate exhaustion. Price is now rotating lower, staying beneath the resistance ceiling while holding just above short-term micro-support.
A bearish retracement scenario is favoured while EUR/USD stays below 1.1620–1.1627 with price expected to drift back toward the 1.1595–1.1590 Support Zone. The descending reaction illustrated on the chart supports a short-term pullback before any potential upside continuation can emerge.
A 30M close above 1.1632 invalidates the bearish view and opens the door toward 1.1650+.
🎯 Trade Setup
Idea: Sell from resistance rejection targeting support.
Entry: 1.1620 – 1.1627
Stop Loss: 1.1632 (above resistance zone)
Take Profit 1: 1.1595
Take Profit 2: 1.1590
Risk–Reward Ratio: ≈ 1 : 2.46
The bearish setup holds as long as price remains capped beneath 1.1620–1.1627.
🌐 Macro Background
FXStreet reports that EUR/USD strengthened above 1.1600 as the US Dollar weakened following another month of contraction in US manufacturing. The ISM Manufacturing PMI printed 48.2, marking the ninth consecutive month below 50 and reinforcing expectations that the Federal Reserve will cut rates in December. Markets now price an 87% chance of a rate cut, up from 71% last week, according to CME FedWatch.
At the same time, the Euro benefits from the growing belief that the ECB has completed its cutting cycle, with President Lagarde stating rates are at the “right level.” However, the upcoming Eurozone HICP release carries risk: softer-than-expected inflation could weigh on the Euro and increase downside pressure on EUR/USD — aligning with the short-term pullback shown on the chart.
🔑 Key Technical Levels
Resistance Zone: 1.1620 – 1.1627
Support Zone: 1.1595 – 1.1590
Invalidation Level: 1.1632 (30M close above)
📌 Trade Summary
EUR/USD faces rejection at the 1.1620–1.1627 resistance zone and is showing early weakness, supported by bearish expectations ahead of Eurozone HICP. While Fed rate-cut expectations pressure the USD, near-term EUR strength appears overstretched. A retracement toward 1.1595–1.1590 remains the higher-probability path unless price breaks above 1.1632.
⚠️ Disclaimer
This analysis is for reference only and does not constitute trading advice. Trading involves significant risk, and proper risk management is essential.

EURUSD – Fibonacci Analysis (SELL Bias) Take Profit 1.15793Institutional Technical Breakdown | All Sessions
EUR/USD has generated a SELL signal based on the Fibonacci Retracement model, with price now reacting from a key Fib retracement zone that aligns with intraday resistance. Combined with weakening momentum and bearish divergence, the pair is showing strong signs of downward continuation.
This setup remains entirely technical, with no high-impact fundamental events distorting price action.
📌 Signal Summary
Bias: SELL
Model: Fibonacci Retracement
Sessions: All Sessions
Risk/Reward: ~1:2.5
Market Environment: High liquidity, stable volatility
The algorithm identifies that EUR/USD has retraced into a strong Fib resistance cluster, setting up a clean reversal opportunity.
📊 Technical Outlook
1. Fibonacci Confluence Zone
Price is currently reacting from the Fib retracement zone that aligns with:
38.2% to 50% retracement of the recent swing
Intraday resistance around 1.16125 – 1.16155
This creates a layered confluence zone, a common institutional sell area where liquidity is engineered before reversal.
2. Momentum & Divergence
MACD & momentum indicators show bearish divergence, meaning price is making higher highs while momentum fails to follow.
This suggests bullish exhaustion and increases the probability of a reversal from the Fib zone.
3. Price Action Behavior
Wicks forming at the top of the fib band show rejection of higher prices.
Price has failed multiple attempts to break above 1.16155, forming a clear supply zone.
The structure remains in a lower-high formation, fitting well with a Fibonacci-based trend continuation.
4. Market Context
Liquidity remains high across all sessions (Asia, London, NY).
No major events for EUR or USD in the immediate horizon — clean technical environment.
USD maintains a mildly strong macro tone.
📌 Key Technical Levels
Level Type Price
Immediate Resistance 1.16125
Immediate Support 1.16065
Major Resistance 1.16155
Major Support 1.16035
The 1.16125–1.16155 zone aligns with Fibonacci resistance and acts as your sell area.
🎯 Trade Parameters (from the model)
Entry Price: 1.16095
Stop Loss: 1.16246
Take Profit: 1.15793
The SL is positioned above major resistance & Fibonacci cluster, ensuring structural protection.
The TP targets the next liquidity shelf near the 1.15800 handle, a common continuation zone.
🧠 Trade Rationale
Price reacting from a major Fibonacci retracement zone.
Breakdown expected toward the 1.16035 → 1.15800 liquidity pocket.
Confluence of bearish divergence, supply rejection, and lower-high structure.
EUR showing cross-pair weakness; USD maintaining strength intraday.
This creates a high-probability Fibonacci reversal-to-continuation setup.
📉 Risk Management Guidance
Risk 1–2% max per position.
Monitor volatility spikes near intraday session openings.
Enable trailing stop once price breaks below 1.16035.
If a candle closes above 1.16246, bearish bias is invalid.
📌 Analyst Conclusion
EUR/USD is positioned for a technical reversal from the Fibonacci resistance cluster, supported by divergence, price-action rejection, and broader USD strength. As long as the pair holds beneath 1.16125–1.16155, the bearish continuation toward 1.15793 remains the most probable path.

EURUSDEURUSD
- Fair Value Gap
- Completed " 12345 " Impulsive Waves
- Break of Structure
- Falling Wedge as an corrective pattern in Short Time Frame
- Order Block

EURUSD: Narrow Upside TrendEURUSD is generally in a narrow-range oscillatory upward trend today. On the support side, the intraday core support is focused on the 1.1510 - 1.1521 range, with further support at the 1.1500 psychological level and the previous support zone around 1.1480. If it can stabilize above 1.1535 and break through the key resistance at 1.1550, the subsequent upside potential is expected to extend to 1.1600.

EURUSD FRGNT Daily Forecast -Q4 | W47| D21 | Y25 |📅 Q4 | W47| D21 | Y25 |
📊 EURUSD FRGNT Daily Forecast
🔍 Analysis Approach:
I’m applying Smart Money Concepts, focusing on:
Identifying Points of Interest on the Higher Time Frames (HTFs) 🕰️
Using those POIs to define a clear trading range 📐
Refining those zones on Lower Time Frames (LTFs) 🔎
Waiting for a Break of Structure (BoS) for confirmation ✅
This method allows me to stay precise, disciplined, and aligned with the market narrative, rather than chasing price.
💡 My Motto:
"Capital management, discipline, and consistency in your trading edge."
A positive risk-to-reward ratio, paired with a high win rate, is the backbone of any solid trading plan 📈🔐
⚠️ Losses?
They’re part of the mathematical game of trading 🎲
They don’t define you — they’re necessary, they happen, and we move forward 📊➡️
🙏 I appreciate you taking the time to review my Daily Forecast.
Stay sharp, stay consistent, and protect your capital
— FRNGT 🚀
OANDA:EURUSD

EURUSD FRGNT Daily Forecast -Q4 | W47| D19 | Y25 |📅 Q4 | W47| D19 | Y25 |
📊 EURUSD FRGNT Daily Forecast
🔍 Analysis Approach:
I’m applying Smart Money Concepts, focusing on:
Identifying Points of Interest on the Higher Time Frames (HTFs) 🕰️
Using those POIs to define a clear trading range 📐
Refining those zones on Lower Time Frames (LTFs) 🔎
Waiting for a Break of Structure (BoS) for confirmation ✅
This method allows me to stay precise, disciplined, and aligned with the market narrative, rather than chasing price.
💡 My Motto:
"Capital management, discipline, and consistency in your trading edge."
A positive risk-to-reward ratio, paired with a high win rate, is the backbone of any solid trading plan 📈🔐
⚠️ Losses?
They’re part of the mathematical game of trading 🎲
They don’t define you — they’re necessary, they happen, and we move forward 📊➡️
🙏 I appreciate you taking the time to review my Daily Forecast.
Stay sharp, stay consistent, and protect your capital
— FRNGT 🚀
OANDA:EURUSD

EURUSD: Consolidates in Low RangeEURUSD traded mainly in a low-range consolidation during the day, with insufficient upward momentum and constrained by multiple resistance levels above. In the short term, it is likely to continue oscillating within the 1.1570-1.1675 range. If it breaks below the 1.1560 support level, it may further decline to 1.1525. If it can stabilize above 1.1624, it may attempt to test the 1.1665 resistance level, though the probability of a breakout is relatively low.

EUR/USD Price Outlook – Trade Setup (EUR/USD)📊 Technical Structure
TICKMILL:EURUSD EUR/USD is consolidating near 1.1600, retracing from last week’s two-week high at 1.1656.
The short-term structure shows the pair trading inside a support zone at 1.1579–1.1586 and beneath a resistance zone at 1.1621–1.1628.
The recent break of the rising trendline suggests fading bullish momentum, yet buyers remain active above 1.1580, keeping the pair in a corrective phase rather than a full reversal.
A rebound toward the 1.1621–1.1628 resistance zone is likely if 1.1580 continues to hold. However, failure to defend this support would expose downside risk toward 1.1570 and potentially 1.1545.
🎯 Trade Setup
📌 Reversal Scenario (Aggressive)**
If price rejects the resistance zone (1.1621–1.1628):
Entry (Sell): 1.1621 – 1.1628
Stop Loss: 1.1631
Take Profit: 1.1580
Bias remains mixed but leaning bearish unless the pair sustains above 1.1630.
🌐 Macro Background
EUR/USD holds steady near 1.1600, with the U.S. Dollar struggling to extend its recovery.
FXStreet notes: “EUR/USD holds retracement near 1.1600 as markets turn cautious ahead of the U.S. NFP release.” 【FXStreet】
Key macro drivers:
🇺🇸 USD Side
The US Dollar Index (DXY) trades slightly lower near 99.45, reflecting lack of follow-through buying.
Investors are positioning cautiously ahead of Thursday’s September Nonfarm Payrolls (NFP), which could reset expectations for Fed policy.
Rate-cut expectations continue to fall:
→ December cut probability drops to 43% (from 62.4% a week ago), according to CME FedWatch.
This reduction in dovish pricing limits upside for EUR/USD.
🇪🇺 Eurozone Side
A majority of ECB officials maintain that interest rates should remain unchanged, citing balanced risks to inflation and growth.
This steady ECB stance offers mild support to the euro, but lacks strong bullish momentum.
Overall, EUR/USD remains supported on dips, but upside is capped by soft Eurozone fundamentals and diminishing Fed rate-cut expectations.
🔑 Key Technical Levels
Resistance: 1.1621 – 1.1628
Support: 1.1586 – 1.1579
Trendline Break Level: 1.1605
Psychological Level: 1.1600
📌 Trade Summary
EUR/USD is consolidating above the 1.1580 support zone, suggesting potential for a short-term rebound toward 1.1621–1.1628. However, unless price breaks and holds above the resistance area, the broader bias favours a downside continuation back toward 1.1586 or even 1.1579.
⚠️ Disclaimer
This analysis is for reference only and does not constitute trading advice. Trading involves significant risk, and proper risk management is essential.

EUR/USD: Momentum Break or Wave (4) – Prepare for a ReversalEUR/USD: Momentum Break or Wave (4) – Prepare for a Reversal
📈 Weekly Scenarios
Bearish scenario (correction): Price breaks support at ~1.1650 → wave (4) develops → possible decline to ~1.1550–1.1530.
Sideways scenario: The pair consolidates between ~1.1650 and ~1.1800, accumulating energy for the next trend.
Bullish scenario (momentum): EUR/USD holds support at ~1.1650 and breaks above ~1.1800 → wave (5) begins → target ~1.1900 and above.
✅ Conclusion
On the weekly timeframe, EUR/USD is at a key point for choosing a scenario:
Holding support at ~1.1650 and breaking resistance at ~1.1800 could trigger a new upward momentum.
A breakout below ~1.1650 signals a deeper correction by wave (4).
It's important to monitor the wave structure and price reaction at these levels before entering a position.

EURUSD Massive Bullish Breakout!
HI,Traders !
#EURUSD is trading in a strong
Uptrend and the price just
Made a massive bullish
Breakout of the falling
Resistance line and the
Breakout is confirmed
So after a potential pullback
We will be expecting a
Further bullish continuation !
Comment and subscribe to help us grow !

EUR/USD Price Outlook – Trade Setup📊 Technical Structure
TICKMILL:EURUSD EUR/USD is consolidating near 1.1590–1.1600, following a six-day winning streak. The pair is trading within a range bounded by support at 1.1559–1.1568 and resistance at 1.1628–1.1637.
The short-term chart indicates that bulls are taking a breather after the recent rally. A retest of the support zone could offer a buy-on-dip opportunity, with the broader trend still mildly bullish above 1.1550. A break below 1.1550, however, could trigger a pullback toward 1.1500.
🎯 Trade Setup
Idea: Buy on pullback near support zone.
Entry: 1.1559 – 1.1568
Stop Loss: 1.1555
Take Profit 1: 1.16258
Take Profit 2: 1.1637
Risk–Reward Ratio: ≈ 1 : 5.47
Bias remains neutral-to-bullish as long as the pair holds above 1.1550, with potential continuation toward 1.1650 if sentiment improves.
🌐 Macro Background
The EUR/USD pair is holding steady as traders digest the official end of the U.S. government shutdown and assess mixed Federal Reserve commentary.
FXStreet analyst Akhtar Faruqui notes that “EUR/USD stays near 1.1600 after the official ending of the U.S. government shutdown.” 【FXStreet】
U.S. Government Reopening: President Donald Trump signed the government funding bill on Thursday, ending a historic 43-day shutdown. The development lifted risk sentiment but offered limited support to the U.S. Dollar, as markets remain cautious about growth implications.
Labor Market Weakness: The ADP Employment Change report showed an average weekly job loss of 11,250 through late October, while Challenger, Gray & Christmas reported 153,074 job cuts in October, nearly triple from last year.
Fed Policy Outlook: Market pricing for a December rate cut has dipped slightly — now 60% vs. 67% a day ago, per the CME FedWatch Tool — following hawkish remarks from Fed officials Raphael Bostic and Susan Collins, who warned against premature easing.
ECB Stance: On the European side, ECB’s Isabel Schnabel reaffirmed that interest rates are “absolutely at an appropriate level”, signaling policy stability. She highlighted that the ECB remains focused on core inflation, which remains near target.
The macro landscape remains balanced, with EUR/USD supported by stable ECB policy and a still-soft U.S. outlook.
🔑 Key Technical Levels
Resistance: 1.1628 – 1.1637
Support: 1.1559 – 1.1568
Psychological Level: 1.1600
📌 Trade Summary
EUR/USD maintains short-term stability near 1.1600 as the euro finds footing on ECB confidence and a subdued dollar. While the end of the U.S. shutdown supports a mild risk-on tone, Fed caution limits USD recovery. As long as 1.1550 holds, buying dips remains the favored strategy targeting 1.1628–1.1637.
⚠️ Disclaimer
This analysis is for reference only and does not constitute trading advice. Trading involves significant risk, and proper risk management is essential.
