NIO mid-term TANIO is setting up bullish uptrend on daily, it's in the process, there's no confirmation as of yet but there's a positive divergence starting to appear which could be the first sign of bearish trend reversal. Short-term is in bullish formation now and the price could go higher from here.
EV

Mobileye 2026: Reclaiming the ADAS Throne with EyeQ6HMobileye (MBLY) kicked off 2026 with a decisive victory, securing a massive production deal with a top-10 U.S. automaker. This agreement integrates Mobileye’s "Surround ADAS" into millions of vehicles as standard equipment. The market responded immediately, sending shares up 7% in early January trading. This win signals a strategic pivot for the industry, prioritizing scalable safety over elusive fully autonomous dreams.
Geostrategy: Balancing the US-China Tech Divide
Global regulatory pressures are accelerating the adoption of Advanced Driver Assistance Systems (ADAS). Europe’s latest mandates for automatic braking and driver monitoring have forced automakers to seek rapid, reliable solutions. While Chinese OEMs lead in urban "Navigation on Autopilot," Western manufacturers are now fighting back. By securing a major U.S. player, Mobileye reinforces its position as the preferred partner for "Eyes-on, Hands-off" highway technology across North America and Europe.
Technology: The Efficiency of Heterogeneous Computing
The EyeQ6H chip is the crown jewel of this new partnership. Unlike competitors who focus solely on raw "TOPS" (Tera Operations Per Second), Mobileye emphasizes power efficiency and hardware-software co-design. The EyeQ6H utilizes a specialized architecture, including Vector Microcode Processors (VMP) and Deep Learning Accelerators (XNN). This design allows a single chip to process data from up to 11 sensors, enabling highway speeds of 81 mph (130 kph) with minimal power draw.
Business Model: ECU Consolidation and Cost Leadership
Automakers are currently struggling with the rising complexity of vehicle electronics. Mobileye’s "Surround ADAS" offers a way to simplify this architecture. By consolidating multiple driving and safety functions onto a single Electronic Control Unit (ECU), manufacturers can significantly reduce production costs. This business model appeals directly to mass-market brands needing to offer premium features without premium price tags. The current deal targets 9 million units, proving that Mobileye’s "democratization of safety" is finally scaling.
Macroeconomics: Navigating the Post-Shutdown Recovery
The 43-day U.S. government shutdown in late 2025 created a vacuum in regulatory approvals and economic data. As federal agencies resume operations, the automotive sector is bracing for a wave of new safety certifications. Mobileye’s proven track record—with over 200 million vehicles already using its technology—gives it an edge in this "bottleneck" environment. Investors view this new contract as a high-visibility revenue bridge that offsets previous concerns about slower robotaxi deployments.
Innovation and Patent Moats: The REM Advantage
Mobileye’s true competitive moat lies in its Road Experience Management (REM) data. Over 8 million vehicles currently harvest anonymized, crowdsourced mapping data globally. This patented approach allows Mobileye-equipped cars to "see" the road with centimeter-level precision without expensive LiDAR. This scientific advantage in localization and mapping makes their systems easier to deploy at scale than "vision-only" or "LiDAR-heavy" alternatives.

NIO A SQUEEZE STOCK, HOW LIKELY?NIO
Hi everyone,
Thx for reading.
Anyway, here is a quick chart to show a potential explosive move to the upside.
Will it occur 100%, not sure because there are slower paths to 27.
Why 27? A gap closure, fib numbers, return to high, fits pattern stuff like that.
Long term? Not a great buy because the jump to 27 might retrace pretty hard. Investing 100 at 27 means you only have 50 dollars at 13.5.
Nio has a legit gamma squeeze setup, but the real question is does it trigger.
The week of the 16th, theoretically, the options could run up to $20, which could mean see the price move to the 27 mark.

QuantumScape (QS): Cup-and-Handle Structure Intact – Handle LowsI wanted to share a technical perspective on QuantumScape (QS), as the Cup-and-Handle formation remains intact on the higher-timeframe chart.
From a pure price-action standpoint, QS has already completed a well-defined cup, marked by a rounded base following the prior drawdown, and is now trading at what appears to be the lower boundary of the handle consolidation. Historically, this phase represents controlled profit-taking rather than distribution, with volume typically contracting as weak hands exit and stronger holders accumulate.
Key technical observations:
The handle has retraced within acceptable Fibonacci bounds (generally 30–50% of the cup advance), preserving the bullish structure.
Price is consolidating above long-term structural support, suggesting the broader trend remains constructive.
Volatility compression during the handle phase often precedes directional expansion, particularly when aligned with improving sentiment or fundamental catalysts.
Momentum indicators on the daily/weekly timeframe are stabilizing, consistent with handle basing behavior rather than trend failure.
From a pattern-projection standpoint, the measured move of a confirmed cup-and-handle breakout typically targets the prior rim high plus the depth of the cup, which in QS’s case implies upside potential meaningfully above the $25 level once price resumes from the handle lows and reclaims resistance with volume confirmation.
In past market cycles, entries near the bottom of the handle have statistically offered some of the most favorable risk-reward profiles, provided the structure holds and invalidation levels are respected.
In short, the current zone appears to be a structural reset rather than a breakdown, and if the handle resolves to the upside as expected, QS has the technical setup to retest and exceed $25-$42 during the next impulsive leg.

NIO - Post-Earnings Pullback to 0.618 Oversold ZoneNIO Accumulation After Earnings Pullback: 0.618 Retracement + DeM Oversold Signal
NIO has pulled back into a critical accumulation zone following recent earnings, creating a textbook geometric retracement setup combined with oversold momentum indicators. This analysis breaks down why this pullback represents a structured portfolio addition opportunity rather than fundamental deterioration.
🎯 Setup Overview:
Current Price Action: Pullback to 0.618 Fibonacci retracement level
Technical Confluence: DeMarker (DeM) indicator showing oversold conditions
Context: Post-earnings profit-taking in established support zone
Position Type: Portfolio addition / accumulation entry
📊 Technical Structure:
0.618 Retracement Zone:
The golden ratio retracement level has historically marked the deepest pullback point before trend continuation in quality growth names. NIO's current price sits precisely at this mathematical level from the recent swing low to swing high.
DeMarker Oversold Signal:
The DeM indicator measures buying and selling pressure. Current readings show exhaustion of selling pressure, suggesting the pullback may be nearing completion. This technical oscillator complements the structural support from Fibonacci analysis.
Post-Earnings Pattern:
NIO reported solid earnings but experienced typical "sell the news" behavior. This creates opportunity:
Fundamentals improved (earnings beat)
Technical setup aligned (0.618 + oversold)
Emotional selling exhausted (DeM signal)
📈 Why This Pullback Makes Sense:
Earnings Were Positive:
NIO delivered results that met or exceeded expectations, yet price pulled back due to profit-taking and sector rotation. This disconnect between fundamentals and price action creates entry opportunities.
Structural Support:
The 0.618 level isn't arbitrary—it represents the mathematical zone where buyers historically step in during corrections within uptrends. Price has shown respect for this level in prior pullbacks.
Momentum Exhaustion:
DeM oversold readings suggest sellers have pushed price to an extreme. Mean reversion probability increases when technical oscillators reach these zones combined with structural support.
🎯 Risk/Reward Framework:
Entry Consideration: Current 0.618 retracement zone
Invalidation Level: Below the 0.786 Fibonacci level (deeper support)
First Target: Previous swing high (pre-earnings level)
Extended Target: Fibonacci extension levels above prior highs
Why Risk Is Defined:
If price breaks below the 0.786 level, the pullback becomes deeper than typical healthy corrections. This provides a clear invalidation point for the bullish thesis.
Why Reward Is Probable:
Post-earnings pullbacks in growth stocks with improving fundamentals often reverse sharply once technical oversold conditions are resolved and profit-taking concludes.
🛡️ Portfolio Addition Strategy:
Why "Portfolio Add" vs "Full Position":
This isn't a "go all-in" signal. It's a strategic addition to existing holdings or a new position sized appropriately for a growth stock with inherent volatility.
Position Sizing Approach:
Smaller position size than blue-chip holdings (NIO carries more volatility)
Scaled entry across the 0.618 zone (not lump sum)
Risk limited to 1-2% of total portfolio capital
Scaling Method:
First entry at current 0.618 level
Second entry if price tests 0.786 (deeper pullback)
Reserve capital for final add if maximum pain occurs but structure holds
📊 Technical Indicators Confluence:
Fibonacci Retracement:
Mathematical zone showing where pullbacks historically find support in trending assets.
DeMarker Oscillator:
Momentum indicator showing exhaustion of selling pressure. When DeM reaches oversold territory at structural support, reversal probability increases.
Volume Analysis:
Recent selling volume shows signs of climax rather than acceleration—typical of profit-taking bottoms, not fundamental breakdowns.
Support/Resistance:
Previous resistance zones now acting as support, indicating role reversal that often precedes continuation moves.
🧠 Trader Psychology: The Post-Earnings Trap:
Why Most Miss This:
After good earnings, traders expect immediate upside. When price pulls back instead, they assume "something must be wrong" and avoid the stock entirely.
The Reality:
Earnings beats often trigger profit-taking as early holders exit and new buyers wait for "better prices." This creates the pullback that becomes the better price.
Emotional vs Structural:
Emotional view: "Earnings were good but price is falling—stay away"
Structural view: "Earnings confirmed fundamentals, price at support—add position"
Historical Pattern:
Quality growth stocks frequently pull back 10-15% post-earnings before resuming uptrends. This isn't failure—it's opportunity for patient capital.
📈 Why EV Sector Context Matters:
Sector Rotation:
EV stocks experience waves of sector rotation as investors move between growth and value. Pullbacks during rotation create entry points before the next leg up.
NIO's Position:
As a leading Chinese EV manufacturer with improving fundamentals, NIO represents exposure to the electric vehicle transformation in the world's largest auto market.
Risk Acknowledgment:
Chinese equities carry geopolitical and regulatory risks. Position sizing must account for these additional variables beyond pure technical analysis.
📅 Timeframe Expectations:
Not a Day Trade:
Post-earnings consolidations can take weeks to resolve. This is a position trade, not a scalp.
Potential Catalysts:
Delivery number announcements
Sector momentum shifts back to growth names
Technical resolution of oversold conditions
Broader market stability
Patience Required:
The 0.618 level may be tested multiple times before resolving higher. Position sizing should accommodate short-term volatility without forced exits.
⚠️ Risk Considerations:
Volatility:
NIO exhibits higher volatility than large-cap U.S. equities. Daily swings of 5-10% are not uncommon. Position sizing must reflect this reality.
Geopolitical Risk:
Chinese stocks face regulatory uncertainty and U.S.-China relations risks. These macro factors can override technical setups.
Sector Sentiment:
If EV sector sentiment deteriorates broadly, individual stock structure may not hold. Monitor sector ETFs for confirmation.
Support Breakdown:
If price closes decisively below the 0.786 Fibonacci level, the pullback becomes deeper than healthy corrections typically allow. This invalidates the thesis and requires disciplined exit.
🏆 The Professional Approach to Growth Stocks:
They Size Appropriately:
Growth stocks get smaller position sizes than stable dividend payers. Volatility demands this discipline.
They Buy Weakness in Strong Names:
When fundamentals improve but price pulls back, professionals add. When fundamentals deteriorate but price rallies, they exit.
They Use Technical Structure:
The 0.618 level + DeM oversold isn't fortune-telling—it's identifying zones where probability tilts in favor of reversal based on historical patterns.
They Accept Uncertainty:
No one knows if the bottom is today, tomorrow, or next week. But at structural support with oversold readings after positive earnings, probability favors the long side with defined risk.
📌 Key Takeaways:
✅ Fundamentals + Technicals align: Earnings beat + 0.618 support + DeM oversold creates multi-factor confluence.
✅ Post-earnings pullback is normal: Good earnings don't guarantee immediate upside. Profit-taking creates entry opportunities.
✅ Portfolio addition, not speculation: This is sized as a growth allocation within a diversified portfolio, not a lottery ticket.
✅ Risk is defined: Below 0.786 invalidates the setup. No hoping, no averaging into a broken structure.
✅ Patience over prediction: The bottom may take days or weeks to form. Structure identifies the zone; time confirms the entry.
⚠️ Important Disclaimers:
This analysis is for educational purposes and reflects a technical view based on Fibonacci retracement levels, momentum indicators, and post-earnings price behavior. It is not financial advice or a recommendation to buy or sell NIO or any security.
NIO operates in a volatile sector and jurisdiction with additional geopolitical risks. The 0.618 support level could fail, and the DeM indicator can remain oversold during extended downtrends. No technical pattern guarantees reversal.
Chinese equities carry regulatory, political, and currency risks beyond typical equity investments. Position sizing must account for these additional risk factors.
Earnings results do not guarantee future stock performance. Post-earnings pullbacks can extend beyond typical retracement levels during broader market weakness.
Always conduct independent research, consider your risk tolerance, and consult with a financial professional. All investing involves risk of loss.
✨ Your Perspective:
Are you watching NIO or other EV names at these levels? How do you approach post-earnings pullbacks in growth stocks? Share your thoughts in the comments.
📜 Buy structure. Size appropriately. Trade with discipline.

EVGO - Divergence bullishThe EVGO ticker was oversold a week ago. Now it is starting to recover with average volume.
Some indicators suggest that this stock will rise strongly in the near future:
- Divergence pattern.
- The recent major low on the chart is higher than the previous low.
- RSI shows a bullish signal.
- MACD also shows a bullish signal.
The current price is below all the MA20/50/200 lines.
It will likely need one more reason to break out soon.
The price closed on 11/28/2025: $3.24 (Entry).
Price target: $3.69 / $4.14 / $5.18
Stop loss: $3.08
IMO, amateur trader.
Good luck!

10? May be for December?It's clear its bearish. Most likely it will go down this December as well. Maybe I will buy it around 10 and DCA on it if it goes down further. I think in the next 6 months this could hit $24 based on technical analysis.
Happy trading and not a financial advice.

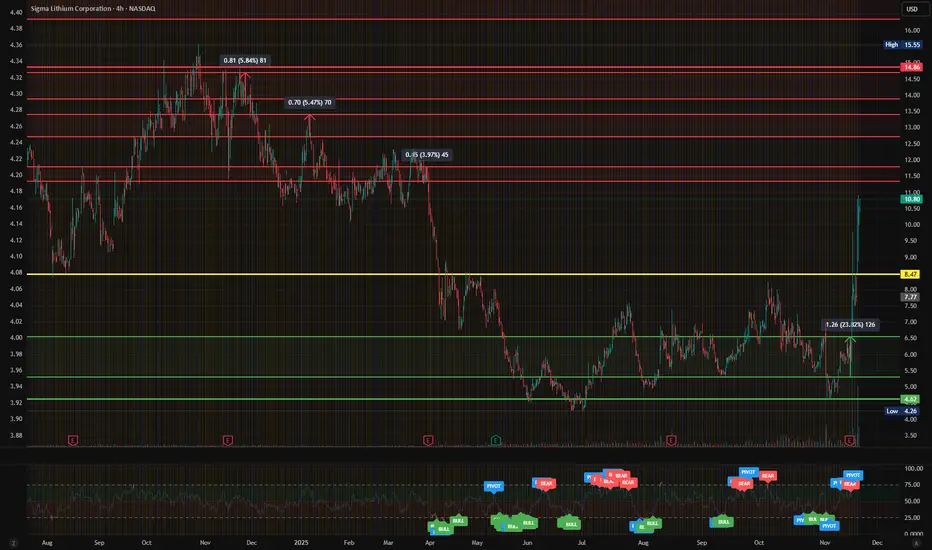
$SGML - Massive Lithium Surge! Momentum Targets $14.86 Next?NASDAQ:SGML has exploded through multiple resistance zones this week — breaking cleanly above $8.47 and extending into the $10.80 range with a massive +23% daily move.
This breakout comes after months of consolidation in the $5–$7 zone and now positions Sigma Lithium for potential continuation toward $14.86, a key structural resistance from late 2024.
The chart shows strong momentum and volume confirmation — a classic signal of accumulation turning into expansion.
Technical Overview
Support Levels: $8.47 → $7.50 → $6.20
-
Resistance Levels: $10.80 → $11.50 → $14.86
-
Structure: Long-term downtrend break confirmed; now trending inside a bullish expansion channel
Momentum: RSI at breakout threshold, rising fast; volume at multi-month highs
-
Trend Bias: Strongly bullish above $8.47
As long as NASDAQ:SGML holds above $8.47, this structure remains intact with upside potential toward the $14–$15 zone. A retest and continuation could confirm a full reversal pattern after a prolonged accumulation base.
Sector Context
Lithium names have surged across the board as investors re-enter the EV materials trade.
Sigma Lithium ( NASDAQ:SGML ) remains one of the key pure-play lithium producers with strategic exposure to Brazil’s Grota do Cirilo project — a critical supply source for sustainable battery-grade lithium.
This move aligns with broader sector recovery momentum seen in LSE:LTHM , NYSE:ALB , and $PLL.
💡 My Plan
Entry Zone: Retest near $9.00–$9.50
Targets: $11.50 → $14.86
Stretch Target: $15.55 (measured breakout projection)
Invalidation: Close below $8.47 = failed breakout / back to range
Momentum-based entries should focus on volume follow-through; early bulls are already sitting on triple-digit short-term gains.
NASDAQ:SGML just delivered a massive breakout from its long-term base 🚀
Do you think lithium stocks are back in play for 2026 — or is this a short squeeze before a fade?
Drop your thoughts ⬇️ and I’ll post a MyMI follow-up update with new price targets 📈
#SGML #Lithium #EV #GreenEnergy #Stocks #MyMIWallet #TradeAlerts NYSE:ALB LSE:LTHM GETTEX:PLL NASDAQ:TSLA
Follow for more real-time setups and weekly trade insights.
325 and then 800?Shaping up nicely to double next year. Most likely it will go down to 325 and if it can hold 325 then 800 coming next year most likely. If it looses 325 on a monthly basis then all bets are off.
Happy Trading. Not a financial advise.

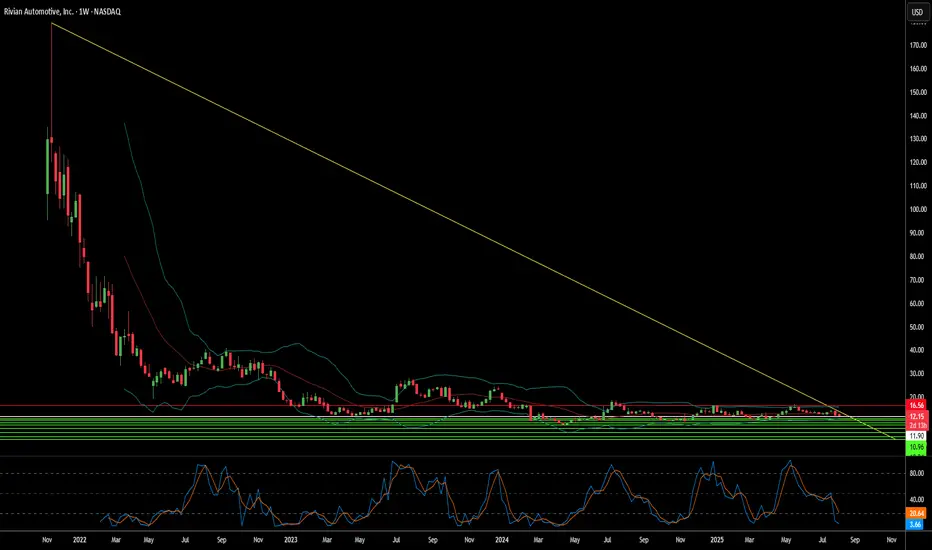
$RIVN – Long-Term Base Breakout Setup + Sector Rotation PotentiaRivian ( NASDAQ:RIVN ) is finally showing signs of life after years of basing out. This is one of those setups that comes along only once every few years — a multi-year base breakout forming as speculative money rotates back into the laggards.
🔹 The Setup:
Big earnings pop ignited the first real move in months.
After that surge, NASDAQ:RIVN has been flagging tightly for 3 days, digesting gains with constructive price action.
The structure here is clean — it’s coiling just under breakout levels, setting up a potential long-term trend shift.
🔹 Macro + Sector Context:
The alt-energy sector is heating up — solars have been leading, and that strength could spill into EV names next.
We’re in a speculative phase of the market where beaten-down names are catching rotation money.
NASDAQ:RIVN fits that bill — it’s been left for dead, but the tape is finally turning.
🔹 My Trade Plan:
1️⃣ Entry: Building a position off the flag near current levels.
2️⃣ Stop: Using the 9 EMA on the weekly chart as my stop — giving it room to breathe.
3️⃣ Account: Tossing this one into the longer-term accounts — not a scalp, this is a swing for the fences type play.
Why I Like It (Even Though It’s a “Turd”):
Multi-year base = massive stored energy.
The chart finally aligns with the macro rotation.
It’s not about loving the company — it’s about recognizing when the cycle flips in its favor.

XPeng 1W: cup under pressure, lid about to popTechnically , XPEV is still trading below resistance at 22–23 USD, forming a tight “cup & handle” pattern. The golden cross (MA50 > MA200) adds bullish weight, but there’s no confirmed breakout yet - only a test of the upper boundary. A weekly close above 24 USD would unlock upside targets around 35.6 and 41.6.
Fundamentally , XPeng keeps gaining momentum - October 2025 deliveries hit 42 k EVs (+76% YoY). The firm expands internationally and strengthens its China base, though profitability remains elusive due to heavy investment spending and price competition from BYD and Li Auto.
As long as price stays above 20–21 USD, the bullish structure holds. Losing that area would send the stock back into consolidation.
Sometimes the cup is ready, the handle’s forming - now all that’s missing is the boil.

FLNC: double top potential Price has reached the key macro resistance target and may be forming a potential double top.
As long as price remains below 22, I’m watching for the first leg of downside to unfold toward the 21dEMA, with potential for a deeper move if bearish momentum starts to build.
Chart:
Previously:
• On bullish macro potential (Sep 18):
www.tradingview.com
• On follow-through (Sep 22):
www.tradingview.com

NIO | China will Lead the EV BattleNIO, Inc. is a holding company which engages in the design, manufacture, and sale of electric vehicles. Its products include the EP9 supercar and ES8 7-seater SUV. It provides users with home charging, power express valet services, and other power solutions including access to public charging, access to power mobile charging trucks, and battery swapping. It also offers other value-added services such as service package, battery payment arrangement, and vehicle financing and license plate registration. The company was founded by Bin Li and Li Hong Qin on November 28, 2014 and is headquartered in Jiading, China.

13, here we comeLooks bullish and can hit 13. It may have massive pullbacks before it hits 13. Play safe and diversify.
Not a financial advise.

BYD flipping resistance to supportGood trade setup, defined stop loss. what was once resistance has now become support.

CATL’s HK Debut IGNITES EV Revolution Tesla’s Secret Weapon?🔥 CATL’s HK Debut IGNITES EV Revolution Tesla’s Secret Weapon?
BOOM! Chinese battery king CATL ($CATL.HK) just skyrocketed in its Hong Kong debut, defying Pentagon blacklists. Powering Tesla, VW, and Mercedes, it’s the EV supply chain’s 800-lb gorilla. Funds are pouring in for global domination miss this, and you’re sidelined!
⚡️ Pro Tip: EV stocks are heating up, but US-China tensions could crash the party. Watch NYSE:NIO , NASDAQ:LI too!
🚀 Share this if you’re bullish on EVs! What’s your top EV pick?

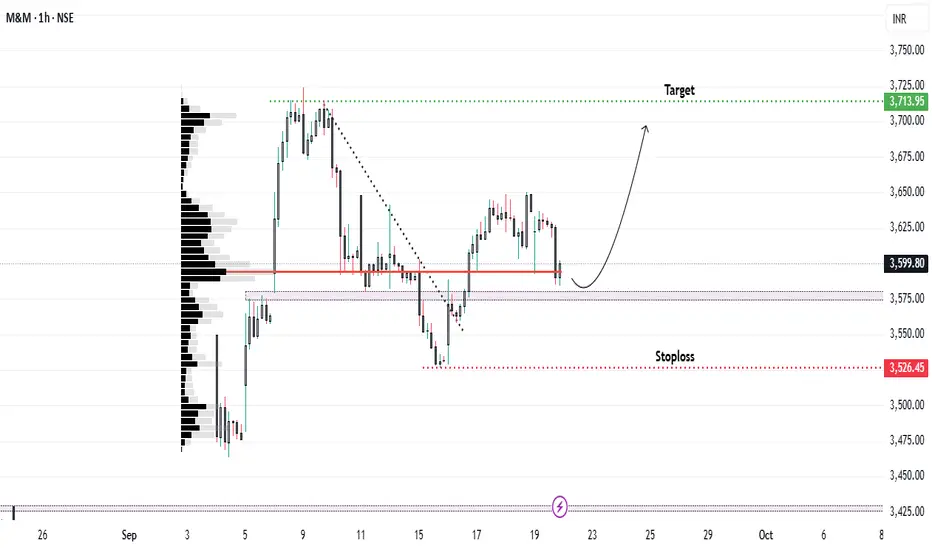
Momentum Rebuilds: Can M&M Hit Recent Highs...?On 8th September, M&M broke the previous day’s high and rallied nearly 4%. However, it soon entered a gradual downtrend on the hourly timeframe, holding the ₹3575 level (the high of 5th September, now acting as support).
After a day of consolidation, the stock broke below ₹3575 and closed beneath it. In the following session, it faced resistance at the same level but later broke above it again, suggesting a false breakout.
Currently, the stock is retesting this zone. The Volume Profile indicator shows a significant high-volume cluster around ₹3600, adding importance to this level.
📊 Trade Setup
* Entry: ₹3585
* Target: ₹3700 (recent swing high)
* Stoploss: ₹3526
⚠️ Note
Due to uncertainty around the US-India trade deal and developments in the auto sector, volatility may increase. Trade cautiously and manage risk effectively.
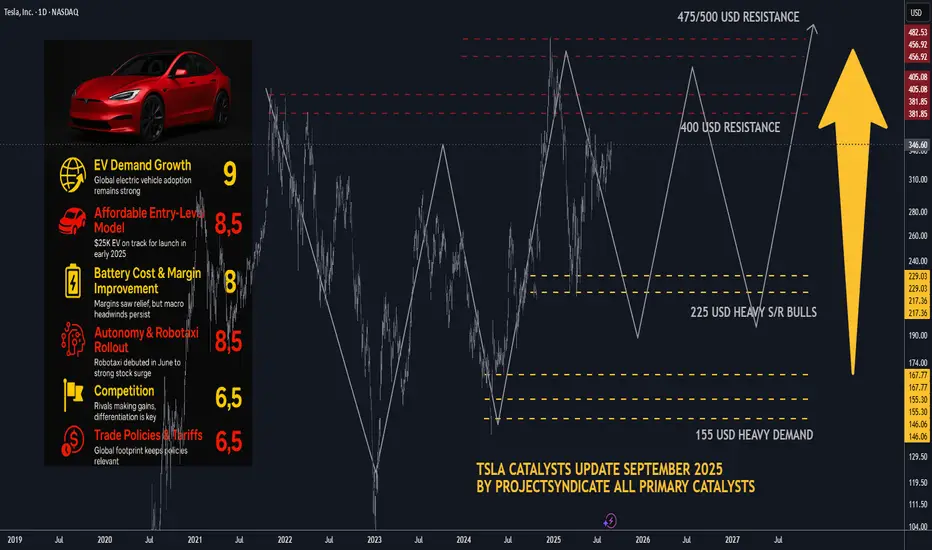
TSLA Catalysts Ranking: September 2025 update and Path ForwardHere's an updated/revised outlook for TSLA including all the primary
catalyst ranking and analyst ratings and overview of latest developments
this was updated for September 2025 with all the viable market data.
🤖1. Autonomous & Robotaxi Execution (↑ from 8.5 to 9/10)
• Why it matters: Tesla officially launched its Robotaxi service in Austin on June 22, 2025, deploying a small fleet of 10–20 invite-only Model Ys operating within a geofence and featuring human safety monitors..
• The stock rallied impressively—up 9%–11% on launch day..
• Regulatory scrutiny intensified as the NHTSA launched probes into delayed crash reporting and other safety concerns..
• Musk also touted FSD v14 as 2–3× safer than humans, with v15 aiming to be 10× safer—but cautioned debugging would take "several months.".
• Why the bump to 9/10? The real-world rollout is finally underway, drawing heavy investor focus—even amidst safety questions.
________________________________________
🌍2. EV Demand Growth & Geographic Recovery (holds at 9/10)
• Despite a 13% year over year global sales drop in H1 2025, future demand hinges on Amazon of lower priced models and tax credit extensions..
• Strong upward investor sentiment: TSLA is up 54% over the past year, despite being down ~16% YTD..
• Why still 9/10? Long-term EV momentum remains solid; a rebound may follow new launches or incentive shifts.
________________________________________
💸3. U.S. EV Tax Credits & Incentives (↑ from 6 to 7.5/10)
• The $7,500 EV tax credit—set to expire September 30—has been extended: now, buyers can qualify with a signed purchase agreement, even before delivery..
• However, expiration still looms and could dampen demand..
• Why bump to 7.5/10? The extension buys breathing room and could stabilize near-term demand.
________________________________________
📉4. Fed & Interest Rates (↑ from 5 to 6.5/10)
• On August 22, Tesla led a mega cap tech rally (up 6%+) after Fed chair hinted at possible rate cuts—lower borrowing costs may aid EV financing..
• Why improved score? Lower rates remain a key catalyst for big-ticket items like EVs.
________________________________________
🎭5. Affordable Entry-Level Model / Next-Gen Platform (holds at 8.5/10)
• Musk revealed the upcoming affordable model may resemble a Model Y and could launch slower than expected post tax credit expiration..
• The “next gen” platform—including the so called “Model 2/Q” or Cybercab—targets mid 2025 production..
• With delays likely, expectations remain high but execution risk persists.
________________________________________
🔋6. Battery Cost & Margin Improvement (holds at 8/10)
• Q2 margins improved modestly, supported by cost cuts and energy business growth..
• Yet, regulatory credits continue to decline (–51%), pressuring margins..
________________________________________
🤖7. Energy & AI Upside (new 8/10)
• Tesla is doubling down on autonomy and energy. Musk highlighted robotaxi, energy storage, and its humanoid Optimus robot, slated for early 2026..
• Wedbush’s Dan Ives sees Tesla as an “embodied AI compounder,” while William Blair estimates self driving could be worth nearly $1 trillion..
• This iterative AI and energy focus is a compelling re-rating vector.
________________________________________
📊 8. Safety, Regulatory & Governance Risk (↑ to 7/10)
• NHTSA’s probe into crash-report delays, plus ongoing FSD safety concerns, elevate tail risk..
• Musk’s political entanglements have had adverse brand impacts; while stepping back from new political initiatives helped marginally, skepticism persists..
• Added governance scrutiny and Musk’s external ventures continue to weigh on sentiment.
________________________________________
🚩9. Competition & Global Sales Slump (holds at 6.5/10)
• EV rivalry heats up, and Tesla’s European and Chinese market share slumped significantly.
• Still a notable headwind.
________________________________________
✅10. Commodities & Raw Material Costs (holds at 5.5/10)
• Volatile raw material prices continue to affect margins; hedges help but don't eliminate the risk.
________________________________________
🚀11. Macro & Trade Policies (new 6/10)
• Tariff risks and global trade instability persist. Musk has warned of “rough quarters” ahead linked to these macro risks..
• Considered separately, worth tracking but less immediate than others.
________________________________________
Updated Catalyst Scorecard
Rank Catalyst Score
1 Autonomous & Robotaxi Execution 9
2 EV Demand Growth 9
3 Affordable Entry-Level Model 8.5
4 Battery Cost & Margin Improvement 8
5 Energy & AI Upside 8
6 U.S. EV Incentives 7.5
7 Safety, Regulatory & Governance Risk 7
8 Fed & Interest Rates 6.5
9 Competition & Global Sales Slump 6.5
10 Macro & Trade Policy Risks 6
11 Commodities & Raw Material Costs 5.5
________________________________________
📊Analyst Ratings & Price Targets (Updated)
• Median 12-month price target: ~$303–$307, implying slight downside from current ~$346..
• High-end bulls: Dan Ives (Wedbush) at $500; Benchmark raised to $475..
• Cautious voices: UBS remains bearish at $215, saying robotaxi upside may be priced-in..
• Wolfe Research: warns near-term earnings estimates are too optimistic, free cash flow may remain under pressure..
________________________________________
🔍Recent Headlines You Should Know
• Robotaxi launch in Austin, promoting optimism but drawing scrutiny..
• FSD & Optimus focus, backed by bullish commentary like “embodied AI compounder.”.
• EV credit tweak buys time for deliveries and demand..
• Fed hinting at rate cuts, offering cyclical lift..
• Q2 earnings miss on EPS and revenue, but autonomy/energy pushed narrative..
________________________________________
• Bull Case: Robotaxi and AI drive restore investor confidence, pushing targets toward $475–$500.
• Base Case: Steady but cautious—watch for execution on autonomous and cost-efficiency.
• Bear Case: Renewed delivery slumps, regulatory blowback, or failed rollout could weigh toward downside support in the $300–$330 range.
NIO Trendline Break PossibleGood evening traders,
After NIO's rapid growth Pre-Covid, the company has failed to make a comeback. In my opinion this was due to its rapid growth and impulse move back in 2020. My rule with impulse moves is the market will tend to retrace 100% of its initial move.
Following the fall of NIO for the past several years, it has clearly been bouncing from a descending trendline and so far it has touched 4 times. I expect NIO to continue to drop, the $3.00'ish price seems to be a good price to enter with a possibility of it reach the $1.00 area. I'm expecting a breakout soon followed by a retracement back to the trendline and bounce up until is reaches the $27 dollar area. This is just the technical aspect of this analysis. Hope this helps some of you with your investments.
Don't forget to like and follow for more trading ideas & trading opportunities. Happy Trading!

Rivian major consolidation coming to a decisionRivian is in my opinion coming closer to a decision on a breakout or breakdown. I personally love Rivian - I own one, and it's my favorite car I've ever owned. Next year they're planning on launching a much more affordable mid size SUV (R2) that I think will drastically increase their sales. It brings everything that is great about R1S/R1T to a more affordable platform without losing all the great technology and things we love about the more expensive R1.
I see that opportunity and want to be in on it, however as a trader, I need a deal and Rivian at $12 is not it. So I'm hoping this consolidation will break down for an opportunity at $7. There have been people holding this stock for so long betting on another Tesla, and with any luck some of them will finally throw in the towel if this obvious symmetrical triangle breaks down.
And if not, and it breaks up then I'm happy for all those loyal fans who've been holding for years. I love my SUV and am excited for Rivian to keep making even greater cars.
It's hard to predict how this pattern will play out, that's why I'm personally waiting on the sidelines.
Good luck!

Can Rivian Survive the Perfect Storm of Challenges?Rivian Automotive reported mixed Q2 2025 results that underscore the electric vehicle startup's precarious position. While the company met revenue expectations with $1.3 billion in consolidated revenue, it significantly missed earnings forecasts with a loss per share of $0.97 versus the anticipated $0.66 loss - a 47% deviation. Most concerning, gross profit returned to negative territory at -$206 million after two consecutive positive quarters, highlighting persistent manufacturing inefficiencies and cost management challenges.
The company faces a confluence of external pressures that threaten its path to profitability. Geopolitically, China's dominance over rare earth elements - controlling 60% of production and 90% of processing capacity - creates supply chain vulnerabilities, while new Chinese export licensing rules complicate access to critical EV components. Domestically, the impending expiration of federal EV tax credits on September 30, 2025, combined with the effective end of CAFE fuel economy standards enforcement, eliminates key demand-side and supply-side incentives that have historically supported EV adoption.
Rivian's strategic response centers on three critical initiatives: the R2 model launch, the transformative Volkswagen partnership, and aggressive manufacturing scale-up. The R2 represents Rivian's pivot from niche, high-cost premium vehicles to mainstream, higher-volume products designed to achieve positive gross margins. The $5.8 billion Volkswagen joint venture provides essential capital and manufacturing expertise, while the Illinois plant expansion to 215,000 annual units by 2026 aims to deliver the economies of scale necessary for profitability.
Despite maintaining a strong cash position of $7.5 billion and securing the Volkswagen investment, Rivian's widened EBITDA loss guidance of $2.0-2.25 billion for 2025 and target of EBITDA breakeven by 2027 represent a high-stakes race against time and capital burn. The company's success hinges on flawless execution of the R2 launch, achieving planned production scale, and leveraging its software capabilities and patent portfolio in V2X/V2L technologies to diversify revenue streams beyond traditional vehicle sales in an increasingly challenging regulatory and competitive environment.
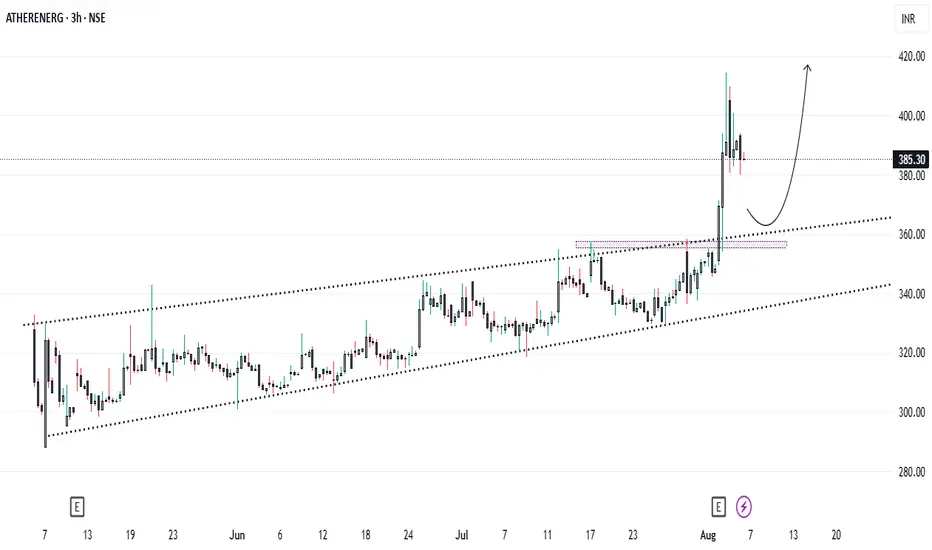
Ather Energy Breaks Out! What's Fueling the 13% Surge..?Since its stock market debut, Ather Energy had been gliding within a smooth upward channel until something major shifted this week. On the back of stellar Q1 FY26 results, the stock did something bold:
✅ Broke the channel
✅ Shot up 13% in a single day
✅ Hit a fresh 52-week high near ₹394
So, what’s driving this electric rally? And more importantly, what’s the next smart move for investors ?
🔍 Q1 Results: Narrower Loss, Explosive Growth
On August 4, 2025, Ather Energy dropped its first earnings report post-listing, and the numbers turned heads:
* 📉 Net loss trimmed to ₹178.2 crore (vs. ₹182.9 crore YoY)
* 🚀 Revenue surged 79% YoY to ₹645 crore
* 🔋 Vehicle sales jumped 97% YoY to 46,078 units
* 🛵 Family scooter “Rizta” became a hit, now 60% of total sales!
Management also highlighted better cost control, improved operating efficiency, and a margin boost of nearly 1,700 basis points YoY — a sign the business is scaling fast without burning as much cash.
📈 Chart Talk: Breakout Confirmed, Entry at ₹357 ?
Technically speaking, Ather had been moving in a classic ascending channel since its listing. But the Q1 numbers triggered a powerful breakout:
* ✅ Channel resistance broken
* ✅ Huge bullish volume
* ✅ Momentum carried the stock to ₹394 intraday
Now, for those waiting on the sidelines, the ideal entry opportunity could come around ₹357, where:
* The previous resistance could act as new support
* It aligns with 38–50% Fibonacci retracement
* A healthy pullback may offer a low-risk, high-reward setup
📊 Analyst View & Expansion Strategy
* 🏬 **95 new experience centers opened in Q1
* 🌍 Market share expanded to 14% pan-India, 22% in South India
* 🏦 HSBC initiated coverage with a ‘Buy’ rating and ₹450 target
Even amidst tough EV competition (Ola Electric, TVS, Bajaj), Ather is building a tech-driven moat with strong brand equity, energy-efficient performance, and now promising financials.
⚠️ What to Watch Out For
* 🔧 A temporary rare-earth supply disruption due to China’s export policy — management says risk is under control.
* 🧾 Still **not profitable, so long-term earnings trajectory needs close tracking.
* 🔋 EV sector competition remains fierce; execution will be key.
📌 Final Word: Wait for the Dip ?
Ather’s breakout is backed by both strong fundamentals and a bullish technical setup. If the stock pulls back to the ₹357 zone, it could present an excellent opportunity for those who missed the initial run.
📍Plan:
* ✅ Add to watchlist
* 🔁 Wait for pullback
* 🛑 Stop-loss below ₹340 (if entering at ₹357)
* 🎯 Short-term targets: ₹394 (previous high), ₹420+, ₹450 (HSBC target)
Ather is charging ahead. Are you ready to plug in ?⚡
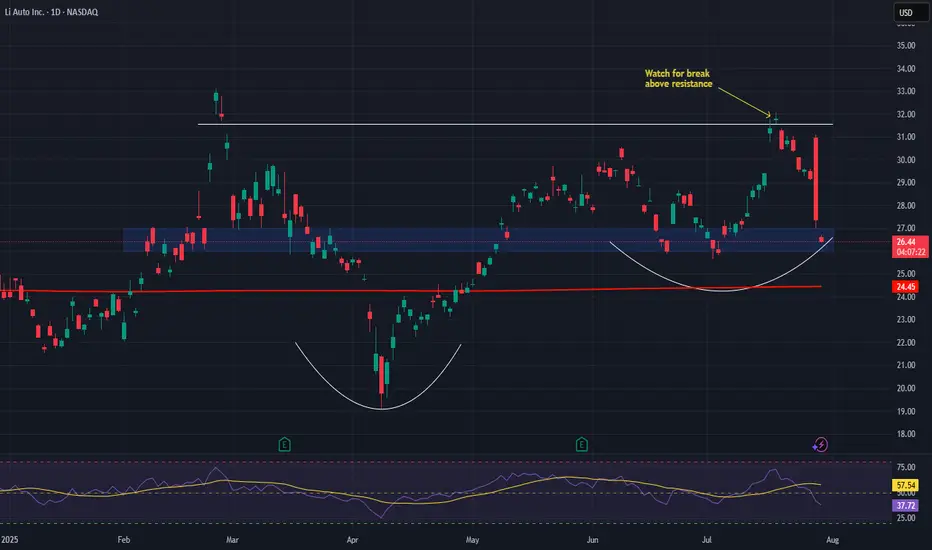
Li Auto (LI) – Gaining Speed as China’s EV PowerhouseCompany Snapshot:
Li Auto NASDAQ:LI is scaling rapidly in the Chinese EV market, combining expanding distribution, premium product strategy, and smart technology integration to capture high-value demand.
Key Catalysts:
Aggressive Expansion 🏙️
Now in 140+ cities, with strategic moves into lower-tier regions, Li Auto is boosting brand visibility and tapping into untapped demographics.
Premium Product Pipeline 🚙
New models like the MEGA MPV and upgraded L-Series SUVs are driving strong demand, lifting margins above 22%—a signal of its move upmarket.
Smart Tech Differentiation 🤖
Proprietary AI cockpits, voice command systems, and ADAS platforms elevate the customer experience, creating a clear competitive edge.
Execution at Scale 📈
With YTD deliveries surpassing 180,000, Li Auto is proving it can deliver both volume and quality—earning analyst upgrades and institutional backing.
Investment Outlook:
Bullish Entry Zone: Above $26.00–$27.00
Upside Target: $46.00–$47.00, fueled by premium positioning, tech innovation, and delivery momentum.
🔋 Li Auto is not just riding the EV wave—it’s leading it in China’s premium smart vehicle segment.
#LiAuto #EV #ChinaAutos #SmartCars #ADAS #AI #ElectricVehicles #TechStocks #PremiumEV #Mobility #InstitutionalInterest #GrowthStocks #LI