When Moon EWT? When Moon?My biased opinion has it that Energy Web Token will soon be orbiting space sooner than later. Hang on tight.....
EWT

Bullish ascending triangle on EWT !Nice consolidation, look very bullish to me !
Like always in this channel we look for quality assets, low volatility on the highest resistance, consolidation pattern & increasing volume !
Trade pre or after breakout depending on your strategy.
Don't forget to sell if the technical factors drop down.
Happy trading !

EWT ready to BLAST !!!EWT is looking ready to EXPLODE.... currently in ascending triangle and lots of volume coming in. get in guys, this is GOING TO THE MOON very soon....

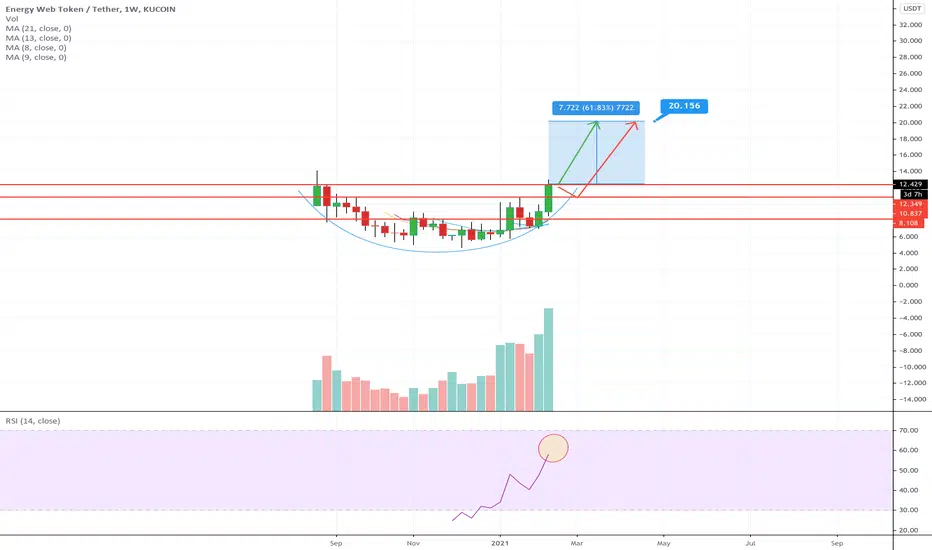
EWT READY FOR TAKEOFFEWT has painted quite a few nice chart patterns. There is a an obvious cup and handle but this looks to also be a large inverted H&S on the weekly time frame. Once we break the $18-19 range we should head to the $30+ range.
NOT FINANCIAL ADVICE

EWT bouncing once again from support trend lineEWT has been showing strong respect for this trend line that it has reached once again. Expect to see strong bounce around $19, which might be forming ascending triangle.
There is not much room left, the cycle is getting tighter.
If we are forming ascending triangle AND we break through, target is around $26.

EWT Breakout 18$ / Trigger Massive Run--- FUNDAMENTAL ---
Energy Web Token is a Cryptocurrency with massive potential.
It controls the renewable energy grid, the electrical car charging stations and many other.
It has huge collaborations with companies such as: VW, Hitachi, Iberdrola, E-ON, Shell... and many others.
The market has a lot to potential and it's not even in the 100 first market cap.
Just imagine if Tesla, NIO or any other electric car manufactures announces any deal with them.
When this crypto lands in other exchanges it will explode the bull run.
Staking it will be available in the next months.
It is a low carbon cryptocurrency and being adopted in many countries across the world, even the SEC has approved it.
--- TECHNICAL ----
In the past monts it made a beautiful round base before triggering and upside run.
Now is consolidating in a triangular shape or making the handle of the cup, as you wish to analyze it.
It has also a triple bullish divergence.
Enjoy!

This is my long tem GEM EnergyWebTokenPlease before investing, do your own research and invest money, you are ready to lose, if the project fails. I am ready to take the risks, are you? If yes, then welcome
Pare EWT/Bitcoin
My targets are shown on the graph, I trade 10% of my holdings, to make it more interesting for me. My final target is 0,0042 or $250 per token and still I will keep many, which is for me, more then %2000, as I had been accumulating from the bottom (0,00018)
Project is very promising Energy Web Token (EWT), exchanges to buy: KuCoin, Kraken, Liquid. I am sure once it starts pumping, we will see coibase, binance and many more exchanges listing this GEM!
Don't put all of your eggs in one basket, in case it drops. Good Luck

EWTUSDTsee and watch :)
The price closes in the daily time to a place where the price has not been closed before according to Price Action, and we seem to see a good growth ...

Energy Web - Next Leg UpEWT has created a very similar pattern that in my experience has been very bullish. A lot of cryptos form this slanted M pattern usually before going parabolic. Sorry this isnt the most technical chart but I do believe this will play out. Target $25+.
Not financial advice.

EWT breakout towards $25EWT did breakout of huge triangle. Next goal is at 1.618 fib which is about $25.
Top 20, here we come.

EURUSDDOUBLE ZIG-ZAG has ended now, wait for entry point which will be TREND REVERSAL .
upper trendline is resistance and we know once a resistance of downtrend has broken , uptrend starts and vice versa.
____________________________________
THANKS (-_-)
---------------------------------------------------

UNITY - Correctional Finished - Up only as they sayUnity has likely finally finished its last leg down in the form of a fifth wave extension. Likely we turn around from here.

$BAC Bank of America WXYXZ from GFC 2009 lows. short X w/in X^2not sure where X completes within X^2.. the Y wave is too complex for me.. i dont think its completing 5-5-3 from the march 2020 lows. would like to see others counts from march lows. we approaching a top but where is it likely to occur..? i don't see much in terms of fibonacci confluence.

EWT pre-pump before CEX listingEWT forming ascending triangle. EWT is is still waiting on tier 1 CEX listing so this could be pre-pump before that happens.

EWT to 24$EWT broke its all time high, look for retest of its ath and confirm it as support, that will be our buying zone and will hold it for another 100% move.

EWT Broke Bear trend and could reacht for ATH (like DOT did)EWTBTC breaking Downward beartrend/falling wedge with a strong bullish divergence (1Day)
Missed a couple of beautiful entries but now added 50% and will stack on the way down. SL under top of wedge.


$EWT Parabolic Soon????$EWT chart is setting up very nicely. Looking to close the weekly candle about the pointed out resistance. If we are able to close the week above the line. Look for EWT to go into price discovery mode and pump hard. Energy sector has been heating up around the world all year. Yet the blockchain energy sector has yet to pump. Let's see.
NOT FINANCIAL ADVICE

EWT drawing another bull flagEWT is something i have been following for long time. I have high hopes for this one and i see it in top 20 alt coins before no time.
EWT is currently drawing another bull flag.


DEFI INDEX - Correction Around the cornerHere we have a wave extension - within an extension. This move might seem lethal for a short time period, but it's the correctional wave 4 - we'll see more upside after it finishes on this correction.
