BLSH - Lil Dip Big Rip? (Wave 4)Overall Count looks to put us at consolidating for a wave 4 before a final 5 movement, now given this was an IPO stock, the long-term wave-count is not very clear so I can't even give this an average wave-count rating.
Will have to see really how it does here, because if price falls through the floor down to sub $60 level we're in trouble likely for a whole new set of lows. Otherwise, there's a chance for price to recoup above $100+
Wave-Count Confidence: Below Average
EWT

BULL - VERY Bullish SetupBULL seems to have finished a very elongated correctional ABC to it's first impulse which of course came to a stop at the ATH anchored VWAP point, this is very typical to see in stocks preparing for a breakout.
The structure is incredibly clear here, even on the micro-count (I didn't include that here for simplicity's sake) sadly, I've moved too many funds around and need to wait a day to have settled funds, so I can buy into this. The short-term is unknown (next day or 2) but guarantee you be end of this week or beginning of next one, this stock will be TAKING OFF!
Wave-Count Confidence: STRONG

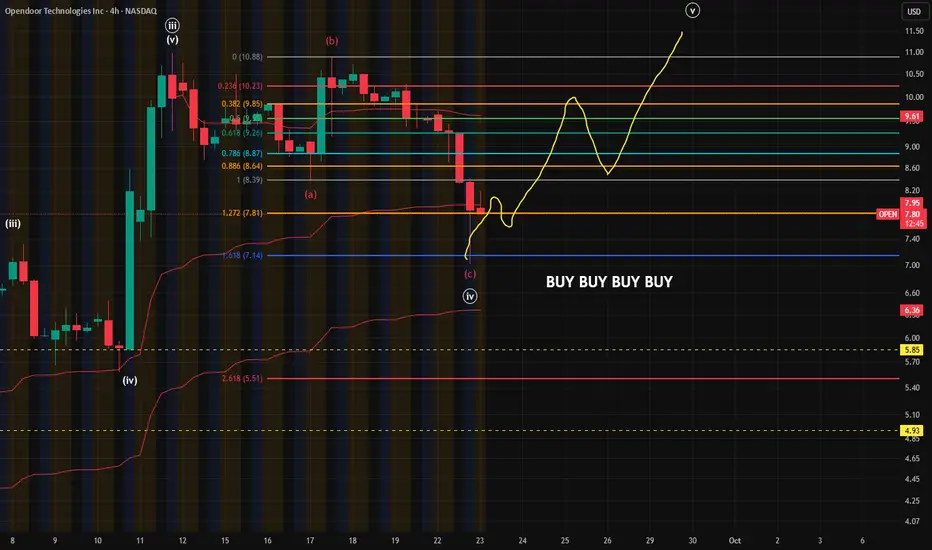
Buying OPEN on the openOPEN has been on my watchlist, and I was waiting for a clearer picture. This wave-count I'll admit is not the best and in-fact may be a little forced, part of my immediacy to buy is I've been waiting for a pullback greater than 20% to buy into. Basically, what I'm saying is; solid chance I'm too early for this entry, but with the 1.618 extension touch in pre-market, I'm buying into this on the open.
Wave-Count Confidence: Average
QS - A New Initial ImpulseQS has come out of a multi-year bear trend with very significant volume and fundamental changes to back this massive trend change. With the announcement of their speculative new battery tech, and the display from dugati motors displaying their technology in practical work, it's started a run on this historically heavily shorted stock. Currently short interest is roughly 10.26% of the float.
Wave-Count confidence: Medium/Average
I am worried at the retest of this key VWAP we may see some short term unexpected downside, and there are some worries I have with some of the short-term price structure to this move. That's why I'm keeping the rating at a medium. If this count is correct, QS should see a move higher than $15+ by a steep margin.

BTDR - Breakout is Inevitable Now, this is originally a SPAC corporation, as such historical price movement is abnormal and choppy, so I do not have the long-term wavecount. However this is what I do know:
Structure on the initial impulse is CLEAN.
Condensing VWAP zone (origin of those points is ATH and SPAC merger date)
It looks like price is getting ready to form a third-wave extension to take us to $20 (oh look an analyst firm said $20 a share whaaaat)
However, with no long-term wave-count I can only give this
Wave-Count Confidence: Medium/Average

NVTS - New CEO, New ImpulseBeleive me I looked at this for a minute. Had to confer with my trusted closed confidant ChatGPT even. Why you ask? Because in a WXY correction - W often equals Y, not all the time, but it's considered a good rule of thumb.
However, it's also semi-common to see Y = 0.618 * W - and in that scenario, it just about fits. This last Y wave has really been drawn out and volume is starting to pick back up. Also I have a decent long-term wave-count for this.
Due to the irregular WXY wave structure though, this gets
Wave-Count confidence: Medium/Average
PS. That double VWAP resistance is deadly, and key VPR resistance is currently above us right now. We've already tagged it as resistance but that's to be expected. We currently have a lot of resistance above our head, don't jump in just yet just watch and be ready.

UNH - Awaiting Dip OpportunityUNH seems to have lagged a little even with S&P at all time high's, I'm a big fan of this stock long-term, but I always like to be able to buy on a pullback. Would love a retest of this trendline ccoinciding with that key VPR zone from earlier consolidation. Those 2 points meet October 8th, interested to see what happens, if we see a pullback as listed I'm hopping in to make some serious pennies.
Wave-Count Confidence: Below Average/Weak
Unfamiliar long-term structure, and overall odd's are weak for this playing out. But a man can wish.

NNE - Awaiting Entry Opportunity NNE has a solid bullish setup, I wish I had been paying attention to this over the last month because this setup to breakout over the past week would've been very easy to read.
Confidence on this Wave-Count: Medium/Average
No pullback that's 6%+ till we see $41 a share imo, well have to see, very significant VPR zone at $35.90 that we just seemed to completely ignore. Would like to see a retest here and if we do I'm hopping on.

XRP - Small Dip Before a Big RipVery surprised at how obvious it is to read this price action on XRP, tells me there's a lot of attention/people and volatility involved with this.
Expecting to finish a small wave 4 before a decent breakout.
Overall Wave-Count Confidence: Average

TON - About to be worth a TON of moneySeeing a few of these easily identifiable trend changes, expecting bears to likely fight the first bullish move back hard after hitting both local high VWAP +Resistance trend line, but after that I suspect swift bullish movement. Very clean chart overall.
Overall Wave-Count Confidence: Above Average

HBAR - Short-term DownsideHBAR looks to be setting up to make a C wave down to complete it's first impulse/corrective reaction. I'm cautious that we might see one last bullish surge before price breaks down.
Wave-Count Confidence: Weak
While you can take a bet on the downside, more looking for this to be a good setup in a golden long. if this plays out, the long to follow will be perfect.

PENGU - New All Time HighsPENGU appears to have finished a W-X-Y correctional and is beginning a pretty solid new set of impulsive waves on the interest rate cut today. Pretty solid count as a whole, I don't have the long-term wave-count logged here but it does seem to be in the midst of a wave 4-5 transition, so this next move should be powerful but also followed by a formidible correction.
Price: 0.35+ easily, unsure of how high it will go
Wave-Count Confidence: Above Average

DXY - Dollar Extended Wave DownNow, I am not one familiar with FOREX, and I'll start by saying, that this wavecount isn't the most likely especially with expected rate cuts on the horizon. We could have bottomed on the low the dollar made in June, however, that structure appears clearly corrective and I cannot ignore the solidity of it.
Again, we could transfer into a double or triple three to finish this last move, it's too soon to fully tell.
Just using this chart for context to my other plays not taking any trades.

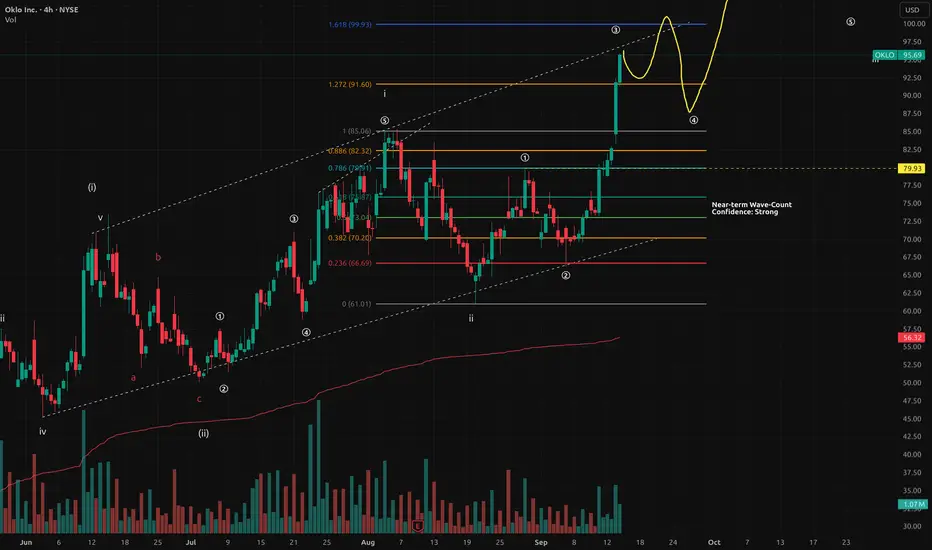
OKLO - Awaiting EntryOKLO is on the precipice of $100 a share, and on the heels of a rather volatile move up. The nuclear industry as a whole has been taking off over the last week. Looking for a mini-expanded flat to contradict the zig-zag we had on wave 1-2.
I am not in this stock currently, just posting this chart as it eyes the level I'm looking to enter. That level being $88-$84, will see how structure plays out.
Wave-Count Confidence: Strong
WARNING! Alternate wavecount is present that shows a potential expanded flat in progress, if that's the case price goes down to sub $61.00 - I feel chances of that are very low given this structure and overall count though.
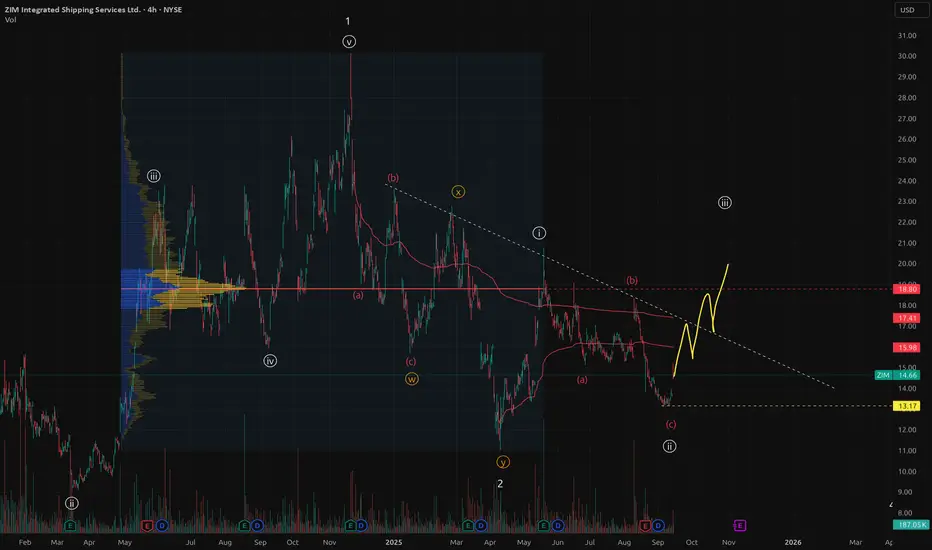
ZIM - New Impulse beginning a third Wave?ZIM appears to be at the beginning of a Wave 3, now this stock has very large and variable dividends. That leads to some VERY hard to track/unusual price action and can muddy a wave-count plenty. For that reason:
Wave-count confidence: Weak
I also have a few alternate wave-counts to this, so betting on this being the bottom with so much over-head resistance is a bit of a gamble, however, stop-loss is tight at the invalidation point. The point where this goes from being a gamble to nearly a sure thing is when price solidly crosses the trend-line of death you can see price get rejected at so many times.
APLD - Near-term upside, entry coming upAPLD is near the end of a very solid and strong third wave impulse to the upside.
With this end nearing and the price territory of the end of wave 1 being so near, it makes me give this Wave-count confidence rating: Weak
I will be waiting to see what structure and price action comes in the next few weeks, there may be a decent trade to be made out of this though

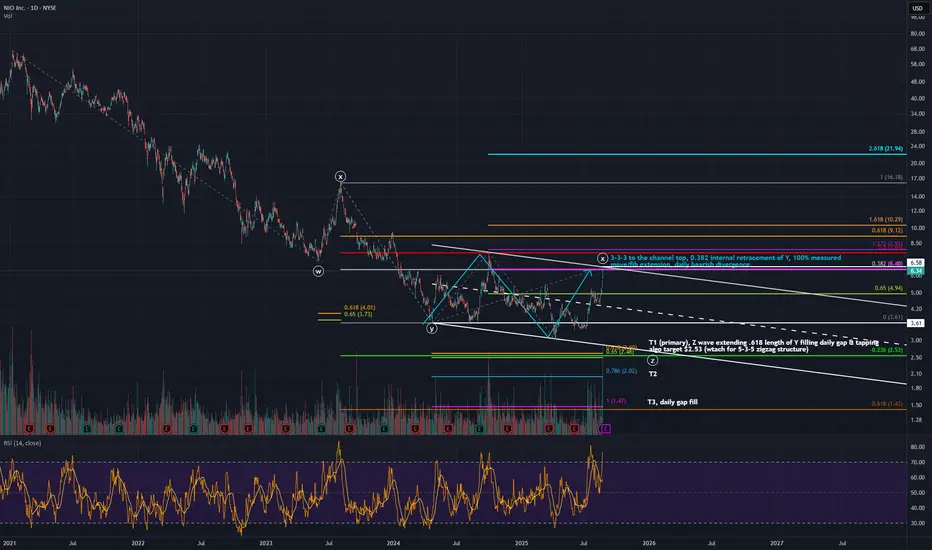
$NIO Your updated road map for Nio stockSee the notes in the chart. We will also have a major correction in the S&P500 in the coming months and I think it might be challenging to have a moonshot with Nio as the overall market is collapsing.
EWT Will Melt Faces: Why This Time Is DifferentThe crypto market is maturing. The era of pure speculation is giving way to real-world value. In this new paradigm, where major institutions are now involved, UTILITY will be king. One project is perfectly positioned to dominate this new age: Energy Web Token (EWT). As the world scrambles for sustainable energy solutions and the energy transition accelerates, Energy Web is building the digital backbone to make it all happen.
The attached chart isn't wishful thinking; it's a visualization of an inevitable shift. The accumulation phase is over. The explosive, utility-driven growth is about to begin.
The Indispensable Role in the Energy Transition
The urgency of the energy transition is undeniable. We face rising energy needs and the critical imperative to reduce our environmental footprint. Energy Web is at the forefront, offering an open-source, decentralized technology stack to fast-track the move to a low-carbon, customer-centric energy system.
Their mission is to decarbonize the global electricity system using blockchain. They achieve this by enabling distributed energy resources—from rooftop solar panels to electric vehicles and large-scale batteries—to be managed on the grid in a decentralized way. This creates a more flexible, participatory energy market where every user can be both a producer and a consumer.
An Ecosystem of Heavyweights
What truly sets Energy Web apart is its staggering ecosystem of over 100 partners, including titans of industry like Shell, Vodafone, Volkswagen, and Siemens. These aren't just names on a website; they are active collaborators, including major grid operators like Elia in Belgium and Stedin in the Netherlands, all working to implement and accelerate the commercial adoption of Energy Web's technology. These global partnerships underscore the immense trust and conviction that the biggest players in the energy market have in Energy Web's solutions.
Live Products with Real-World Impact
Energy Web isn't selling a dream; it's delivering live products that form the core of its ecosystem:
Energy Web Chain (EWC): An enterprise-grade public blockchain tailored for the energy sector. Since its launch in 2019, it has processed millions of transactions for groundbreaking applications.
Energy Web Decentralized Operating System (EW-DOS): A full stack of open-source software and standards designed to connect and manage the billions of low-carbon assets that will make up the grid of the future.
Green Proofs and Data Exchange: Solutions that bring deep transparency and verifiability to emerging green product supply chains, such as Sustainable Aviation Fuel (SAF). Companies like United Airlines and Amazon are already using this technology.
Energy Web X (EWX): Leveraging Polkadot's powerful and flexible infrastructure, EWX is the next generation of Energy Web's technology. This migration enables customized, enterprise-grade solutions with enhanced security and interoperability, allowing partners to accelerate their decarbonization strategies.
The Numbers: Market Cap and Price Roadmap
As of July 16, 2025, Energy Web Token (EWT) has a market capitalization of approximately $49.7 million USD, with a price of around $1.65 USD. The circulating supply is about 30 million EWT out of a maximum of 100 million.
While no price forecast is a guarantee, the outlook is incredibly bullish. Some analyses suggest potential prices of 40.63 or even more.
These predictions are rooted in the fundamental growth of the network. The 2025 roadmap is packed with milestones, including the rollout of fiat payment integration, the launch of SmartFlow 2.0 and 3.0, the implementation of EVM support on EWX, and the execution of numerous customer and EU-level projects.
The Inevitable Shift to Utility is Here
The chart attached to this idea shows a classic pattern: a long consolidation period followed by a parabolic rise. This is not a coincidence. The market is maturing. The days of projects with no substance are numbered. Large institutional players, now entering the space, are seeking sustainable, fundamentally sound investments.
EWT is precisely that. It solves a real-world, global problem. It has a working product, an unparalleled network of partners, and a clear vision for the future. The shift to utility is the next great wave in the crypto market, and Energy Web Token is poised to ride it to unprecedented heights.
The great separation is coming. Projects built on hype will fade. Projects that create tangible value, like Energy Web, will not only survive—they will dominate. Get ready, because EWT is poised to melt faces. This time, it's different.

Energy Web Token—EWT—Triple Recovery: 1000% PP (TAC-S7)All right, here we are.
I appreciate the insistence and support, I like people who never give up. It is a stressful work but I will always comeback and give you what you want. I hope you enjoy the analysis.
Energy Web Token produced a bearish impulse starting May 2024, it ended in April 2025, almost an entire year. This is the last ABC on the chart. The market was sideways and then we have this correction.
Now that the correction is over, we can expect a change of trend.
Current action for EWTUSDT is happening above the August 2024 low. Also above the November 2024 low.
The correction was strong but even stronger where the last two weeks. EWT recovered almost six months of bearish action in just two weeks. This strong bullish momentum gives us a clue of huge rising potential in 2025.
The week before last, 5-May, EWT started trading around $0.687. It went full blown bullish and broke its November 2024 low resistance. The week that followed, 12-May (last week), started red and this resistance was tested as support and holds. Then again, strong bullish momentum and EWTUSDT moved above its August 2024 low. This is a major, major bullish development.
The current weekly session/candle, while pretty young is also good. It started red and wicked lower. The wick did not reach the August 2024 low support but reversed sooner. This is another strongly bullish development and can signal that there will be additional growth this week, next week, and so on.
Trading volume becomes really high in October and November last year and this is also really good because the action is happening above those prices. So the market went through a final full flush, removing all the stop-loss orders and weak hands and is now ready for long-term growth.
The signals here are very, very strong. We don't need to consider the bottom dynamics, the rounded bottom and such because prices are the same now as back in September 2024, which is exceedingly good.
The market dropping for years on end, it seemed like forever, means that there is no need for this Altcoin to move back down again. Don't get me wrong, there can be corrections and retraces based on the short-term, but, when it comes to the bigger picture, we are going up.
I plotted several targets for you on the chart. The main one goes to 1,000%. If you were to calculate this same target coming from the market low, total growth potential amounts to ~2,900%, really strong.
This is it for now. Thanks again for your continued support.
Namaste.

EWT Falling Wedge = Up up up We are finally nearing the end of the sadistic falling wedge and will skyrocket into the moon and then mars
Patience is key. Wait for the breakout.
Stochastic RSI and every indicator is looking fantastic
(not financial advice)

PYPL Long OpportunitySimple EWT in play -- finally retested the top of the previous lower range, finishing the formation of the broader inverse H&S pattern.
Will update with more fundamentals as I continue research, but feel the e-commerce competition is overblown and the company is generally undervalued.

Energy Web - This cycles Energy sector playIm going to be breaking-down what I feel are the best long-term holds in each sector/category of crypto. Starting with the energy sector. I will tell you the pros and cons of each project.
Energy Web
EWT can beak out of this 4 year long downward trend/channel. There is a ton of upside potential. EWT has many strategic partnertships and completely flown under the radar. Once long term disgruntled holders are out. This project could definitely fly. Especially once the energy narrative begins to pick up. I took a postion around $1.32. I think that this project definitely has $20+ potential. One of the major downsides to the project is that the CEO has esentially been missing in action for a while with no explanantion. Even without the CEO is appears the team has been consistently builing.
The price action of this token has been pretty stagnant but that can all change in a blink of an eye. In my opinion this project has bottomed out and offers much more reward than risk at this level.
None of this is financial advice. This is just all my opinion.
Thanks for viewing my post! Best of luck to all traders!!!

Origintrail TRAC Long: EWT Analysis & Cycle Peak Targets
+ Impulsive Parallel Channel
+ Possible overextended Wave 5 count now?
The target is the peaks of the parallel channel, confluence with the fib extensions targets.
Last Rally for Cycle Wave 5 topping around Nov/Dec 2025 being a blow off top.
