Exide india in breaout? As per my analsyzi exide india i string support , finishes its retracement. 223 is my analsis tArget
Exideindustries

Exide SellExide seems to break trendline. There is also a divergence in RSI. Sell Exide @CMP (420) with SL of 427.4 and target of 405 & 393

Sell ExideExide seems to break short-term trend line. Also there is a divergence in RSI. Sell Exide @CMP (420) with a SL of 427.40 and target of 405 & 393.
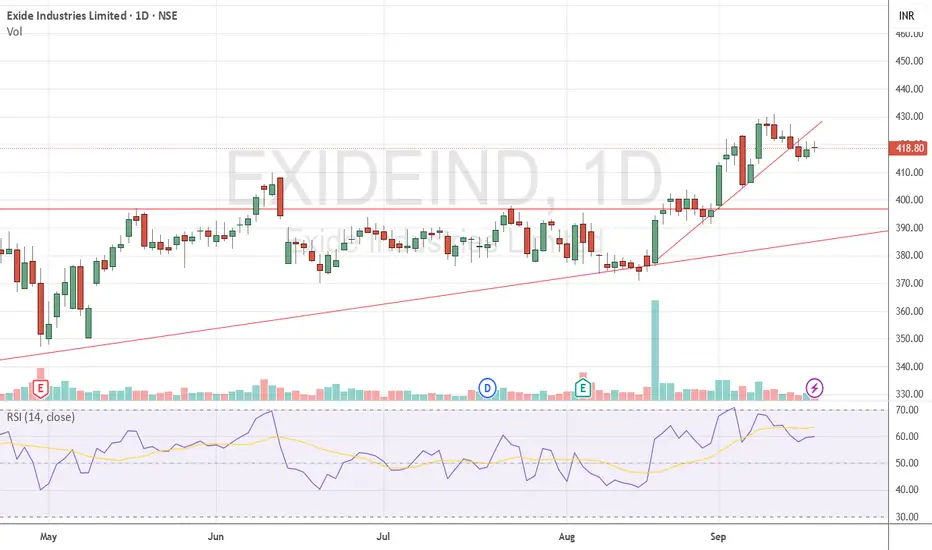
Exide Industries good reversalor the last 2.5 months, Exide Industries was stuck in a tight range between 370 and 400. Every time it tried to cross 400, sellers pushed it back down. This zone had become a big barrier for the stock.
But in the last few sessions, something changed. The stock finally managed to hold comfortably above 400–405, which was not happening earlier. This move is important because it not only cleared the neckline resistance but also confirmed a consolidation breakout after months of sideways action.
Now, as long as Exide stays above 395–400, the trend looks positive. The breakout has opened the path for the stock to test 425 first, and if buying momentum continues, we could see levels of 435–440 in the coming days.
To stay safe, traders can keep a stop-loss below 390.
✨ In short: After months of waiting, Exide has broken free from its range. Sustaining above 400 is a bullish sign, and the stock now looks set for 425–440 levels.
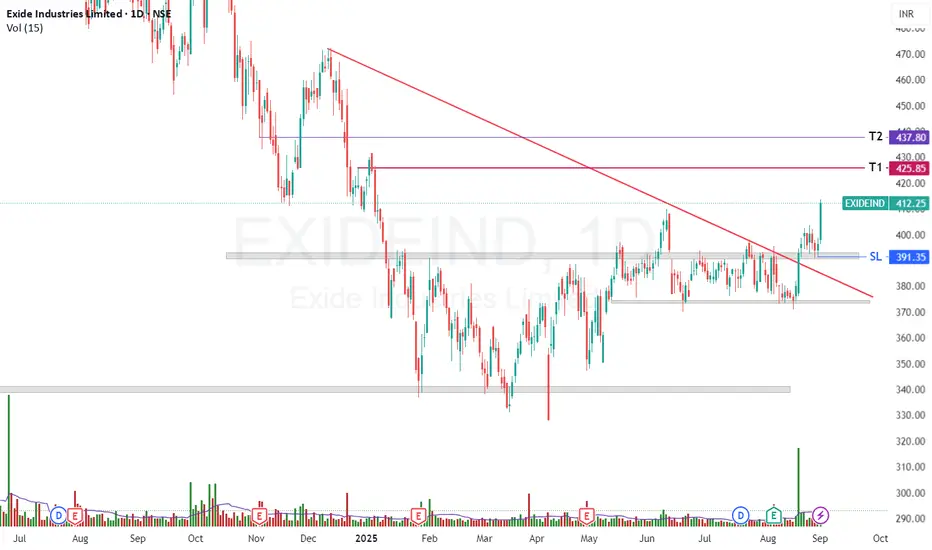
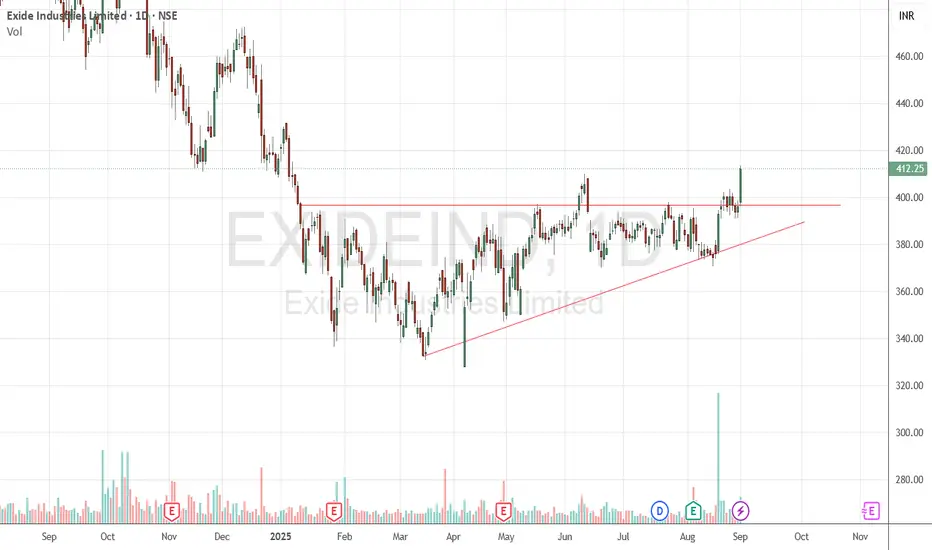
Exide BuyExide seems to break out of triangle pattern, preceded by high volume green candle. Buy @CMP (412) with SL of 391 and target of 435, 470 & 530
exide updateIt seems that exide industries has completed a sequence of the 5 wave upside (terminal impulse) and we are correcting against these 5 wave completed. As the terminal impulse has a quality that it may retrace to 60-78% of the upside move, a rectangle is placed for the correction completion indication, the longs may be initiated in the rectangle area, we will then start a wave 3 upside.
This is an update to the earlier published idea.
this is not a buy or sell recommendation and is to be considered as an educational idea.

Exide Industries Set for a Bullish Rally, Target ₹577.75Exide Industries is showing a strong reversal and bullish momentum after a 10-13% correction, making it an attractive buy for swing traders. Currently trading at ₹502.40, the stock is poised to rally ahead of its quarterly results, with a target of ₹577.75 and a stop-loss at ₹465.60.
Key Technical Insights:
The stock is in a bullish reversal after its recent correction, suggesting that upward momentum is regaining strength.
Multiple RSI indicators are above 60, confirming bullishness on both the weekly and monthly charts.
Unlike most other stocks and indices that saw a 4-6% correction last week, Exide Industries remained bullish, a sign of strong relative strength in the current market.
With quarterly results due on 04 November, the stock may see a pre-results rally, similar to the more than 10% rally it experienced after the previous quarter’s results.
Conclusion:
Exide Industries presents an excellent swing trading opportunity, with a target of ₹577.75 and a stop-loss at ₹465.60.
The bullish momentum, both technically and in anticipation of upcoming results, makes this stock a strong pick in the current market environment.
Disclaimer: This is for educational purposes only and not financial advice. Please do your own research before making any investment decisions.

THIS IS EXIDEIND FOR LONGTERM INVESTMENTAs we can see stock is not very bearish as per volume fall and price fall.
Stock trading above 20 50 100 200 ema on the day
on weekly and monthly chart double bottom formation
a bullish crossover on daily and weekly
Golden crossover on 20th Oct
1st-time breakout attempt with heavy volume but can not sustain about 175
2nd-time breakout rounding bottom with good volume and sustain above 175
RSI65,
stock can retest as shown in the chart plan accordingly. in the chart, there are two long positions you can make but you the different risk-to-reward ratios you'll get.
educational purposes only!


Exide - Elliott Wave CountExide - Elliott Wave Count
Exide seems to have completed its correction and started a new upward impulse wave with a target of 300. However, if the market drops below 240, this view is invalid.
Please note that this information is solely for educational purposes, and it is essential to exercise caution when trading.
NSE:EXIDEIND NSE:EXIDEIND1! BSE:EXIDEIND BSE:EXID1!

Exide DailyExide Industries Ltd, is an Indian multinational storage battery manufacturer company, headquartered in Kolkata. It is the largest manufacturer of automotive and industrial lead-acid batteries in India and the fourth largest in the world.
Only for Educational purposes.

Exide industries technical dekho Exide Industries stock technical analysis matched with EV demand in 2023 to 2026
technical
demand
fundamental
battery leader
alll match with exide so every dip CALL or ce or future trade karo 3 sal tak uptrend breakout ke baad
apni sujbuj se karo

EXIDEIND--Consolidation ??Observations::
-------->> the stock is consolidation for more than a week, and today showing large sell off,
and now price is @ demand zones, keep track this levels 185.if price breaks 185 level it will reach 182 and 180 levels. keep on buy side from here.
-------->> We have strong buy ness is observed in these levels, look for buying at these levels. keep track this levels.

EXIDE INDUSTRIESHi friends this stock is looking bullish for me with good risk reward ratio i hope it is usefull ....
in daily time frame

EXIDE breakout Exide can give a great breakout and are very bullish after that .
Buy Exide at 183.5
Target 190 195
Sl 180

ExideInd1!27-11
Daily chart of ExideInd1!
Manual trend and 200 EMA are bullish so the strategy stands at buy on dips.
Expect a strong breakout if the resisting trendline is breached because the resistance at 186.40 was broken and the bullish candle is a strong one.
Multiple supports at 176.80 & 166.05 (manual) and 162.25 (200 EMA).
Wait for a dip or wait for a breakout to trade.

Exide IndExide Ind 1 day chart it is making bullish wedge pattern in which it breaks and take a restest and now it looks bullish

EXIDE INTRADAY BREAKOUT STRATEGYWaiting for Exide breakout in intraday to take long position, here is the 15Min chart with some support and resistance.


Exide: Nothing exciting anymore - SELLThe NP run rate of 200 after the one off profits in March quarter. Stock in a downward channel since Jan 2021.

EXIDE INDUSTRY Exide industry is now one day chart trad a resistance line so we waite and watch a these stocks when resistance line brak than we buying log tearm and not a break a line we short these stocks. Thankyou

EXIDE Pray for EXIDE.
can go in the phase of bear market.
Formation of head and shoulder chart pattern on monthly time frame.
Important range 140-145.
If sustains below this level then can test next Fibonacci level of 0.786 at 66.50.
