Why Your Next Trade Means Nothing
🧠 The Notebook Process #2 — Understanding the True Nature of Trading.
Some laws govern everything we do, and trading is no exception, even if it often feels like pure chaos.
Every tick looks random. Every trade feels unique. Yet beneath that noise, a hidden law quietly shapes your results. It’s one of the cornerstones of statistics, and it rules every trading account on Earth: The Central Limit Theorem.
Don’t worry, no math coming your way: just an intuitive truth you can plug directly into your trading mindset.
📖 The Nature of Trading.
Your true profitability, your average win or loss, only begins to emerge and, more importantly, stabilize after a large number of trades.
That’s it. That’s the law.
A single trade? Meaningless. Ten trades? Still noise.
Hundreds of trades? That’s where the truth starts to show. What you see after enough repetitions isn’t randomness anymore: it’s your edge revealing itself.
That’s the Law of Large Numbers and the Central Limit Theorem in motion: pure science.
☑️ What This Means for Traders.
Your system’s real strength, its expectancy, only appears through repetition.
A handful of trades? Still luck. Pure variance, random ups and downs that mean nothing.
A few hundred? Now you’re seeing skill: the signal rising above the noise. In plain English:
“A trading journey can only be evaluated after a large number of trades. That’s why your process matters more than your last result, no matter how good or bad it looked.”
And that’s exactly what The Notebook Process #1 was about: 👉 Evaluate in blocks, not single trades.
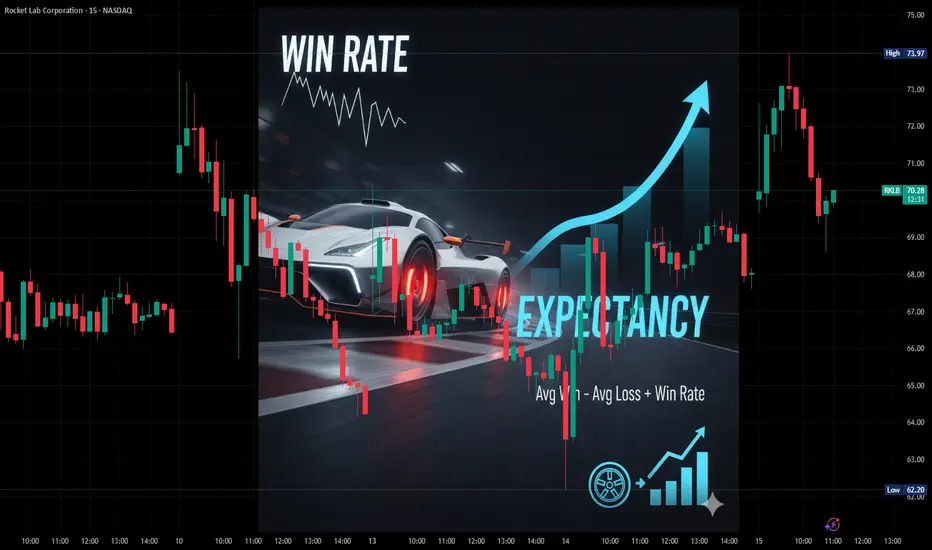
💸 Let’s Put the Law to Work:
1️⃣ Take your trading record and compute: Average win, Average loss, and Win rate.
2️⃣ Calculate your expectancy using this simple formula:
(Avg Win × Win Rate) – (Avg Loss × (1 – Win Rate))
3️⃣ That number tells you how much you make (or lose) per trade on average, and more importantly, what you can expect to make in the future.
If it’s positive, you’re trading with an edge. Keep going: reproducibility is what makes it stable.
If it’s negative, stop immediately. The bleeding won’t stop until the math changes.
That’s it. Pure math applied to trading: and believe me, you don’t want to fight this law.
🌍 The Gravity of Trading.
The difference between a trader who understands and one who only tries isn’t talent, it’s focus.
Focus on expectancy, not the win rate, not the reward to risk ratio.
It might seem basic, but so is gravity, and like gravity, it governs you whether you believe in it or not.
Expectancy

Why Win Rate Lies: The Metric That Keeps Traders BrokeWhy Win Rate Lies (and What to Measure Instead)
Everyone loves a high win rate. Every newbie dreams of having a 75%+ success rate.
But here’s the trap: your win rate only tells you how often you’re right, not how much you make when you are. Even worse, focusing on win rate puts you on the wrong path: trying to predict outcomes instead of focusing on what really matters: being profitable.
Let’s dissect this a bit.
As a quantitative trader, I know I can design hundreds of systems with a 75% win rate. It’s simple: take frequent, small profits and place wide stop losses. Voilà, your win rate looks great on paper.
The problem? Those small wins can’t save you when that one big loss hits. The math doesn’t forgive.
Building a truly profitable system is much harder, because you need to balance the trade-off between win rate and risk/reward. A system that wins often but loses big doesn’t have an edge, it just has good marketing. See the futility in chasing high win rates?
The real path is focusing on expectancy.
Expectancy not only accounts for win rate but also includes your average win and average loss, capturing the critical balance between how often you’re right and how much you gain or lose when you are.
Chasing a high win rate is like designing a race car and spending all your money on the engine. It’ll hit top speed on the straights (your wins), but without investing in decent brakes, you won’t look so great when the first corner arrives.
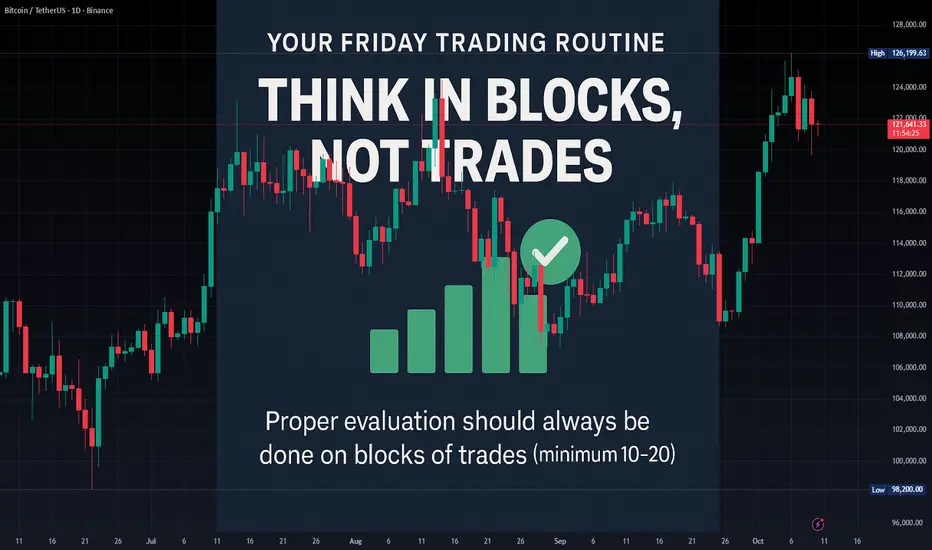
The Process Notebook #1 — The Successful Trader’s RoutineThe Successful Friday's Trader Routine: Evaluate but Think in Blocks, Not Trades
Another trading week is about to end. For most traders, Friday means checking wins and losses. For professional traders, it means evaluating the system.
💡 Remember: a single trade means nothing.
Proper evaluation, to avoid emotional bias caused by variance, should always be done on blocks of trades (minimum 10–20).
But here’s the real twist: If you’re judging your system only by Win Rate (WR) or Reward-to-Risk (RR)… you’re missing the real picture.
A robust trading system needs to be monitored through a small set of key metrics that reflect not just how much you earn, but how consistent and reliable your edge truly is.
Here’s the minimum you should be tracking 👇
📈 Return Metrics (How much your system makes)
Expectancy (average return per trade): quantifies the true profitability of your edge.
CAGR (Compound Annual Growth Rate): shows long-term compounding efficiency.
Payoff Ratio (avg win / avg loss): evaluates quality of your wins vs. losses.
📉 V olatility & Risk Metrics (How stable your system is)
Standard Deviation of Returns: measures the variability of your outcomes.
Max Drawdown: identifies the deepest pain your account can face.
Recovery Factor (Net Profit / Max DD): shows resilience and system efficiency.
⚙️ Consistency Metrics (How repeatable your process is)
Sharpe Ratio: return per unit of volatility — higher = more efficient risk use.
Win/Loss Streak Distribution: reveals your emotional endurance threshold.
Trade Frequency Stability: checks if your system behaves consistently over time.
🧠 Why this matters
When you evaluate your trading in blocks (using statistics, not emotions), you detach from the noise and connect with your system’s real performance.
You stop judging yourself trade by trade… and start thinking like a risk
manager.
How do you evaluate your system — by emotion or by metrics?
TA Never Fails, But Traders Often Do
Why Technical Analysis Doesn’t Fail, and How to Make It Work for You
Has it ever happened to you that your system or technical analysis gives you the perfect signal… and the trade still goes wrong? And then, other times, with the exact same pattern, everything clicks magically and you end up with textbook profits, the kind proudly posted on social media.
Every trader has felt that same confusion at some point. At some stage in their career, every trader has questioned whether technical analysis really works. And if that question still lingers unanswered in your mind, this post is for you.
Here, I’ll walk you through why technical analysis sometimes seems to work like magic and other times fails miserably, and, more importantly, how understanding its true role can turn it into a tool that meaningfully strengthens your trading
Understanding the Real Role and Reach of Technical Analysis
At its core, technical analysis (TA) studies past price and volume behavior. But here’s the key point many overlook: expecting it to predict the future with certainty is like assuming that because something happened under certain conditions once, it will play out exactly the same way again. That’s rarely true.
When you rely on a chart pattern or setup, what you’re really hoping for is that the market environment hasn’t changed much. But markets don’t stay still. They are dynamic, adaptive, and constantly shifting. That’s why sometimes the “perfect” signal delivers textbook profits… and other times it collapses into a loss.
I’m sure you can relate: you spot the perfect setup, take the trade with full confidence, everything looks aligned, and then Powell makes a comment, volatility spikes, and your stop is hit in seconds. Did technical analysis fail? Not really. The conditions changed, and the past environment could not be reproduced.
From this perspective, TA stops being a deterministic tool (“if price breaks support, the market will fall”) and becomes a probabilistic one (“if price breaks support, there’s a certain probability the market will fall”). This isn’t a weakness, it’s an honest recognition of the uncertainty that governs financial markets and their ever changing nature.
When we strip away the myths and put technical analysis in its rightful place, it becomes clear: at best, TA allows us to frame probabilities, never certainties. It’s not a crystal ball, it’s a framework for making informed probabilistic assessments in a world that will always remain uncertain.
Where the True Power of TA Really Lies
Take the classic example: “if price breaks support, the market has a higher probability of falling than of rising.” That statement doesn’t promise certainty, but if it turns out that, say, 60% of the time the market does fall after breaking support, then you’ve uncovered something valuable: an edge.
And here’s where trading shifts from chasing luck to building consistency. If out of every 10 trades, 6 follow through in your favor, then all you really need is solid risk management, for example, keeping a minimum 1:1 risk to reward ratio. Do that, and over the long run you don’t just “sometimes win,” you run a system with a positive expectancy.
Once you’ve found that edge, the real trick is repetition. And this isn’t just motivational talk, it’s math. Statistics has a law (and in science, a law means tested truth) that guarantees the more you repeat your process, the closer your actual results will move toward that expected 60/40 edge. With discipline and patience, the math will always pull you back toward being a long term winner.
This also means you don’t second guess yourself the next time the market breaks support just because the last time it didn’t work out (thanks, Powell). You keep playing your probabilistic edge. The outcome of a single trade is irrelevant, what matters is the process repeated over time. I wrote about this earlier, and it’s worth remembering: consistency in applying your edge always beats obsessing over one result.
TA as a Compass, Not a Crystal Ball
The smartest and most effective use of technical analysis is not to predict exact prices, but to build a probabilistic edge.
TA only becomes truly powerful when it’s integrated into a system with positive expectancy, not when it’s treated like an oracle. It’s not about guessing where the next tick will land, but about shaping a repeatable process that, over time, compounds into long term gains.
Seen in this light, TA stops being a magic wand and instead becomes a compass, a steady guide to help you navigate with consistency. You don’t need to know the exact shape of every curve in the road. What you need is a reliable compass and a clear map that, with enough repetition, will get you to your destination.
How to Make TA Not Fail You
The key takeaway is simple: the problem isn’t that technical analysis “fails,” but how we interpret it and what we expect from it. Demanding certainty only leads to frustration and blinds us to its real value.
Used probabilistically and as part of a structured system, TA becomes a valuable ally. So the next time that ‘perfect setup’ fails, don’t waste energy asking what went wrong. You already know, it’s just uncertainty doing its job. Don’t let it shake your confidence, and don’t let Powell, or anything else, ruin your day. Instead, focus on the next repetition, because that’s where your edge truly lives.
The market doesn’t owe you certainty. But with an edge and discipline, probability will reward you with consistency, and that’s what compounds into real results
________
👉 If you’d like to dig deeper into this mindset shift, check out my earlier post on True Laser Vision, where I explain why projecting the value of your account is infinitely more powerful than trying to project the price of an asset. And if you’d like a more structured walk through these ideas, visit my profile, you’ll find plenty of posts where I break down how probability, expectancy, and discipline can catapult your trading to the next level. Follow along if you want to keep sharpening these skills
EXPECTANCY: The Golden Key StatisticWhat is Expectancy?
Expectancy is the one of the most important statistics in trading. Expectancy is how much you expect to make per trade. If you have an expectancy of 0.3 that means you make 30% of your average risk per trade. If you risk $1000 per trade, then you would receive $300 on average for EVERY time you took a trade.
The baseline for a worthwhile & profitable strategy for most traders is an expectancy of 0.25 or higher. Anything more than 0.5 is outstanding.
How do you calculate expectancy?
A few different ways:
(gross profit/# of trades)/Avg. Risk
or
((Win%*Avg. Win)-(1-Win%*Avg. Loss))/Avg. Risk
The table on the chart breaks down the required Win% and Profit/Loss ratio needed for an expectancy greater than 0.25. As you can see there are multiple ways to build a profitable strategy.
What does Expectancy tell you?
Expectancy is a crucial stat for traders because it lets them know if their strategy is valuable. The only way to know your expectancy is to track your trades! Tracking your trades is an essential part of the job as a trader yet many fail to do so. It can be done for free with some simple spreadsheet formulas and a bit of time. Track your trades, review your stats, improves your trades. Rinse & repeat.
Thanks for reading, follow @Jlaing for more educational post about Money Management, Trading Stats, and more. I also stream a stock day trading chat room every morning at 9:15 EST right here on TradingView, come check it out and say what's up.

I think I just wrote a book. PF, RR, WR, etc.Intro, you can skip this part but I think it would be interesting for you to take a quick look:
Statistics estimates and formulas? Trading is mostly about emotions, not statistics estimates and formulas.
Most people do not need all of those formulas, they don't need to make plenty of stats and estimates, but just focus on discipline and emotion control.
I got this quote: "The key to trading success is emotional discipline. If intelligence were the key, there would be a lot more people making money trading."
I agree. Analysis of broker data has shown over and over that over a couple of years 90% or more clients lost money, and often all of their money.
So no point doing stats & formulas for 90% of people that will lose anyway.
What they need most is discipline, to not lose all of their money, but rather just some of their money, and emotional control, to not blow their brains out once they lose everything.
I can make a few quotes too:
Checking a thing quickly...
Stanley Druckenmiller was 46 when he did something stupid with the dot com bubble.
George Soros started at 29 and his biggest (known) mistake was Stanley Druckenmiller.
Oh this one is interesting....
Alot of profitable ones that got really confident after a few years of winning and got wiped out or made huge losses or missed on much returns (Buffet says BRK cost him 200 billion, he'd be way above Jeff Besos). I see alot of late 20s to early 30s. But even older than this after decades, it's never safe, never let your guard down. But most typical is the ~30 yo guy that made lots of money for years and laughs hysterically at noobs (retail traders mostly) and was warned of dangers by people trying to scare them away but proved every one wrong, knew he was at the top, one of the best in the world, so got really arrogant, dropped his guard down, and then boom.
By the way, totally unrelated, should I all in short USO? It's losing money over time and already so many idiots "invested" in it. There can't possibly be more morons that would buy this dead crap right? Lmao USO investors, what a bunch of brainlets. I refuse to lose against idiots just by being outnumbered. All in no SL. 😁
How do I start a show so I can do literal pump and dumps legally like Joseph Granville?
Good. Now that we got this out of the way.
1- Winrate
Pretty simple here. All this shows is what percentage of bets are winners. Doesn't really account for breakeven, doesn't differentiate between small wins big wins. Pretty useless on its own. Implicitly means that every win and loss have the same size, like putting rigid entry target SL, and never touching it.
2- Reward/Risk
How big is the average or expected win, compared to the typical loss. How much are you willing to risk and how much do you expect to make?
Most "educators" repeat how important the risk to reward ratio is, and it kinda is, because it is one of the best predictor of success.
FXCM published some data where they show that over the 3/1/2014 to 3/31/2015 period (1 year), 53% of their clients with a RR of 1 or more were in the green, while only 17% of those without were.
47% of RR >= 1 lose money. 83% of RR < 1 lose more. Their typical win % over a quarter is 25%, and the typical global win % over a year is around 20%.
I would be willing to bet that profitability goes up significantly with reward to risk. Some of it would of course be simply because people that end up with a huge win on their hands balloon the high RR stats.
That said, I doubt just flipping a coin, just randomly buying with a tight stop and a far away target would work. Althought...
The top myfxbook systems are almost all automated garbage systems with an average win 0.20 times the average loss, that were really lucky over a long period (3 std dev of a normal statistical distribution = 0.3% 3/1000, just pick any trash system with high WR and run a binomial probability calculator find the odds of it making profit over 100 rolls). Hey I'll do this later in this idea.
And as I was saying, perfect transition, flipping a coin isn't a viable strategy, the reward to risk alone doesn't say it all, even if traders using a high reward to risk ratio greatly outperform those that don't. If you make 10 times what you lose, but you lose 99% of the time, emm how to say...
And this is why we must look at the profit factor.
3- The profit factor. Oh yes
Pf = (W*R)/(1-W)
I have seen reports with a gross PF of almost 3, and net of barely 1.1.
If you design a strategy you count spreads in it... It's obvious.
Day trading sucks and every analysis of day traders data shows about 1% or less make money, and don't make much.
Probably the only ones making anything are level 2 scalpers, and 'experts' selling day trading robots, or signals, or courses.
First a disclaimer! The argument of day trading having terrible profit factors applies to 95% of the time.
When the average move per unit of time goes way way up (spreads & commissions usually don't especially if volume goes up too),
and you get in 5 hours what you usually get in 2 weeks, then obviously it's different.
I focus my argument on 95% of the time, when volatility is "normal" (within 2 st dev basically, and in particular within 1 - ~70% of the time)
And I have been really nice here.
Getting an idea of what good profit factors are...
If I participated I would take a single bet with huge leverage and hope to get lucky, easy win once every couple of events, but I doubt they allow this.
Lol on the worldcupchampionship site (ran by the CME I think), there are categories, Futures traders at the top have massive returns, way above Forex.
Previous year winners with futures have bigger returns than FX, but this year is just stupid. maybe they blow up soon.
Top 5 FX participants as of May 14 have 40% to 97% returns. Top 5 with futures are already at 200-800%!
In 2018 futures winner made 250% FX winner made 200%, sometimes futures traders make huge gains. The gap is already so big lol. Anything to do with NatGas & Oil? 😆
www.worldcupchampionships.com
Looking at a "war of traders" results. 27 days... Not sure what their leaderboard is. Looks like a great way to get suckers to deposit money and pay fees asap.
First place has a PF of 44%, I assume this means 1.44, second place 160% I assume it means 2.6. Followed by 1.3, 1.05, 1.13, 1.26, 6.85, 1.11....
Prob easier to get a higher PF with commodity futures where they are so much hedgers, much fewer care about hedging FX risk, plus central banks use it to manipulate everything, more people trying to make money.
Sometimes the sharpe ratio is mentionned. Quick definition:
The Sharpe ratio measures the performance of an investment compared to a risk-free asset, after adjusting for its risk. It is defined as the difference between the returns of the investment and the risk-free return, divided by the standard deviation of the investment.
I looked at some hedge funds reports a while ago, since they diversify and hedge alot PF isn't as high.
Warren Buffet has a PF of what? 100? He makes one trade every 10 years.
It's basically impossible to find those numbers, unless you work at a brokerage, and apart from your own, with the exception of the few times a broker releases some data.
You have to take into account how many opportunities you get also, and more but alot if implicit.
I would say that a PF too low is bad, because when conditions change you will take long to notice with certainty and you will also lose way faster! If you had a PF of 1.1 you spent 5 years to grow, and that can be lost very fast AND it takes you longer to realize it is not working anyway.
A high PF has a high margin for error, profits grow fast enough so drawdowns don't eliminate years of progress, and going from 2.5 to 0.75 over a period kinda is extreme.
I think typically for operations that target 1 to 5 daily ATR, (days to weeks holding period), and you get more than something like 1 single bet a year, good profit factors are in the 1.5-2.5 range. Lower than this gets a little dangerous, more than this is the holy grail.
A 25% winrate 5R system has a PF of 1.67.
4- Max Drawdown & risk per operation & max risk
Here you use a binomial probability calculator.
Plenty on the internet.
Winrate 25%, Reward/Risk 5, PF 1.67
==> After 60 bets, on average you should get 15 wins 45 losses.
The odds of getting more than 15 wins (P: 16 or more out of 60) are 43%.
The odds of getting less than 5 wins (55 or more losses) are 0,0956%. 1/1000.
10k account. Flat $100 risk per bet.
55 loss 5 wins = $5500 in loss, $2500 in wins, down $3000.
60 loss 0 wins = $6000 in loss, $ZERO in wins, down $6000 (rekt.)
So every 1000 trades you should expect something like this right?
Even with a very decently profitable strategy it will happen.
You have to decide at what point you consider the odds of it just being bad luck to be too high, and you just want to drop it.
Smaller drawdowns are going to happen absolutely all the time.
If you are risking 1% every time and adjusting, 55L 5W would be a 27% rekt, and 60L would be a 46% rekt.
The odds of losing 18 or more out of 20 are greater than 9% (9/100). Will happen ALL THE TIME.
With 1% risk, drawdown of 8 to 18%. Expect it very often.
Some clients use funds to diversify, to get returns with low risk.
Some expect less risk and volatility than the stock market, but expect better returns. Cute.
5- Expected returns after 100 bets
Say you got a system like the one I used in my example (that you backtested + used over a great number, or just used over a greater number of operations).
Winrate 25%, Reward/Risk 5, PF 1.67
If you do not care about eating 20% punches in the face,
and risk 1% per trade, on AVERAGE, after 100 gambles,
then your results will be as such:
75 Losses, 25 wins
(0.99^75)*(1.05^25) = 1.6. Up 60%.
If you risk 1% of your 20 years life saving, you would get 20% drawdowns on a regular basis, meaning you worked for free 4 years.
You can play around with calculators and notepad to estimate how big drawdowns you'll get, how often etc.
With a 2% risk:
(0.98^75)*(1.1^25) = 2.38. Up 138%.
And regular drawdowns not of 8-18% but 23.3%-33.3%.
And once in a while drawdowns of 60% to 70%.
And a few times in a lifetime of 80% to ....
What is the max drawdown before divorce + jump off a cliff?
6- Expected returns after 1 year
And here we are...
Traders should have a vague idea to start with but mostly look at all of this after running a strategy correctly and with some profits, over a "significant" amount of time, kek can't give a number.
First of all what is the amplitude of moves you manage to catch?
So the first limit is obviously the number of waves / moves.
No matter what sytem you have you will not be able to join more waves than they are waves in the first place!
And then... how many you can catch, is much, MUCH, lower than how many there are. Duh!
Anyone with half a brain should be able to understand all of this at some point...
Someone that manages to be profitable and doesn't blow up should make 5 to 40% I guess.
That's that. It's exponentially harder, but also exponentially more profitable.
I think I should build a new income stream writting books...

The REAL reason 90% fail.I already posted that the average trader at a big broker (FXCM) had a negative expectancy. Their risk rewards are around 0.5-0.6 with winrates of ~ 60%. This means for each dollar they make they lose 1.22. Their Profit Factor is ~ 0.82.
4 lose 6 wins each win is $30 each lose is $55 ==> Profits = 180 Losses = 220.
So this explains why the average loses. But not every one makes those mistakes. And someone might learn from them, or even just flip a coin. Why do so few cut it? Simply "emotions" and never learning and all the things "trading educators" throw at us? Come on, apart from the very worst, if someone gets hit enough times he will learn his lesson and want to do the opposite. And we know there are plenty that blow up and keep coming back, regardless of negative results. Why is it as high as 90%?
What more could there be to it?
Let's look at this data that was provided.
We can see the GBPUSD ATR was around 80 pips.
FXCM Data: Traders captured profits on 59% of all GBP/USD trades. Yet they overall lost money as they turned an average 43 pip profit on each winner and lost 83 pips on losing trades.
Losers are 1 ATR (they hold for the whole day / 24 hours on average), Winners are half an ATR (held for half a day on average)
We can see the EURUSD ATR was around 100 pips.
FXCM Data: We see that EUR/USD trades were closed out at a profit 61% of the time, but the average losing trade was worth 83 pips while the average winner was only 48 pips.
So about the same as GBPUSD, the average losers is around 1 day, the average winner half that.
Spreads are at least 1 pt and 0.01%, I think they were not much higher back then. On some pairs (that they trade on the same time horizons), spreads go up to 0.05% - for a similar ATR.
For gold spread is 0.03% but the ATR is a bit higher.
So typically, if we bring everything to 1% ATR, the spread is around 0.025%.
Let's say we have a daytrader, he has no edge, positive or negative, so his expectancy is to breakeven.
He has a small account and doesn't want to be here for the rest of his life grinding, so he uses 10 leverage.
We ignore the fact that using leverage reduces his expectancy.
He takes 4 trades a day. This is far below what most "day trading educators" do.
In a period of 3 months he has taken (around 65 days) 260 day trades with a breakeven strategy.
0.9975^^260 = 52%. So he lost 48%.
For info:
The problem is not spreads and commissions, they are fine...
Alot of day trading educators go for stocks, with spreads of 1%. And commissions of $10 (5+5) on their 10,000 orders (0.1%). They are using more zero comissions now, but they pay it in slippage, just worse fills generally, and bigger spreads.
Educators take like 20+ trades a day (on their demo accounts). At a gentle, over optimistic 0.25% loss on every trade to fees, in 2 months (45 days) with 20 trades a day this is what happens: 0.9975^900 = 0.10. Down 90%.
Or did they find the holy grail that gives them a big expectancy to counter the cost AND a ton of setups at the same time AND they take a ton of trades a day so clearly they aren't doing massive research each time?
Usually even if you can get a good expectancy then you will get less setups. The better the profit factor (winrate and risk reward), the lower the number of opportunities.
So they have the absolute holy grail. A large expectancy. They get a ton of signals. And little effort since they can at most spend a few minutes analysing to get this golden setup. So we could call it easy and no brain.
Hmmm, an easy no brain super expectancy strategy, that fires signals every few minutes... Ye sure. And it keeps working, no one found it.
And they are teaching this to every one for a few hundred or thousand bucks. THE holy grail.
Yep, sure, why not. Seems totally legit. XD
What if you were to take 1 trade a day, stop and target 0.50%, with 53% winrate, that's a winning strat: 53 wins 47 losses. 10 leverage. Spreads of 0.02%. 100 trades in 4 months.
(0.998^100)*(1.05^53)*(0.95^47) = 0.975. Lost 2.5% on a winning strat. MORE MORE MOAR. To go faster. Only thing that will go faster is you'll lose money faster.
With 52% winrate.
(0.998^100)*(1.05^52)*(0.95^48) = 0.88.
Can quickly go wrong... A difference of 1 winner becoming a loser ruins it.
If you are curious, my own average loser, it varies alot so I don't know for sure, but 40 points is typical, so same as their average winner.
Average winner is 200 :) About 2 daily ATR is what I get on average on winners. A little over 1 to a little over 3.
I would like to have bigger winners, and spend more time analysing fewer currencies or commodities, focus more on babysitting winning trades than exhausting myself looking and looking and searching, my goal if possible is to increase my time horizons.
But anyway, spreads and losers are just small costs that stack up, but winners pay for that, and spreads don't reduce my winners by 10%.
You might think "hey in prop firms they day trade alot"
Well here is my answer:
A) They are using big money to make money. They are not making 500% on 50k accounts. More like 1 to 20% on hundreds of millions. If you start small and want to grow this does not help.
B) They have alot of advantages they pay for (faster connection to exchange, they can negociate costs, prime brokerage, top research/info, etc).
C) They are going down under ALL THE TIME.
D) Most famous funds with best returns are quants, long term investing, swing/position trading hedge funds. Not day trading prop firms.
E) You ever seen a prop trader results? $50,000 net profit. Wooo nice. Gains: 800,000. Losses: 550,000. Commissions & fees: 200,000. Bleuarg. Not counting other costs...
Solution
==>
1- Bigger winners. Small winners means that 10% or even more of it can vanish to fees. The bigger, the less impact fees will have on it.
2- Look more for high quality, high odds setups, spend time being a detective doing your research, and then be a sniper 1 bullet 1 kill, not some pleb holding a machine gun over his head and firing at random.
3- Gains won't "compound faster" by reducing time frame. Losses will. Haven't heard of any famous trader that was buying and selling every few hours. Pick a timeframe high enough so that you have time to study setups, get high quality ones once in a while, and spreads don't make much of a difference. You can't grow faster by going in bigger, or more often. Simple maths. Only thing that will improve results, is... tada! Improving.
Less is more.
