XOM long-term TAExxon has been consolidating in this channel for quite a long period of time and now it has finally broken out of the consolidation on heavy volumes which was preceded by monthly squeeze.
Exxon

XOM mid-term TAExxon is strictly bullish on daily and weekly time frames, as much as CVX but XOM even more stronger on monthly time frame. XOM has broken through the final resistance recently and looks promising for an uptrend continuation.

The Venezuelan EffectIn this video I going to exhibit the effect of the the profound economic crisis in Venezuela and its broader global implications. WTI, BRENT, BA, EXXON, LOCHKEADMARTIN
Overview of the Crisis
The video details Venezuela's transition from being the wealthiest nation in South America to a country grappling with extreme hyperinflation and economic collapse . It highlights how the nation's heavy reliance on oil exports—accounting for nearly 95% of its export earnings—made it uniquely vulnerable to fluctuations in global oil prices .
Key Economic Factors
The Resource Curse: The video explains how "Dutch Disease" occurred, where the focus on oil led to the neglect of other sectors like agriculture and manufacturing .
Hyperinflation: It discusses the catastrophic devaluation of the Bolívar, which led to a scenario where basic necessities became unaffordable for the average citizen .
Government Policy: The narrative touches upon the impact of price controls, nationalization of industries, and the role of political instability in exacerbating the financial downturn .
The Human and Global Impact
Mass Migration: A significant portion of the video is dedicated to the massive exodus of Venezuelans seeking better opportunities in neighboring countries, creating a regional humanitarian challenge .
Geopolitical Shifts: It explores how Venezuela’s situation has influenced regional politics and energy markets worldwide .
The video concludes by analyzing the current state of the Venezuelan economy and whether recent shifts in policy or international relations offer a path toward stabilization .

ExxonMobil: Fresh Selling PressureExxonMobil recently came under renewed pressure, pulling back from resistance at $126.34. In our primary scenario, we continue to expect the high of the magenta wave (B) to remain below the resistance at $134.38, before wave (C) drives the stock into our green Target Zone between $75.37 and $50.05. However, if the stock soon drops below support at $95.77, we may have to assume that the high of the turquoise wave alt.2 is already in place, which would likely result in an earlier move toward our Target Zone (probability: 35%).

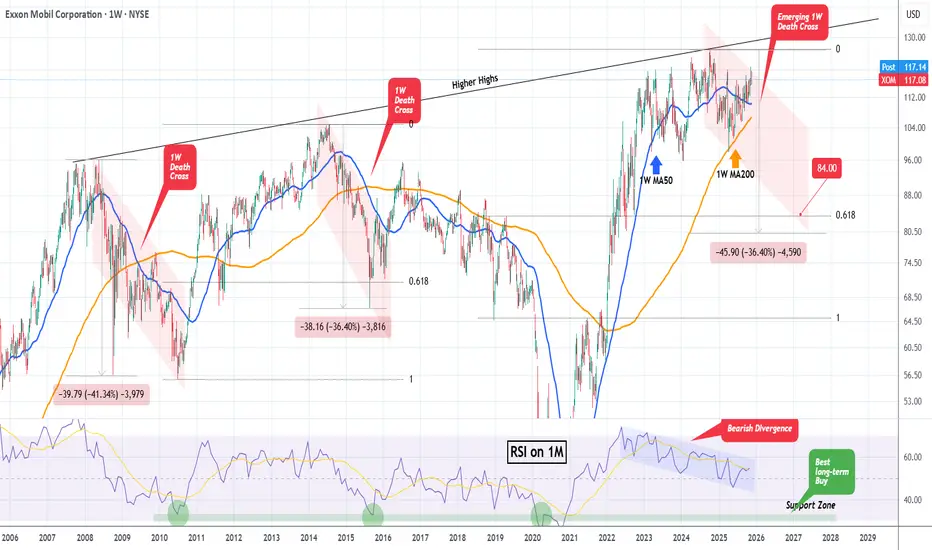
EXXON MOBIL on its 1st 1W Death Cross in 10 years!Exxon Mobil (XOM) is around a month before the formation of a 1W Death Cross for the first time in 10 years (last one in July 2015). This is a major technical development as the last two 1W Death Crosses resulted in massive sell-offs.
As you can see, both were formed long after a market rejection on the 18-year Higher Highs trend-line. The minimum correction (Bear Cycle) that was followed after such rejection was -36.40% (2014 - 2015), breaking just below its 0.618 Fibonacci retracement level.
As a result, we expect the stock to start declining aggressively ahead of the new 1W Death Cross and reach its 0.618 Fibonacci retracement level at $84.00 (still above the -36.40% projected decline).
If however the 1M RSI hits its 15-year Support Zone first, we expect a market bottom there and massive long-term bullish reversal, so we will buy at whatever level the price is at the time of Support contact.
---
** Please LIKE 👍, FOLLOW ✅, SHARE 🙌 and COMMENT ✍ if you enjoy this idea! Also share your ideas and charts in the comments section below! This is best way to keep it relevant, support us, keep the content here free and allow the idea to reach as many people as possible. **
---
💸💸💸💸💸💸
👇 👇 👇 👇 👇 👇
$XOM Tradespoon – Long Setup $118.41Tradespoon model signals a long bias for NYSE:XOM . Predicted range: $118.17–$119.99. Trend: –0.04%. NYSE:XOM

EXXON MOBIL: This strong rally won't end any time soon.Exxon Mobil is about to turn overbought on its 1D technical outlook (RSI = 67.390, MACD = 2.260, ADX = 52.087) as for the 4th straigh week it is posting gains. This rally started on the first week of March when the stock almost touched the bottom of the 2 year Channel Up. This is a similar bullish wave to the one that started after the January 2024 bottom, which eventually reached the 1.236 Fibonacci extension. Aim for a bit under the top of the Channel Up (TP = 128.00.
See how our prior idea has worked out:
## If you like our free content follow our profile to get more daily ideas. ##
## Comments and likes are greatly appreciated. ##

ExxonMobil: Toward the ResistanceExxonMobil: Toward the Resistance
As planned, XOM recently continued to rise with the magenta wave . We give this movement a bit more room, but another smaller corrective movement of wave should start below the resistance line at $126.34 before XOM ultimately surpasses this mark. Once the upward movement stalls below $126.34, it is important that the price doesn't fall too deeply afterward. After all, there is a 40% probability for our alternative scenario, where not wave in magenta but wave alt.2 in turquoise would develop its high – confirming an already established top of the overarching wave alt.(B) and, thus, a generally corrective scenario.

ExxonMobil: Final Pullback ExpectedExxonMobil should soon resolve the ongoing sideways phase, allowing the turquoise wave 2 to establish its corrective low below $104.84. This final pullback is still needed before the next impulsive rally unfolds. Alternatively, there is a 32% chance that the key low was already settled by the turquoise wave alt. 2. A break above $123.74 would confirm this scenario.

Exxon Mobil (XOM): Preparing for a Q1 2025 SetupHeading into Q1 2025, we believe NYSE:XOM could present a promising buying opportunity, and we are preparing a setup to align with our bias. Since April, we have been closely monitoring Exxon Mobil, and the technical picture continues to gain clarity as the stock respects both the range middle and range high. The wave ((b)) overshot wave A by a significant margin but still within acceptable limits for a flat correction.
Since the overshoot in early October, NYSE:XOM has seen a substantial decline—falling 17% over 75 days, a significant move for this stock. The primary driver behind this decline seems to be ongoing shareholder challenges. Over the last three years, Exxon Mobil has resisted calls for meaningful carbon emissions reductions, instead doubling down on traditional oil and gas operations. Legal action against shareholder activists pushing for emissions reduction targets has only added to the controversy, with proposed changes falling short of expectations.
The shareholder concerns highlight a critical point: some voting patterns defy logic when aligned with long-term goals. Questions remain about whether Exxon Mobil should, or can, prepare for a carbon-neutral future. The widely publicized shareholder vote in 2021, which many hoped would lead to substantial changes, seems to have produced minimal practical outcomes.
Despite these issues, we see potential for NYSE:XOM to resolve its challenges in the near future. From a technical standpoint, we observe a strong likelihood of a wave C drop into the $101–$92 range, which aligns with the 61.8%–78.6% Fibonacci retracement levels. This would be a key area to begin building a position.

Exxon is oversold (the most since 2020)NYSE:XOM is inside it's sideways channel since March 2024 and trades within a price range of $108 - $123 with one failed breakout to the upper side in October.
The recent pulldown came from commodity prices (oil) and political drama about how much oil will be offered in Trump's term. Of course, it would be best if supply will not outpace demand too much since this would let oil prices drop. Trump will learn this soon enough. Because of that it's mostly noise what we have seen in this chart.
The level at $108 offered strong support twice and the sector (XLE) is also offering support itself. Also, the last time we've seen this stock so oversold was during the Covid crash in 2020.
From a fundamental perspective, Exxon Mobil's recent performance highlights its strong investment potential. The company's total shareholder yield, combining dividends and buybacks, now exceeds 7%, offering substantial returns to investors. In Q3 2024, Exxon reported $8.6 billion in net profit, with a 25% production increase, partly due to the acquisition of Pioneer Natural Resources. Despite a 5% earnings decline from lower commodity prices, Exxon's diversified operations and strategic investments in alternative energy position it well for long-term growth. The recent stock price dip presents an attractive entry point for investors seeking robust returns in the energy sector.
Target Zones
$114.00
$123.00
Support Zones
$108.00

Exxon's Make-or-Break Moment: $123 Resistance in FocusThe chart distinctly illustrates that the stock has been in a consolidation phase for over a year and is presently trading slightly below its resistance zone.
For a potential upward movement, the price must surpass the 123 level and maintain its position above this threshold.
At the same time, there is a significant likelihood that the stock price may encounter rejection once more, leading to a decline towards its trendline support level.

[XOM] Exxon at inflection pointOil is pounded down but NYSE:XOM seems managed to hang on. It's now even at inflection point of trying to breakout the downtrend line, which if it does, a completion of cup & handle pattern.
Wait & see for now.

ExxonMobil projects stability in global oil demand through 2050ExxonMobil has released a report projecting that global oil demand will remain stable until 2050 despite the accelerating shift towards renewable energy sources. According to ExxonMobil, oil demand is expected to stabilise after 2030, maintaining levels above 100 million barrels per day, closely aligning with the current 102.2 million barrels per day. This forecast starkly contrasts with its competitor, BP, which anticipates a decline to 75 million barrels per day by 2050.
The report highlights that petroleum products will continue to play a critical role in industrial processes and heavy transportation sectors such as shipping, trucking, and aviation. Moreover, ExxonMobil notes that despite the increased adoption of electric vehicles and other renewable energy resources, oil and natural gas are projected to constitute over half of the global energy mix by 2050. This outlook supports an optimistic long-term scenario for ExxonMobil's core oil and gas operations.
Technical analysis of Exxon Mobil Corporation (NYSE: XOM)
Reviewing potential trading strategies based on the technical setup of ExxonMobil's stock:
Timeframe : Daily (D1)
Current trend : the stock is trending upward within an ascending channel, having recently rebounded from the support level at 114.00 USD and approaching a critical resistance at 120.00 USD
Short-term target : the immediate upside target lies at the resistance level of 123.65 USD
Medium-term target : a breach of the 123.65 USD resistance could pave the way for further gains towards 127.60 USD
Key support : positioned at 114.00 USD
Reversal indicator : if the stock breaks below the key support at 114.00 USD, it will negate the current bullish scenario, potentially driving prices down to 108.45 USD
ExxonMobil's shares currently benefit from positive momentum, having broken the upper boundary of a descending channel. A successful breach of the key resistance at 120.00 USD would signify an exit from a Triangle pattern, potentially strengthening the bullish momentum with a target at 127.60 USD, aligned with the pattern's projected outcome.
Investors should closely monitor ExxonMobil's movements, especially in light of its optimistic oil demand forecast and the potential impact on its stock price in the context of prevailing market dynamics and energy sector trends.
—
Ideas and other content presented on this page should not be considered as guidance for trading or an investment advice. RoboMarkets bears no responsibility for trading results based on trading opinions described in these analytical reviews.
The material presented and the information contained herein is for information purposes only and in no way should be considered as the provision of investment advice for the purposes of Investment Firms Law L. 87(I)/2017 of the Republic of Cyprus or any other form of personal advice or recommendation, which relates to certain types of transactions with certain types of financial instruments.
Risk Warning: CFDs are complex instruments and come with a high risk of losing money rapidly due to leverage. 65.68% of retail investor accounts lose money when trading CFDs with this provider. You should consider whether you understand how CFDs work and whether you can afford to take the high risk of losing your money.

Exxon Mobil ShortThere is a triple top on H4 with a lot of resistance
this is against the trend but there is a pattern on H1
Stop loss of 150 points
first target will be the bottom of the range
M15 double top with divergence
Market looks weak this week

Exxon Mobile (XOM): Awaiting Long Term Entry at $65Our group has recently revisited Exxon Mobil Corporation (XOM), and while there hasn't been much change, it's worth reassessing. The stock has entered the zone between 100% and 138%, which we identify as the level for Wave A and has respected this level.
Long-Term Outlook:
We anticipate a significant downward movement over the long term, potentially reaching the $65 level. This is where we plan to make substantial long-term purchases. The range between $65.50 and $64.40 has been consistently respected, reinforcing our strategy to wait for these levels before entering the market heavily.
Short-Term Outlook:
In the short term, Exxon has been trading within a range for nearly a year and a half. It briefly broke below this range to complete the larger Wave (A)and then broke above it to finish the sub-wave A. We are now entering a potential Wave B zone.
Current Strategy:
- Long-Term: We are waiting for the price to drop to the $65 range before making significant purchases.
- Short-Term: We are monitoring the $104 to $100 zone, which looks attractive for a potential reversal. However, given the risk, we are not placing any entries yet and will wait to observe the market's reaction.

Exxon continues the Energy forever bull marketExxonMobil Corporation (/ˌɛksɒnˈmoʊbəl/ EKS-on-MOH-bəl; commonly shortened to Exxon ) is an American multinational oil and gas corporation and the largest direct descendant of John D. Rockefeller's Standard Oil. The company, which took its present name in 1999 per the merger of Exxon and Mobil, is vertically integrated across the entire oil and gas industry, and within it is also a chemicals division which produces plastic, synthetic rubber, and other chemical products. ExxonMobil is headquartered near the Houston suburb of Spring, Texas, though officially incorporated in the U.S. state of New Jersey. : 1 It is the largest United States-based oil and gas producing company. ExxonMobil is also the eighth largest company in the world by revenue and the third largest in the US.

XOM Exxon Mobil Corporation Options Ahead of EarningsIf you haven`t bought the dip on XOM:
Then analyzing the options chain and the chart patterns of XOM Exxon Mobil Corporation prior to the earnings report this week,
I would consider purchasing the 120usd strike price Calls with
an expiration date of 2025-1-17,
for a premium of approximately $10.05.
If these options prove to be profitable prior to the earnings release, I would sell at least half of them.

XOMExxon Mobil. Dividend aristocrat.
Dividend stocks, when you look at historical data, have performed well since the last rate hike in the cycle.
Finish correction.
tp1 117
tp2 133

Exxon Mobil: On the Brink of a Collapse?Having not reviewed Exxon Mobil for a while, it's important to note its strong correlation with oil prices, on which we're currently positioned in a short trade. Accordingly, we also anticipate a downward trend for Exxon Mobil that has yet to conclude. The construction of Wave E or overarching Wave (A) peaked at approximately $96. The critical question now is whether we're forming a Flat in the form of either a Regular or Expanded Flat.
We'll observe how this unfolds without making speculative judgments due to the unusual nature of witnessing an ABCDE movement towards Wave (A). Over the next year, we expect Exxon Mobil to decline, targeting a retracement between $75 and $50 as the maximum. Any level within this range presents a solid buying opportunity for a long-term investment, anticipating a robust Wave III.


XOM Exxon Mobil Corporation Options Ahead of EarningsIf you haven`t bought XOM ahead of the previous earnings:
Then analyzing the options chain and the chart patterns of XOM Exxon Mobil Corporation prior to the earnings report this week,
I would consider purchasing the 105usd strike price Calls with
an expiration date of 2024-3-15,
for a premium of approximately $2.37.
If these options prove to be profitable prior to the earnings release, I would sell at least half of them.

$XOM Is Undervalued. The logic is that price will gravitate to liquidity. Exxon Mobile seems to have an abnormal amount of liquidity sitting above all time highs. Gut says we take out those highs pretty soon.
Here are some other considerations:
-Exxon Mobil also currently has the highest percentage of short interest in modern history.
-The company has a low valuation of 11x earnings, pays a 3.66% dividend yield with over 40 years of consecutive annual dividend growth, and its balance sheet has a AA- credit rating.
-Exxon earns twice as much income and 7.5x as much revenue as Nvidia.
-Warren Buffett has been adding to their oil positions (Buffet Effect).
-Energy sector sentiment is quite poor.
