ExxonMobil: Fresh Selling PressureExxonMobil recently came under renewed pressure, pulling back from resistance at $126.34. In our primary scenario, we continue to expect the high of the magenta wave (B) to remain below the resistance at $134.38, before wave (C) drives the stock into our green Target Zone between $75.37 and $50.05. However, if the stock soon drops below support at $95.77, we may have to assume that the high of the turquoise wave alt.2 is already in place, which would likely result in an earlier move toward our Target Zone (probability: 35%).
Exxonmobiltrading

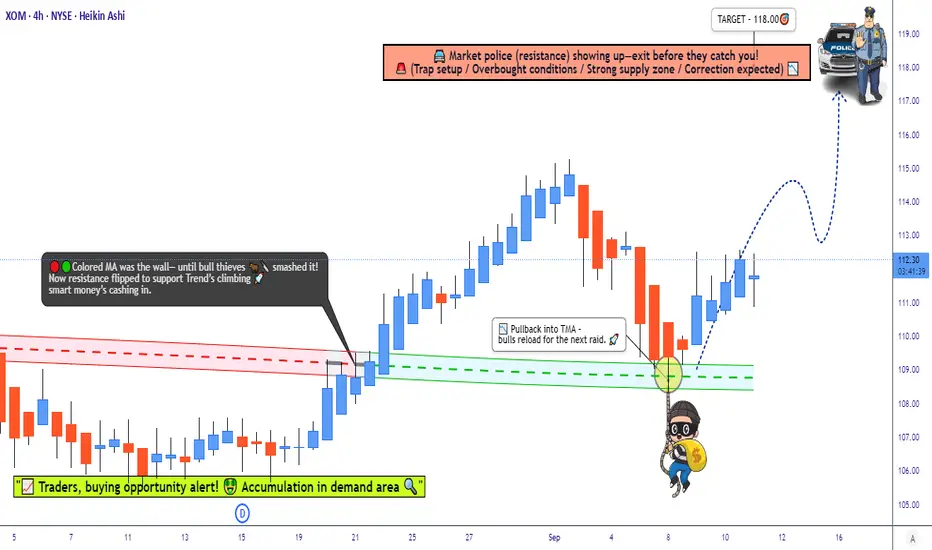
Exxon Mobil Stock Outlook: Fundamentals + Technicals Aligned📌 Exxon Mobil Corporation (XOM) — Bullish Master Plan (Swing / Scalping Trade)
🛠️ Plan Setup (Thief Strategy)
Bias: Bullish — Triangular Moving Average Pullback 📈
Entry: Multiple layered limit orders at 🔹 $110.00 🔹 $111.00 🔹 $112.00 (You can adjust layers based on your own strategy).
Stop Loss (Protective Layer): $108.00 (adjust to your own risk preference).
Target Zone: Around $118.00 (key resistance area).
⚠️ Note: These levels are not financial advice. Manage risk carefully and adjust according to your own strategy.
❓ Why This Plan?
This Thief Plan Strategy uses layered limit orders for flexible entries. It combines technical pullback signals with fundamental, macro, sentiment, and fear/greed insights to build a confluence-based trade idea.
📊 Stock Price Overview
Daily Change: -0.20% (from $112.50 previous close)
1-Month Trend: +5.66% (from $106.27 on Aug 12)
1-Year Trend: -4.21% (from $117.22 in Sep 2024)
Year-to-Date: +2.26% (from $109.57 in 2024)
😊 Investor Sentiment
Retail Investors: 50.76% bullish 😄
Institutional Investors: 47.25% bearish 😕
Overall Mood: Mixed ⚖️
😨 Fear & Greed Index
Current Level: 39 (Fear)
Interpretation: Cautious tone, may signal undervaluation.
📈 Fundamental Score (7.55/10) ✅
Strong revenue: $340.57B in 2024 (+1.16% YoY) 💰
Stable dividend: $0.99/share quarterly 🎉
Weaknesses: Net profit -6.47% in 2024, higher operating costs 📉
🌍 Macro Score (6.8/10) 🌎
Oil demand projected to rise 20% by 2050 🛢️
Geopolitical risks support oil prices 🔥
OPEC+ output hike could moderate momentum 📉
🐂🐻 Market Outlook
Consensus: Neutral → Mildly Bullish ⚖️
Analyst Ratings: Moderate Buy (12 Buy, 7 Hold, 0 Sell)
Key Drivers: Stable fundamentals + oil price volatility = balanced setup.
🔑 Takeaway
Exxon Mobil (XOM) offers a layered-entry bullish opportunity with mixed sentiment but strong long-term fundamentals.
Fear-dominated mood may provide contrarian opportunities.
Keep an eye on oil prices & geopolitics for momentum triggers.
Layering strategy provides flexibility across multiple levels. 🚀
🔗 Related Pairs to Watch (in USD)
Chevron Corporation (CVX): Another oil major with similar exposure to crude prices. 🛢️
United States Oil Fund (USO): Tracks WTI crude oil prices, a key driver for XOM. 📈
Energy Select Sector SPDR Fund (XLE): Broad energy sector ETF for context. 💡
✨ “If you find value in my analysis, a 👍 and 🚀 boost is much appreciated — it helps me share more setups with the community!”
#XOM #ExxonMobil #EnergyStocks #SwingTrade #Scalping #StockMarket #Oil #Fundamentals #TechnicalAnalysis #Macro #FearGreedIndex #TradingStrategy #LayeredEntry #StockIdeas
EXXON MOBIL: This strong rally won't end any time soon.Exxon Mobil is about to turn overbought on its 1D technical outlook (RSI = 67.390, MACD = 2.260, ADX = 52.087) as for the 4th straigh week it is posting gains. This rally started on the first week of March when the stock almost touched the bottom of the 2 year Channel Up. This is a similar bullish wave to the one that started after the January 2024 bottom, which eventually reached the 1.236 Fibonacci extension. Aim for a bit under the top of the Channel Up (TP = 128.00.
See how our prior idea has worked out:
## If you like our free content follow our profile to get more daily ideas. ##
## Comments and likes are greatly appreciated. ##

ExxonMobil: Toward the ResistanceExxonMobil: Toward the Resistance
As planned, XOM recently continued to rise with the magenta wave . We give this movement a bit more room, but another smaller corrective movement of wave should start below the resistance line at $126.34 before XOM ultimately surpasses this mark. Once the upward movement stalls below $126.34, it is important that the price doesn't fall too deeply afterward. After all, there is a 40% probability for our alternative scenario, where not wave in magenta but wave alt.2 in turquoise would develop its high – confirming an already established top of the overarching wave alt.(B) and, thus, a generally corrective scenario.

ExxonMobil: Final Pullback ExpectedExxonMobil should soon resolve the ongoing sideways phase, allowing the turquoise wave 2 to establish its corrective low below $104.84. This final pullback is still needed before the next impulsive rally unfolds. Alternatively, there is a 32% chance that the key low was already settled by the turquoise wave alt. 2. A break above $123.74 would confirm this scenario.

EXXON MOBIL: Strong buy at the bottom of a 1 year Rectangle.XOM has been trading inside a Rectangle pattern since the October 11th 2022 low and just last week the 1D RSI got oversold below 30.000. Now the 1D technical outlook is neutral (RSI = 46.595, MACD = -1.790, ADX = 43.208) but that oversold level was the first buy signal as it took place very close to the Rectangle's bottom.
The second and final validation buy signal will be when the stock closes a 1D candle over the LH trendline. Yesterday it crossed over it but closed on it. We will take this opportunity to target the 0.786 Fibonacci level (TP = 115.00) as this was the minimum target that the previous three rallies hit.
## If you like our free content follow our profile to get more daily ideas. ##
## Comments and likes are greatly appreciated. ##

EXXON MOBIL: Another choppy month. Rally near Christmas.Exxon Mobil got rejected last Friday on the 1D MA200 and after the 1D MA50 rejection the week before, enters a dangerous territory of LL until it forms the bottom. The long term pattern is a Channel Up, who's rebounds and rejections are accuretelly depicted by the Fibonacci levels. Naturall the 1D timeframe is bearish (RSI = 36.689, MACD = 2.316, ADX = 38.647) and until we see HLows on the 1D RSI, we are not willing to turn bullish long term. We expect the rally to start close to Christmas, aiming at the top of the Channel (TP = 122.00).
## If you like our free content follow our profile to get more daily ideas. ##
## Comments and likes are greatly appreciated. ##
