Exxon Mobil Stock Outlook: Fundamentals + Technicals Aligned📌 Exxon Mobil Corporation (XOM) — Bullish Master Plan (Swing / Scalping Trade)
🛠️ Plan Setup (Thief Strategy)
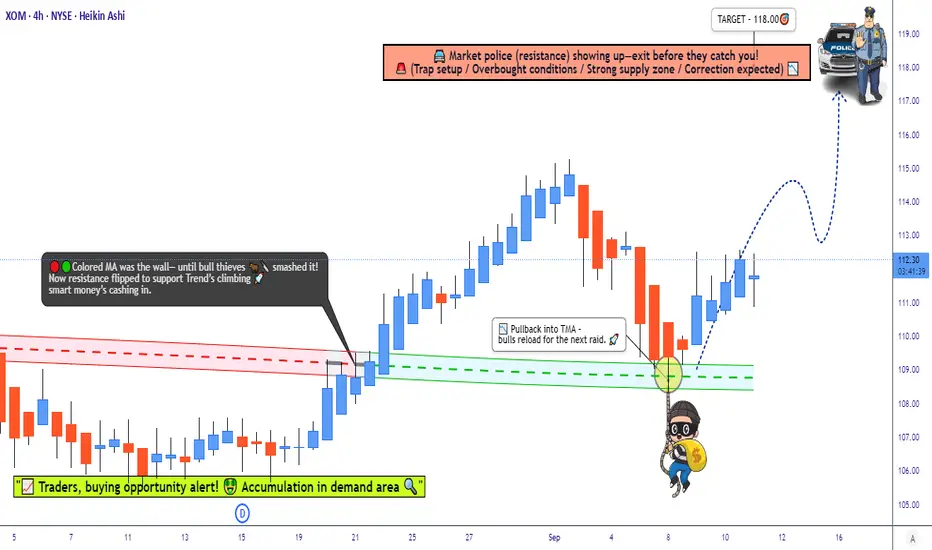
Bias: Bullish — Triangular Moving Average Pullback 📈
Entry: Multiple layered limit orders at 🔹 $110.00 🔹 $111.00 🔹 $112.00 (You can adjust layers based on your own strategy).
Stop Loss (Protective Layer): $108.00 (adjust to your own risk preference).
Target Zone: Around $118.00 (key resistance area).
⚠️ Note: These levels are not financial advice. Manage risk carefully and adjust according to your own strategy.
❓ Why This Plan?
This Thief Plan Strategy uses layered limit orders for flexible entries. It combines technical pullback signals with fundamental, macro, sentiment, and fear/greed insights to build a confluence-based trade idea.
📊 Stock Price Overview
Daily Change: -0.20% (from $112.50 previous close)
1-Month Trend: +5.66% (from $106.27 on Aug 12)
1-Year Trend: -4.21% (from $117.22 in Sep 2024)
Year-to-Date: +2.26% (from $109.57 in 2024)
😊 Investor Sentiment
Retail Investors: 50.76% bullish 😄
Institutional Investors: 47.25% bearish 😕
Overall Mood: Mixed ⚖️
😨 Fear & Greed Index
Current Level: 39 (Fear)
Interpretation: Cautious tone, may signal undervaluation.
📈 Fundamental Score (7.55/10) ✅
Strong revenue: $340.57B in 2024 (+1.16% YoY) 💰
Stable dividend: $0.99/share quarterly 🎉
Weaknesses: Net profit -6.47% in 2024, higher operating costs 📉
🌍 Macro Score (6.8/10) 🌎
Oil demand projected to rise 20% by 2050 🛢️
Geopolitical risks support oil prices 🔥
OPEC+ output hike could moderate momentum 📉
🐂🐻 Market Outlook
Consensus: Neutral → Mildly Bullish ⚖️
Analyst Ratings: Moderate Buy (12 Buy, 7 Hold, 0 Sell)
Key Drivers: Stable fundamentals + oil price volatility = balanced setup.
🔑 Takeaway
Exxon Mobil (XOM) offers a layered-entry bullish opportunity with mixed sentiment but strong long-term fundamentals.
Fear-dominated mood may provide contrarian opportunities.
Keep an eye on oil prices & geopolitics for momentum triggers.
Layering strategy provides flexibility across multiple levels. 🚀
🔗 Related Pairs to Watch (in USD)
Chevron Corporation (CVX): Another oil major with similar exposure to crude prices. 🛢️
United States Oil Fund (USO): Tracks WTI crude oil prices, a key driver for XOM. 📈
Energy Select Sector SPDR Fund (XLE): Broad energy sector ETF for context. 💡
✨ “If you find value in my analysis, a 👍 and 🚀 boost is much appreciated — it helps me share more setups with the community!”
#XOM #ExxonMobil #EnergyStocks #SwingTrade #Scalping #StockMarket #Oil #Fundamentals #TechnicalAnalysis #Macro #FearGreedIndex #TradingStrategy #LayeredEntry #StockIdeas
Exxonsignals
XOM has shown a consolidation patternXOM has shown a consolidation pattern
This chart shows the weekly candle chart of ExxonMobil's stock in the past 4 years. The graph overlays the bottom to top golden section at the beginning of 2020. As shown in the figure, ExxonMobil's stock has shown a consolidation pattern of high to strong overall after completing a small level double top at the beginning of this year! The small double top of ExxonMobil's stock at the beginning of this year was suppressed by the 3.618 level of the gold split at the bottom of the graph, and did not touch any strong support level for the low point of the pullback thereafter! So, in the future, the stock market of ExxonMobil is likely to weaken and continue to retreat towards the downside!

Double top form of ExxonMobil's stock has been completedDouble top form of ExxonMobil's stock has been completed
This chart shows the weekly candle chart of ExxonMobil's stocks over the past 4 years. The graph overlays the bottom to top golden section at the beginning of 2020. As shown in the figure, the small-scale double top form of ExxonMobil's stock has been completed. Now, there is a long short competition at the bottom of the figure against the 3.000 and 3.272 positions in the golden section, and it is likely to break down in the future! For a period of time to come, just use the long start level of ExxonMobil's stock in late March this year at $99.63 as the long short divide!

Exxon Mobil Analysis 28.12.2022Hello Traders,
welcome to this free and educational analysis.
I am going to explain where I think this asset is going to go over the next few days and weeks and where I would look for trading opportunities.
If you have any questions or suggestions which asset I should analyse tomorrow, please leave a comment below.
I will personally reply to every single comment!
If you enjoyed this analysis, I would definitely appreciate it, if you smash that like button and maybe consider following my channel.
Thank you for watching and I will see you tomorrow!
You can also check out my previous analysis of this asset:

Exxon Mobil Analysis 10.12.2022Hello Traders,
welcome to this free and educational analysis.
I am going to explain where I think this asset is going to go over the next few days and weeks and where I would look for trading opportunities.
If you have any questions or suggestions which asset I should analyse tomorrow, please leave a comment below.
I will personally reply to every single comment!
If you enjoyed this analysis, I would definitely appreciate it, if you smash that like button and maybe consider following my channel.
Thank you for watching and I will see you tomorrow!

EXXON MOBIL Close to huge bullish break-out but watch this levelThe Exxon Mobil Corporation (XOM) has made new All Time Highs (ATH) this month, being on a massive +37% rally since the September 26 low and bounce on the 1D MA200 (orange trend-line). Based on a similar 1D RSI occurrence, it would appears that the price is currently starting a pull-back similar to November 10 - December 20 2021, which hit the 1D MA200 and as it has always done since December 2020, it rebounded strongly.
This pull-back will be confirmed if the price breaks below the 1D MA50 (blue trend-line) again. Until then, with Exxon exactly at the top of the Channel that started after the 2020 Double Bottom, a break above the Higher Highs trend-line, would start a huge bullish break-out towards the 1.786 Fibonacci extension ($125.00) and potentially the 2.5 Fib ($143.00).
-------------------------------------------------------------------------------
** Please LIKE 👍, SUBSCRIBE ✅, SHARE 🙌 and COMMENT ✍ if you enjoy this idea! Also share your ideas and charts in the comments section below! This is best way to keep it relevant, support me, keep the content here free and allow the idea to reach as many people as possible. **
-------------------------------------------------------------------------------
You may also TELL ME 🙋♀️🙋♂️ in the comments section which symbol you want me to analyze next and on which time-frame. The one with the most posts will be published tomorrow! 👏🎁
-------------------------------------------------------------------------------
👇 👇 👇 👇 👇 👇
💸💸💸💸💸💸
👇 👇 👇 👇 👇 👇
