XAUUSD : looking to buy untill 1300 zoneWaiting gold to spike down the lows and reject them.
If it will reverse on the support I'll buy untill the 1300 zone.
Levels marked on the chart...
Best of luck :-)
Falsebreak

GBPJPY Sell IdeaW1 - False break of this double wave with bearish divergence. Keep in mind we could still see 160.00 based on the previous bearish special cycle.
H4 - Trend line break, bearish convergence and false break. Until we get any confirmation for bullish momentum, we can start looking for sells.
H1 - Any push towards the top of the pattern shown in the screenshot with bearish divergence to be formed could be a good opportunity for the sells.

USDJPY - getting ready to sell or buyOn the chart i marked 2 circles - red and green , green will be the price zone to buy after a false break down and red will be the sell zone after a false break up.
Also red zone will be the 38% retrace zone of the last move down - i didn't marked it because i don't want the chart will be to messy.
Anyway, the really important idea here regardless to the buy / sell from top to bottom is the entry price opportunity for longer term buyers/sellers - eventually i think USDJPY can go to 110 zone or 112 zone ( without to much of retracement ).
Best of luck to the bulls and bears :-)

XAUUSD - waiting to short after another falsebreakGold is near a strong resistance zone .
I'll wait for antoher false break of the highes to short as marked on the chart.
Best of luck :-)

GBPJPY DAILYPrice is trying to break out of bearish flag pattern, but quickly came back into flag range. Watch for a daily close before looking to go short, as price is trying to trap sellers by the looks of it.. Once breakout of flag pattern, the first target would be at weekly support 147.500. If we break below this level the uptrend will be invalidated & price will most likely be heading to its daily uptrend line at around 144.100 support level.
Trade with care! :)

USDCAD - waiting to buy 1.2817 Might get a nice bounce if price will retrace to 1.2817.
So I'll wait lower time frame to make some fractals/structure falsebreak down there and then will buy with small stop.
If usdcad will continue its up trend we get a low risk high reward trade.
Best of luck :-)

EURUSD is going downLooks like a good place to sell EURUSD .
Might go down to 1.15 area if trend continue down .
Best of luck :-)

CRUDE OIL reversal to the downsideOil stopped on resistance zone as you can see on the chart .
Possible down move to support and fibonacci zone

NZDUSD Buy IdeaW1 - Price is close to the bottom of the weekly range.
D1 - Divergence is broken, price is now forming false convergence.
H4 - We have bullish divergence. Once the price reaches the zone shown in the screenshot, we can start looking for buys after we get confirmation of bullish reversal.
Note: If this zone is broken (false breaks are welcome), this setup will be invalidated.

AUDUSD - Looking for Intraday Longs in this ZoneI can't remember the last time I traded the Aussie. After holding previous structure highs at 81 cents I really haven't had an opportunity that interested me. Recently we've broken below those double top lows at 78 cents initially putting short opportunities on my watch list. long-term this is still the case, however the recent break above close above & the formation of the previous candles gives signs of a potential false breakout and perhap [s another move higher. (I really hope that's not as confusing as it sounds.) - Basically what I'm saying is, although I don't really have a long term bias on this pair, I'll be looking for intraday buying opportunities in the live room today.
Akil
"Kind of Strange That The NBA Season Is Starting So Soon...but I kind of Like it"

TripAdvisor Buy IdeaW1 - Bearish cycle is near its end. We have bullish divergence and false break.
D1 - Special cycle is near its end, bearish divergence has formed. Currently we have double waves to follow.
H4 - False break of trendline. No breakout of last high yet.
Measuring the first wave we could see a possibility of a push down also bullish divergence is forming. So we may expect the price to go deeper and then to push up.
This setup is valid until the last low at 35.46 holds, false breaks can be neglected.

Gold Buy IdeaH4 - Bullish divergence followed by bullish convergence.
We also got a false break and a breakout of the last high.
We can now look for a small correction and then join the buys.

USDJPY: false break on resistance daily time-frameThere were upper rejections on USDJPY daily time-frame and false break on last Friday's candle. It might be going down for Monday-Tuesday.

AUDUSD Buy IdeaD1 cycle completed, expecting a correction towards 0.78 zone. If we get a false break around this level along with divergence that would be a great sign for a bullish reversal.
Note - if we get second false break at the bottom we have all the reasons to expect a potential range afterwards ( 0.78 - 0.81 zone).
We have a magnet zone created by two cycles. We can expect the price to bounce anywhere inside the daily 38.8% zone.
We will be looking for divergence to complete itself and false break to form. Suitable strategies here will be the Forex Libra Code, sRs, Triple B and Scorpio Code.

UK 100 Sell IdeaD1 - Price broke at the bottom of the range.
H4 - Double wave correction happening. Price is inside the 38 – 50 zone, also we have bearish divergence happening at the moment.
H1 - False break and bearish divergence. Price respected both the magnet zones.
Once the price breaks the most recent trend line, we can look for sells.

EURCHF Sell IdeaD1 - Bearish divergence and a potential false break if we get a close below 1.1540.
H4 - We have bearish divergence on H4 chart as well and we may go short with the breakout of the trend Line.
Conservative approach - You can either use the double trend line principle for entries or wait for a breakout below 1.1430 first of all and then rallies to short.
If you are trading, using one of my strategies, simply wait for a valid sell signal.
As long as the top holds and we have gotten out confirmations for bearish reversal, we can look for sells towards 1.12.

CHFJPY - looking to sellthe top of the channelThe reason i look to sell is becuase CHFJPY in price action resistance zone and fibs resistance.
The best setup will be after a false break as you can see on the chart.
Best of luck :-)

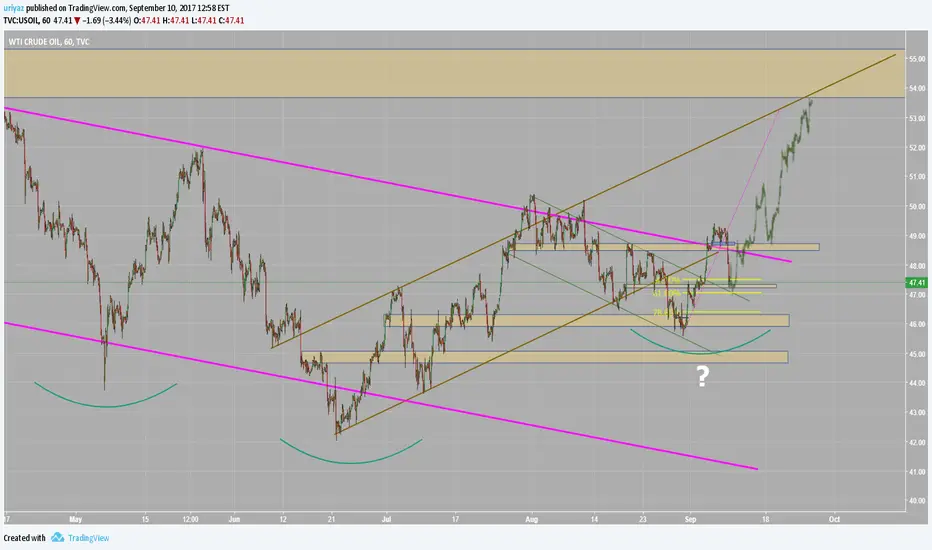
USOIL - looking to buy after more Price actionAfter a rapid move down Oil stalled on support area.
I'll be waiting for more Price action to come , will wait for a reverasl pattern / some accumulation and false break of a low before buying.
Best of luck :-)
EURNZD - waiting to buy on supportWaiting for the right shoulder to be created.
If pattern will look like it fail ( false of the low and back above support zone ) then i'll look to buy.
Everything is on the chart...
Best of luck :-)

Looking to sell Gold ( XAUUSD )XAUUSD is in uptrend and upper channel line is holding for now.
If price will break it i'll look to sell the retest as described on the chart ( as default right shoulder will be created ).
support and resistance are marked on chart - please note the most important confulence with fib.
Also, this chart can help the traders who think gold will continue its uptrend or those who think it will crash.
Best of luck :-)

EURGBP possible buyPrice inside strong buy zone - looking to buy after reversal pattern.
Might get a nice pivot long here if trend will continue to the upside

EURUSD - 40 pips short from resistancesupport and resistance levels works like a charm.
wait for price rise to resistance , wait for reversal pattern and take 40 pips short .
Then look for big long at support zone and bottom of the channel .
Best of luck :-)

GOLD - plan short the false break and buy bottomWaiting gold make another high and back to channel to short it as a false break .
Everything describe on the chart.
Best of luck :-)
