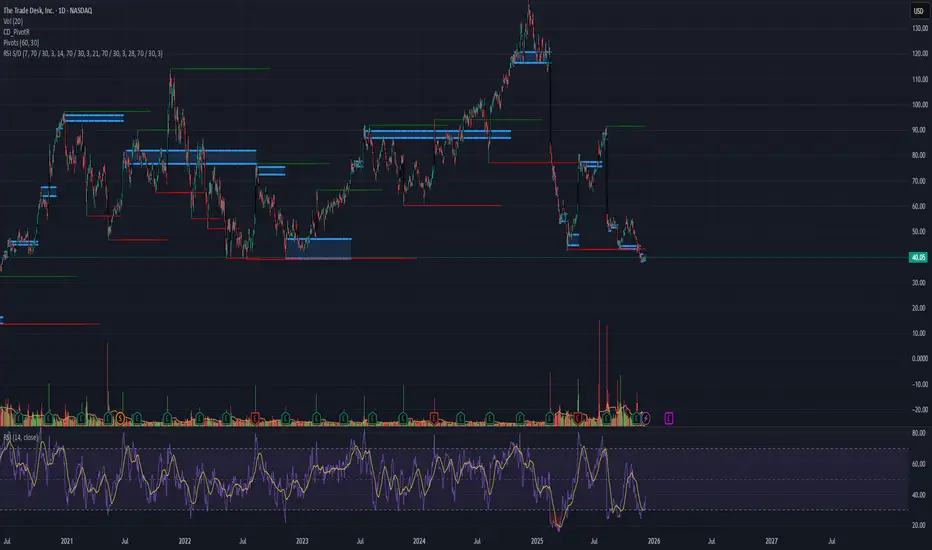
Fast Bounce Setup | Price: 40.05 → Target: 42.05 (+5%)Fast Bounce Setup | Price: 40.05 → Target: 42.05 (+5%) 📈⚡
Fundamentals 📊
TTD maintains strong long-term revenue growth, driven by rising digital ad spending and increasing adoption of programmatic advertising.
Profit forecasts also show healthy growth, strengthening the short-term upside potential.
Repeated Behavior 🔍
TTD has a well-defined behavioral pattern historically:
after sharp selloffs or oversold conditions, the stock often delivers 5%–100% quick bounces before consolidating.
Today’s setup fits the same repeated cycle seen in prior reversals.
Volume & Price Action 🔥
Recent volume indicates buyer accumulation after a wave of selling pressure.
Price is currently sitting at a familiar zone where TTD has shown fast short-term rebounds multiple times.
Entry: 40.05
Target: 42.05
Profit: +5% expected 💰⚡
Fastprofit
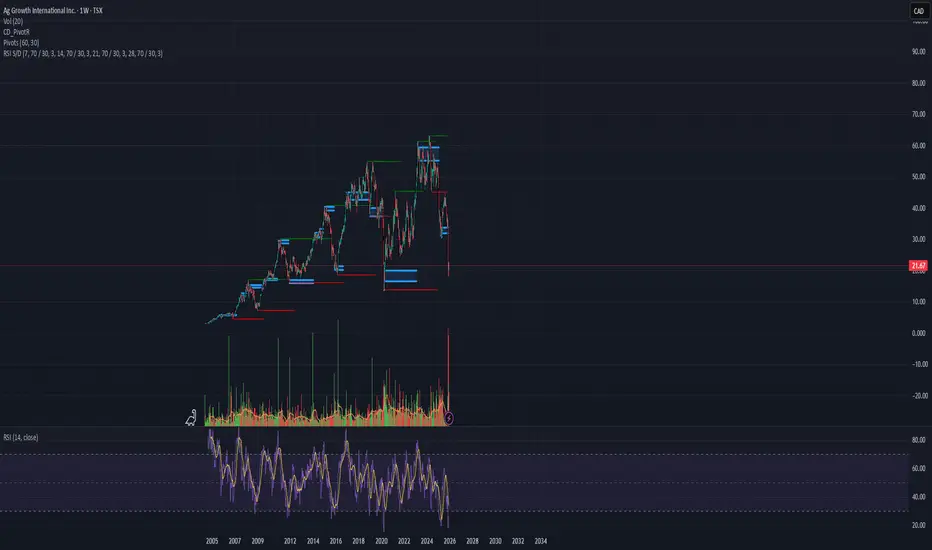
Weekly Trading Idea | AFN.AG 21.67 | Fast 5% Bounce TargetThis is my fast strategy for short moves (3–5%) ⚡
I publish these setups weekly with a win rate above 90% 📈🔥
Fundamentals are not bad 👍
The drop from ~$65 → ~$20 should be enough for a short bounce 🎯
📊 Forecast also shows an increase in revenue and profit in the coming years, which supports the upside 📈💵
From the technical side:
RSI oversold 📉
Strong support zone 🧱
Price action showing reversal signs 🔄
For a small quick profit, this looks like a good entry point 💰⚡
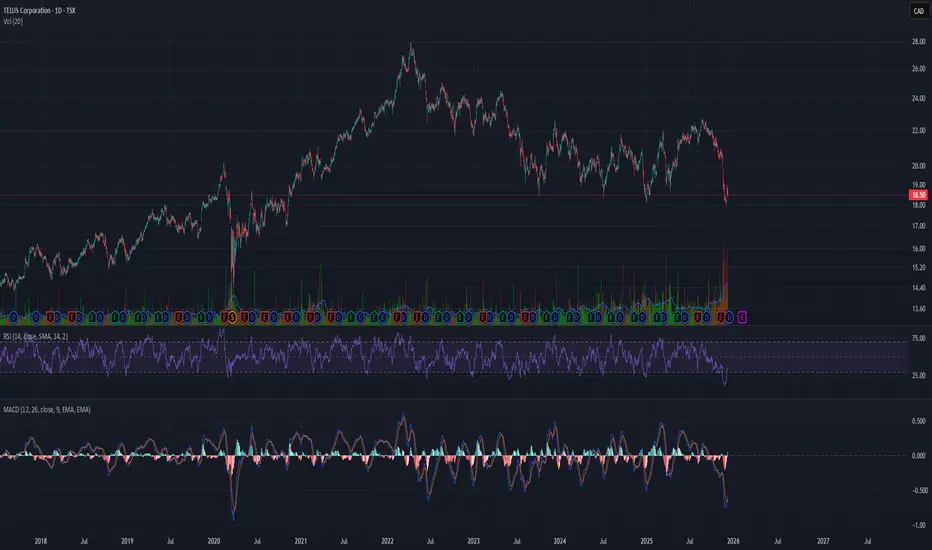
Fast Bounce Setup | Price: 18.53 → Target: 19.46 (+5%)
Fundamentals 📊💼
TELUS shows stable revenue forecasts and long-term growth in telecom and digital services.
Even during pullbacks, fundamentals remain supportive for short, quick moves.
Repeated Behavior 🔁📉➡️📈
Historically, T reacts with 5%–20% quick bounces after deep drops or oversold conditions.
Current pattern is similar to previous reversal cycles.
Volume & Price Action 🔥📊
Volume shows buyer interest, and price is sitting at a classic TELUS bounce zone.
Entry: 18.53 💵
Target: 19.46 🎯
Profit: +5% expected 💰⚡
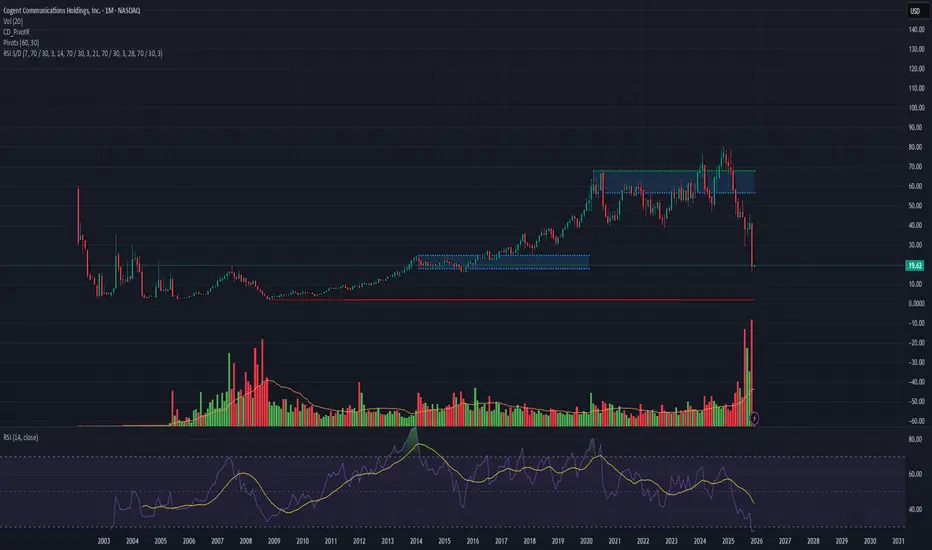
CCOI Fast Bounce Setup | 19.62 → 20.60(+5%)
CCOI just printed the highest monthly volume in its entire history since IPO 🔥
This type of volume spike often signals a short-term reversal or momentum bounce.
RSI Behavior 🔍
Across the daily, weekly, and monthly intervals, RSI has shown a repeated pattern of bouncing 10%–100% after oversold conditions.
Based on this history, a 5% bounce from here is completely reasonable and aligned with previous cycles 🎯📉➡️📈
Fundamentals 📊
Revenue forecasts are improving and gradually compensating for weaker past years.
This supports the upside even during a downtrend.
Risk Note ⚠️
Catching profit in a downtrend is always aggressive.
But the volume structure + RSI behaviour build a strong short-term case.
As always, we only select stocks with predicted revenue growth, that are oversold, and that show a repeated behavioural pattern in similar conditions.
Our strategy is not based on one fixed formula for all stocks.
Each symbol has its own unique pattern that repeats historically, and we focus only on that repeated behaviour. This is why every setup is different — it must match the stock’s own history. 🔍📈
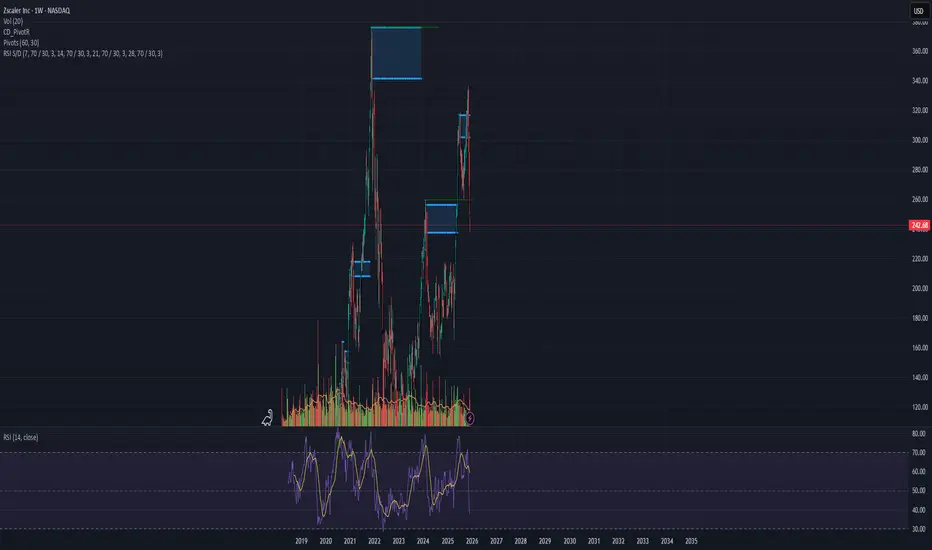
Fast Bounce Setup | Price: 242.68 → Target: 254.81 (+5%)Fundamentals 📊💼
Strong revenue growth from rising demand in cloud security and zero-trust solutions.
Forecasts support short-term upside momentum.
Repeated Behavior 🔁📉➡️📈
ZS often makes 5%–30% quick bounces after oversold drops.
The current pattern strongly matches earlier reversal cycles.
Volume & Price Action 🔥📊
Volume shows buyer accumulation, and price is sitting at a familiar bounce zone where ZS reacts quickly.
Entry: 242.68 💵
Target: 254.81 🎯
Profit: +5% expected 💰⚡
Fast Bounce Setup | Price: 242 → Target: 254.10 (+5%)Fast Bounce Setup | Price: 242 → Target: 254.10 (+5%) 📈⚡
Fundamentals 📊
VEEV shows steady revenue and profit growth, supported by strong demand for its cloud solutions in the life sciences sector.
Repeated Behavior 🔍
Historically, VEEV produces 5%–25% quick bounces after oversold or sharp pullback zones.
Current price action matches those previous reversal patterns.
Volume & Price Action 🔥
Volume shows accumulation and the price is sitting on a familiar bounce level.
Entry: 242
Target: 254.10
Profit: +5% expected 💰⚡

Fast Bounce Setup | Price: 3.61 → Target: 3.79 (+5%)Fundamentals 📊
STKL shows improving revenue and margin forecasts, indicating gradual recovery.
Even though long-term movement has been unstable, the short-term fundamental outlook supports a bounce.
Repeated Behaviour 🔍
Historically, STKL has shown a clear behavioural pattern:
after deep pullbacks or oversold conditions, it regularly produces 5%–1000% bounces before stabilizing.
Today’s setup matches those previous repeated cycles.
Volume & Price Action 🔥
Recent volume activity suggests seller exhaustion and early accumulation.
Price is sitting exactly in a zone where STKL has shown multiple fast rebounds in the past.
Entry: 3.61
Target: 3.79
Profit: +5% expected 💰⚡

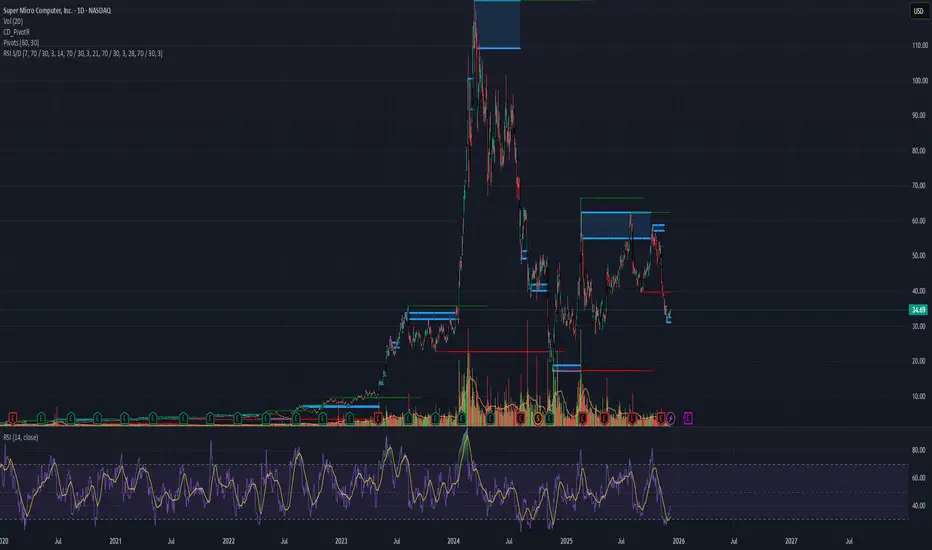
Fast Bounce Setup | Price: 34.69 → Target: 36.42 (+5%)Fundamentals 📊
SMCI continues to show strong revenue and profit forecasts, supported by growing demand in AI servers and high-performance computing hardware.
The long-term outlook is strong, which also supports short-term bounce setups.
Repeated Behavior 🔍
Historically, SMCI has shown a clear behavioral pattern: after sharp pullbacks or oversold phases, it typically produces 5%–50% bounces before stabilizing.
The current structure matches those previous behavior cycles.
Price Action 🔥
Recent volume spikes and the pullback zone align with previous SMCI reversal phases.
Price is reacting at a familiar technical level where the stock has shown fast rebounds.
Entry: 34.69
Target: 36.42
Profit: +5% 💰⚡
This setup is based entirely on the repeated behavioral pattern of SMCI itself.
Each stock has its own cycle — we do not use one fixed formula.
All signals come from pure behavior analysis.
#BehaviorBasedTrading 🔍📈
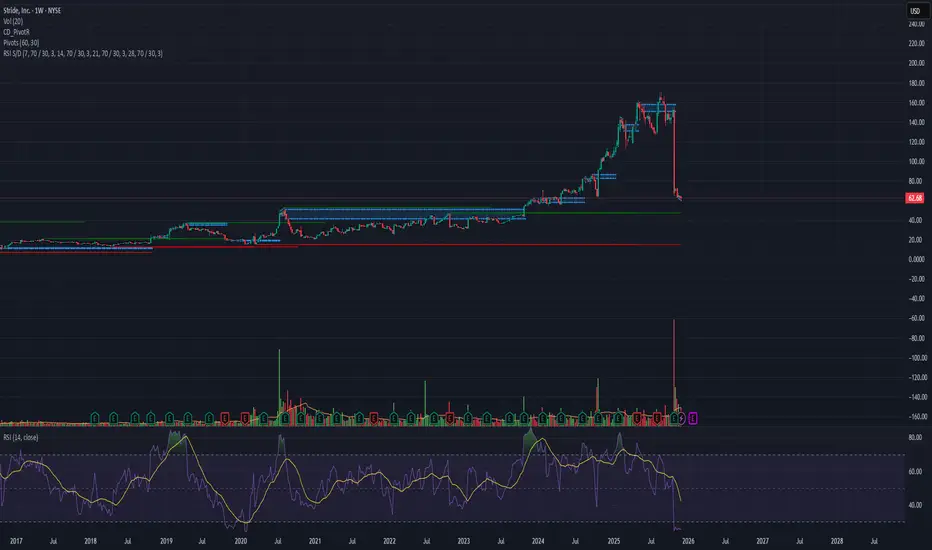
Fast Reversal Setup | Price: 62.68 → Target: 65.81 (+5%)
After the recent lawsuit-related news, LRN dropped sharply from $155 → $62 and is now deep in the oversold area 📉🔥
Volume Signal 📊
This week’s traded volume is higher than anything since its IPO, which often marks a reversal zone.
Repeated Patterns 🔍
Across the daily, weekly, and monthly intervals, the stock is showing its typical reversal pattern, matching previous bounce cycles.
Entry: 62.68
Target: 65.81
Profit: +5% 💰⚡
Fast Bounce Setup | Price: 63.33 → Target: 66.49 (+5%)Fundamentals 📊
HALO continues to show strong revenue and profit forecasts, with steady growth expectations.
The fundamental outlook remains supportive for short-term upside.
Repeated Behavior 🔍
This stock has a repeated pattern of delivering at least a 5% bounce from similar oversold or congested zones.
The current structure matches previous cycles.
Price Action 📉➡️📈
Price action at this level is reacting to a resistance zone, which historically leads to a quick 5% reaction move before continuation or pullback.
