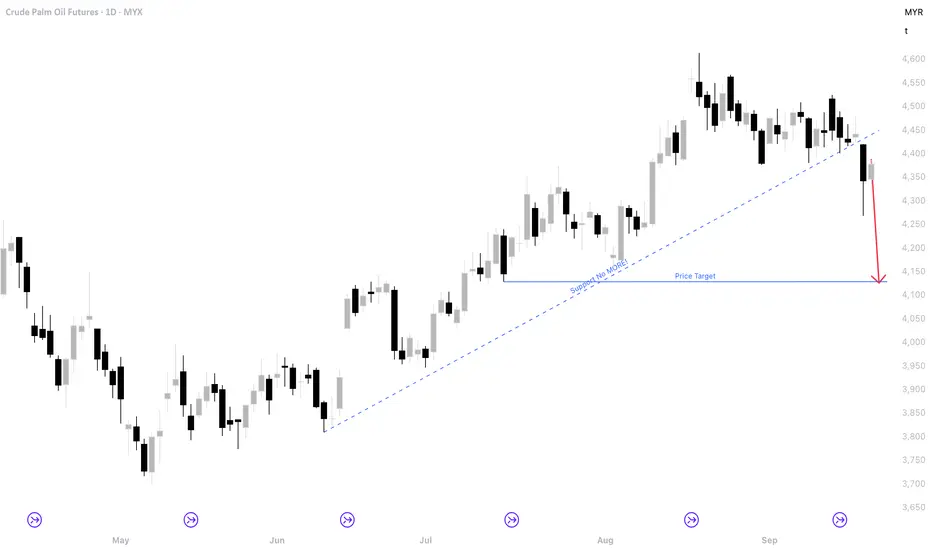
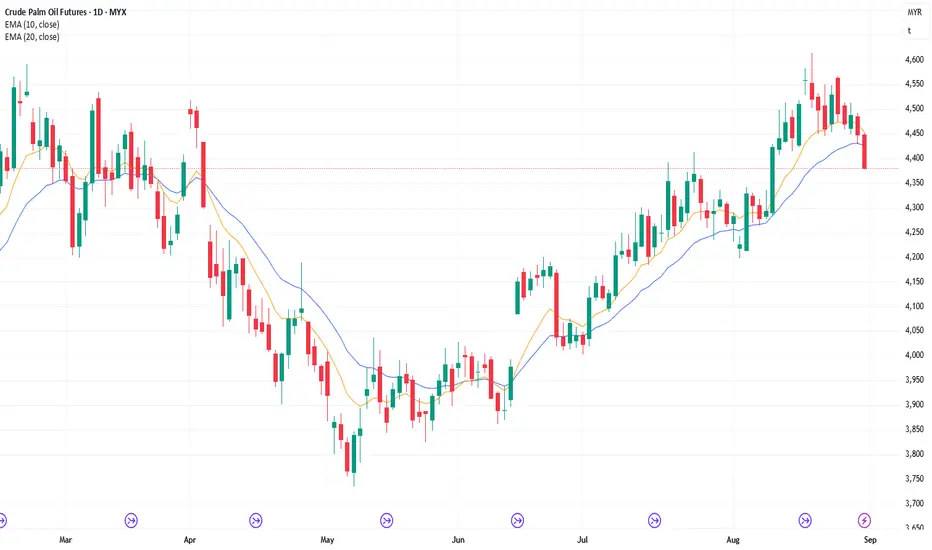
FCPO Week 39 2025: To test 4100!A month of consolidation and price didn't break higher and instead looking to go lower. 4100 might be the area to test. Looking for opportunity to SELL.
Fcpo!
24/9/25 Can Bears Create FT Selling or Fail To Do So?
Tuesday’s candlestick (Sept 23) was a big bear bar closing around the middle of its range with a long tail below.
In our last report, we stated that traders would observe whether the bears could get a strong bear bar closing near its low, or if there would be a prominent tail below the daily candlestick, indicating some profit-taking activity.
The market gap down further in the morning, but lacked follow-through selling. The market traded sideways to up for the day.
The bulls view the current move as a deeper two-legged pullback and want a reversal from a large double bottom bull flag (Aug 29 and Sep 23).
They want the pullback to lack follow-through selling, as has been the case with all recent pullbacks (July 1 and August 4).
They want the move (Sep 23) to turn into a bear trap.
They want the breakout to fail, reversing back into the trading range (around the 4450 area).
They must create strong bull bars to show they are back in control.
The bears got a deep pullback from a larger double top bear flag (Sept 9 and Sept 17).
They got a breakout below the recent tight trading range, trading below the 20-day EMA and the bull trend line.
The long tail below today's candlestick indicates the bears are not yet as strong as they could be.
They need sustained follow-through selling to increase the odds of a reversal.
Production for Sept should be flat or down. Oct's production should be flat to down as well.
Refineries' appetite to buy remains decent.
Export: Sept: First 20 days +8% per ITS.
So far, the bears have managed to break out of the tight trading range.
Traders will see if the bears can create follow-through selling, or they will fail to do so, as seen in recent major pullbacks (July 1 and August 4).
For tomorrow (Wednesday, Sept 24), traders will see if the bears can create follow-through selling, even if it is only a bear doji.
Or will the market close with a bull body, testing near the recent tight trading range (the 4400 area) instead?
Andrew

23/9/25 Strong Breakout from Tight Trading Range
Monday’s candlestick (Sept 22) was a bull doji closing in its lower half with a long tail above.
In our last report, we stated that traders would see if the bears could create follow-through selling below the 20-day EMA, or if the move would lack follow-through selling (again), reversing above the 20-day EMA later in the week.
The market traded higher to test the 20-day EMA but reversed and closed below it. The market gap down and sold off during the night session.
The bulls see the current move as a deeper pullback.
They want the pullback to lack follow-through selling, as has been the case with all recent pullbacks (July 1 and August 4).
They must create strong bull bars to show they are back in control.
The bears view the move (Sep 17) as forming a larger double top bear flag (Sept 9 and Sept 17).
They got a breakout below the recent tight trading range, trading below the 20-day EMA and the bull trend line.
They need sustained follow-through selling to increase the odds of a strong reversal.
Production for Sept should be flat or down. Oct's production should be flat to down as well.
Refineries' appetite to buy remains decent.
Export: Sept: First 20 days +8% per ITS.
So far, the bears have managed to break out of the tight trading range. The market could still trade sideways to down for now.
For tomorrow (Tuesday, Sept 23), traders will see if the bears get a strong bear bar closing near its low. If this is the case, the market could still trade lower on Wednesday.
Or will there be a prominent tail below the daily candlestick, indicating some profit-taking activity?
Andrew
22/9/25 Bears Need FT, Can They Do It?
Friday’s candlestick (Sept 19) was an inside doji closing in its lower half with a long tail above.
In our last report, we stated that traders would observe whether the bears could create a strong bear bar closing near its low, or if the market would trade sideways to up instead.
The market traded higher to test the 20-day EMA but reversed and closed near its low. The weekly candlestick closed as a bear bar with a small tail below.
The bulls want the 20-day EMA and the bull trend line to act as support. They want the current move to form a bear trap.
They want the pullback to be weak and sideways, lacking follow-through selling, as has been the case with all recent pullbacks (Jul 1 and Aug 4).
They want it to form a wedge bull flag (Aug 29, Sep 10, and Sep 18).
They must create follow-through buying above the 20-day EMA to increase the odds of a retest and a breakout above the August high.
The bears view the move (Sep 17) as forming a larger double top bear flag (Sept 9 and Sept 17).
They need to create strong follow-through selling, trading below the 20-day EMA and the bull trend line to increase the odds of a sustained move.
Production for Sept should be flat or down.
Refineries' appetite to buy remains decent.
Export: Sept: First 15 days +2.55% per ITS.
So far, the market has been trading sideways with poor follow-through and frequent reversals. This is a hallmark of a trading range.
For tomorrow (Monday, Sept 22), traders will see if the bears can create follow-through selling below the 20-day EMA.
Or will the move lack follow-through selling (again), reversing above the 20-day EMA later in the week?
Andrew

19/9/25 Can Bears Get FT Selling or Fail Again?
Thursday’s candlestick (Sept 18) was a consecutive bear bar closing in its lower half with a long tail below.
In our last report, we stated that traders would observe whether the bears could create sustained follow-through selling below the 20-day EMA or if the market would trade slightly lower but then reverse back above the 20-day EMA.
The market traded lower to test the August 29 low, but closed off its low.
The bulls want the 20-day EMA and the bull trend line to act as support. They want the current move to form a bear trap.
They want the pullback to be weak and sideways, lacking follow-through selling, as has been the case with all recent pullbacks (Jul 1 and Aug 4).
They want it to form a wedge bull flag (Aug 29, Sep 10, and Sep 18).
They must create follow-through buying above the 20-day EMA to increase the odds of a retest and a breakout above the August high.
The bears view the move (Sep 17) as forming a larger double top bear flag (Sept 9 and Sept 17).
They need to create strong follow-through selling, trading below the 20-day EMA and the bull trend line to increase the odds of a sustained move.
Production for Sept should be flat or down.
Refineries' appetite to buy remains decent.
Export: Sept: First 15 days +2.55% per ITS.
So far, the market has been trading sideways with poor follow-through and frequent reversals. This is a hallmark of a trading range.
For tomorrow (Friday, Sept 19), traders will see if the bears can create a strong bear bar closing near its low. If they can, the weekly candlestick will close near its low, increasing the odds of next week trading at least a little lower.
Or will the market trade sideways to up instead? If the market closes higher, the weekly candlestick will close with a long tail below or above the middle of its range, reducing the recent bearishness.
Andrew

19/8/25 No FT Buying, Bears Need FT Selling
Monday’s candlestick (Sept 17) was a big bear bar closing in its lower half with a prominent tail below.
In our last report, we stated that traders would observe whether the bulls could create sustained follow-through buying above the 20-day EMA, or if the market would gap up but lack follow-through buying, thereby reversing below the 20-day EMA again.
The market gapped significantly higher, but lacked follow-through buying, reversing to test the 20-day EMA.
The bulls want the 20-day EMA and the bull trend line to act as support.
They want the pullback to be weak and sideways, lacking follow-through selling, as has been the case with all recent pullbacks (Jul 1 and Aug 4).
They want it to form a higher low (Aug 29) followed by a reversal from a double bottom bull flag (Aug 29 and Sep 10).
They must create follow-through buying above the 20-day EMA to increase the odds of a retest and a breakout above the August high.
The bears view the move (Sep 17) as forming a larger double top bear flag (Sept 9 and Sept 17).
They need to create strong follow-through selling, trading below the 20-day EMA and the bull trend line to increase the odds of a sustained move.
Production for Sept should be flat or down.
Refineries' appetite to buy remains decent.
Export: Sept: First 15 days +2.55% per ITS.
So far, the market has been trading sideways with poor follow-through and frequent reversals. This is a hallmark of a trading range.
For tomorrow (Thursday, Sept 18), traders will see if the bears can create sustained follow-through selling below the 20-day EMA.
Or will the market trade slightly lower, but reverse back above the 20-day EMA again?
Andrew

17/9/25 Market to Gap Up, Bulls Need Strong FT Buying
Friday’s candlestick (Sept 12) was a doji bar closing around the middle of its range.
In our last report, we stated that traders would see if the bulls could create a follow-through bull bar above the 20-day EMA, or if the move would lack follow-through buying, resulting in a reversal below the 20-day EMA again.
The market initially traded higher but lacked follow-through buying, subsequently trading lower. The market bounced off its low to close above the 20-day EMA.
The bulls want the 20-day EMA and the bull trend line to act as support. So far, this is the case.
They want the pullback to be weak and sideways, lacking follow-through selling, as has been the case with all recent pullbacks (Jul 1 and Aug 4).
They want it to form a higher low (Aug 29) followed by a reversal from a double bottom bull flag (Aug 29 and Sep 10).
They hope the Sept 10 bear bar will form a bear trap and want the market to reverse above the 20-day EMA. If the bulls can create strong follow-through buying next week, the odds of this will increase.
They must create follow-through buying above the 20-day EMA to increase the odds of a retest and a breakout above the August high.
The bears view the recent move (Sep 9) as forming a small double top bear flag (Sept 3 and Sept 9).
They need to create strong follow-through selling, trading below the 20-day EMA and the bull trend line to increase the odds of a sustained move.
If the market trades higher, they want the Sept 9 high or 4500 round number area to be resistance, forming a wedge bear flag.
Production for Sept should be flat or down.
Refineries' appetite to buy remains decent.
Export: Sept: First 10 days -1% per ITS.
So far, the market has been trading sideways with poor follow-through and frequent reversals. This is a hallmark of a trading range.
The market would likely gap up tomorrow.
For tomorrow (Wednesday, Sept 17), traders will see if the bulls can create sustained follow-through buying above the 20-day EMA. If they can, the odds of a bear trap will increase.
Or will the market gap up but lack follow-through buying, reversing below the 20-day EMA again?
Andrew

12/9/25 No FT Selling, Bulls Need Strong FT Buying
Thursday’s candlestick (Sept 11) was an inside bull bar closing in its upper half with a long tail below and a prominent tail above.
In our last report, we stated that traders would see if the bears could create a follow-through bear bar, or if the market would stall, and retest near the 20-day EMA instead.
The market traded lower, but there was no follow-through selling, reversing to close above the 20-day EMA.
The bulls want the 20-day EMA and the bull trend line to act as support.
They want the pullback to be weak and sideways, lacking follow-through selling, as has been the case with all recent pullbacks (Jul 1 and Aug 4).
They want it to form a higher low (Aug 29) followed by a reversal from a double bottom bull flag (Aug 29 and Sep 10).
They hope Wednesday's candlestick will form a bear trap and want the market to reverse above the 20-day EMA. If the bulls can create strong follow-through buying on Friday, the odds of this will increase.
They must create follow-through buying above the 20-day EMA to increase the odds of a retest and a breakout above the August high.
The bears view the recent move as forming a small double top bear flag (Sept 3 and Sept 9).
They need to create strong follow-through selling, trading below the 20-day EMA and the bear trend line to increase the odds of a sustained move.
So far, the bears haven’t been able to create follow-through selling below the 20-day EMA again.
If the market trades higher, they want the Sept 9 high area to be resistance, forming a wedge bear flag.
Production for Sept should be flat or down.
Refineries' appetite to buy remains decent.
Export: Sept: First 10 days -1% per ITS
So far, the market has been trading sideways with poor follow-through and frequent reversals. This is a hallmark of a trading range.
So far, the bears haven't been able to create follow-through selling below the 20-day EMA.
The bulls want a strong bull bar tomorrow so that the weekly candlestick will close near its high. If this is the case, it will increase the odds of next week trading at least a little higher.
The bears want tomorrow to close as a strong bear bar, so that the weekly candlestick will be bearish.
For tomorrow (Friday, Sept 11), traders will see if the bulls can create a follow-through bull bar above the 20-day EMA. If they can, the odds of a bear trap will increase.
Or will the move lack follow-through buying, resulting in a reversal below the 20-day EMA again?
Andrew

11/9/25 Can Bears Create FT Selling, or Bear Trap?
Wednesday’s candlestick (Sept 10) was a big bear bar closing in its lower half with a prominent tail below.
In our last report, we stated that traders would observe whether the bears could create strong follow-through selling, closing below the 20-day EMA, or if the market would trade slightly lower but stall, reversing to close above the 20-day EMA instead.
The market formed a retest of the Aug 29 low, closing as a bear bar below the 20-day EMA and a higher low so far.
The bulls want the 20-day EMA and the bull trend line to act as support.
They want the pullback to be weak and sideways, lacking follow-through selling, as has been the case with all recent pullbacks (Jul 1 and Aug 4).
They want it to form a higher low (Aug 29) followed by a reversal from a double bottom bull flag (Aug 29 and Sep 10).
They hope Wednesday's candlestick will form a bear trap and want the market to reverse above the 20-day EMA.
If the market trades lower, they want the Aug 29 low to act as support.
They must create follow-through buying above the 20-day EMA to increase the odds of a retest and a breakout above the August high.
The bears view the recent move as forming a small double top bear flag (Sept 3 and Sept 9).
They need to create strong follow-through selling, trading below the 20-day EMA and the bear trend line to increase the odds of a sustained move.
The next target for the bears is the Aug 29 low.
Production for Sept should be flat or down.
Refineries' appetite to buy remains decent.
Export: Sept: First 10 days -1% per ITS
So far, the market has been trading sideways with poor follow-through and frequent reversals. This is a hallmark of a trading range.
Traders want to see if the bears can create follow-through selling below the 20-day EMA.
Or will the market lack follow-through selling yet again, as it has in previous times, forming a bear trap?
For tomorrow (Thursday, Sept 11), traders will see if the bears can create a follow-through bear bar, closing below the 20-day EMA.
Or will the market stall, and retest near the 20-day EMA instead?
Andrew

10/9/25 No Strong FT Buying Still, Can Bears Create FT Selling?
Tuesday’s candlestick (Sept 9) was a bear doji closing below the middle of its range.
In our last report, we stated that traders would assess whether the bulls could create strong follow-through buying over the next few days, or if the market would trade slightly higher but stall, forming long tails above candlesticks or bear bodies.
The market traded higher but lacked follow-through buying, turning lower in the second half of the afternoon.
The bulls want the 20-day EMA and the bull trend line to act as support.
They want the pullback to be weak and sideways, lacking follow-through selling, as has been the case with all recent pullbacks (Jul 1 and Aug 4).
They want it to form a higher low (Aug 29) followed by a reversal from a small double bottom bull flag (Sep 4 and Sep 10).
If the market trades lower, they want the Sept 4 or Aug 29 low to act as support.
They must create follow-through buying above the 20-day EMA to increase the odds of a retest and a breakout above the August high.
The bears view the current move as forming a small double top bear flag (Sept 3 and Sept 10).
They need to create strong follow-through selling, trading below the 20-day EMA and the bear trend line to increase the odds of a sustained move.
The next targets for the bears are the Sept 4 or Aug 29 low.
Production for Sept should be flat or down.
Refineries' appetite to buy remains decent.
Export: Sept: Seems like first 10 days +11% per ITS (Estimate)
So far, the market has been trading sideways with poor follow-through and frequent reversals. This is a hallmark of a trading range.
The 20-day EMA and bull trendline are currently acting as support.
For tomorrow (Wednesday, Sept 10), traders will see if the bears can create strong follow-through selling, closing below the 20-day EMA.
Or will the market trade slightly lower, but stall, reversing to close above the 20-day EMA instead?
Andrew

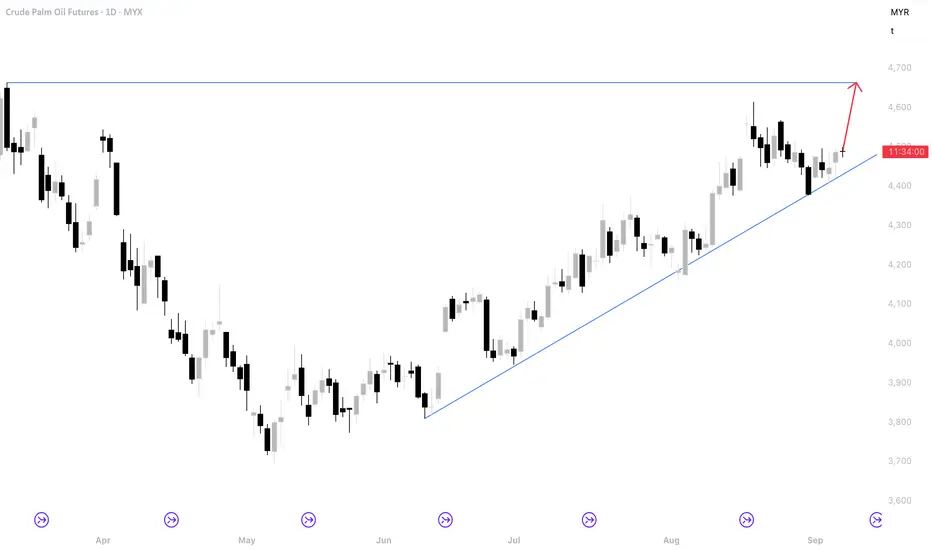
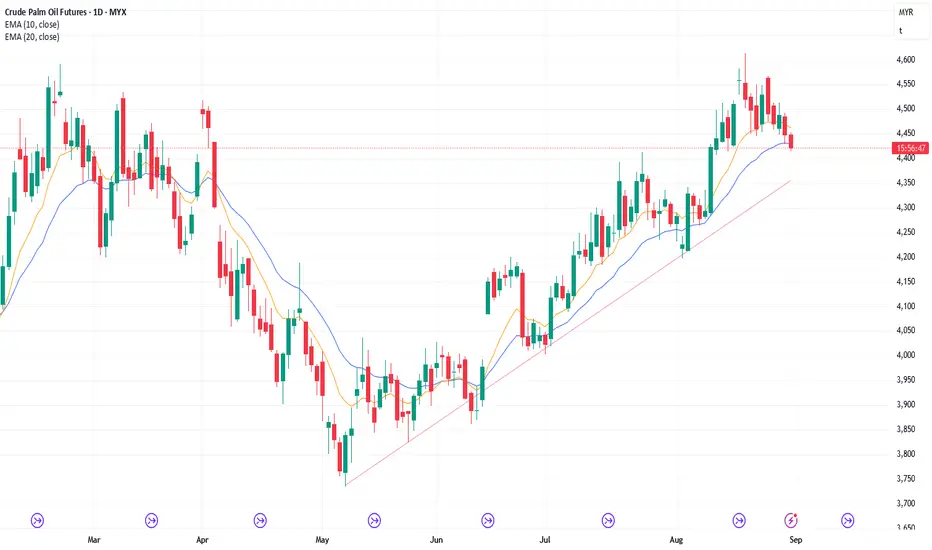
FCPO Week 37 2025: Bullish to 4600.Price held up well at the current level. It can either continue to consolidate or it is already ready to go higher towards 4600. Look for opportunity to go long.
9/9/25 Bulls Need Strong Follow-through Buying
Monday’s candlestick (Sept 9) was a bull bar closing near its high with a long tail below.
In our last report, we stated that traders would observe whether the bears could form a strong retest of the August 29 low, or if the 20-day EMA would continue to act as support, and the market would close above the 20-day EMA instead.
The market traded lower early in the day, but then reversed higher as the 20-day EMA acted as support.
The bulls want the 20-day EMA and the bull trend line to act as support.
They want the pullback to be weak and sideways, lacking follow-through selling, as has been the case with all recent pullbacks (Jul 1 and Aug 4).
They want it to form a higher low (Aug 29) followed by a reversal from a double bottom bull flag (Aug 21 and Aug 29).
They view the recent move (Sept 4) as a retest of the prior low, and want it to form a higher low (vs Aug 29).
They must create follow-through buying above the 20-day EMA to increase the odds of a retest and a breakout above the August high.
The bears want a reversal from a wedge pattern (June 20, July 24, and August 19), and a large double top bar flag with the February high.
They view the current move as forming a small double top bear flag (Sept 3 and Sept 9).
They need to create strong follow-through selling, trading below the 20-day EMA and the bear trend line to increase the odds of a sustained move.
If the market trades higher, they want it to form a lower high or a double top (vs Aug 19).
Production for Sept should be flat or down.
Refineries' appetite to buy remains decent.
Export: Sept: Seems like first 5 days +29% per ITS
So far, the recent sideways to down pullback has formed a higher low (Aug 29). The 20-day EMA and bull trendline are currently acting as support.
For tomorrow (Tuesday, Sept 9), traders will see if the bulls create strong follow-through buying over the next few days. If they can, the odds of a retest of the August high will increase.
Or will the market trade slightly higher, but stall, forming long tails above candlesticks or bear bodies?
Andrew

8/9/25 Can the 20-day EMA Hold as Support?
Thursday’s candlestick (Sept 4) was a bull doji closing below the middle of its range with prominent tails.
In our last report, we stated that traders would see if the bears could form a strong retest of the August 29 low, or if the market would trade slightly lower but lack follow-through selling, closing with a long tail below or a bull body, and above the 20-day EMA.
The market traded lower but lacked follow-through selling, closing with a bull body above the 20-day EMA.
The bulls want the 20-day EMA and the bull trend line to act as support.
They want the pullback to be weak and sideways, lacking follow-through selling, as has been the case with all recent pullbacks (Jul 1 and Aug 4).
They want it to form a higher low followed by a reversal from a double bottom bull flag (Aug 21 and Aug 29).
They view the recent move (Sept 4) as a retest of the prior low, and want it to form a higher low (vs Aug 29).
They need to create follow-through buying above the 20-day EMA to increase the odds of a retest and a breakout above the August high.
The bears want a reversal from a wedge pattern (June 20, July 24, and August 19), and a large double top bar flag with the February high.
They view Sept 3 as a pullback forming a lower high.
They need to create strong follow-through selling, trading below the 20-day EMA and the bear trend line to increase the odds of a sustained move.
If the market trades higher, they want it to form a lower high or a double top (vs Aug 19).
Production for Sept should be flat or down.
Refineries' appetite to buy remains decent.
Export: Sept: TBA
So far, the recent sideways to down pullback has formed a higher low (Aug 29). The 20-day EMA and bull trendline are currently acting as support.
For tomorrow (Monday, Sept 8), traders will see if the bears can form a strong retest of the August 29 low.
Or will the 20-day EMA continue to act as support, and the market trade and close above the 20-day EMA instead?
Andrew

4/9/25 Retest Aug 29 Low, Strong FT Selling or Fail Again?
Tuesday’s candlestick (Sept 3) was a bear doji closing below the middle of its range with prominent tails.
In our last report, we stated that traders would observe whether the bulls could generate strong follow-through buying or if the market would trade slightly higher, but close with a long tail above or a bear body instead.
The market traded higher but lacked sustained follow-through buying, closing with a small bear body.
The bulls want the 20-day EMA and the bull trend line to act as support.
They want the pullback to be weak and sideways, lacking follow-through selling, as has been the case with all recent pullbacks (Jul 1 and Aug 4).
They want it to form a higher low followed by a reversal from a double bottom bull flag (Aug 21 and Aug 29).
They view the current move as a retest of the prior low, and want it to form a higher low (vs Aug 29).
They need to create follow-through buying above the 20-day EMA to increase the odds of a retest and a breakout above the August high.
The bears want a reversal from a wedge pattern (June 20, July 24, and August 19), and a large double top bar flag with the February high.
They view Sept 3 as a pullback forming a lower high.
They need to create strong follow-through selling, trading below the 20-day EMA and the bear trend line to increase the odds of a sustained move.
If the market trades higher, they want it to form a lower high or a double top (vs Aug 19).
Production for Sept should be flat or down.
Refineries' appetite to buy remains decent.
Export: August export up 10%.
So far, the recent sideways to down pullback has formed a higher low. The 20-day EMA and bull trend line are acting as support for now.
For tomorrow (Thursday, Sept 4), traders will see if the bears can form a strong retest of the August 29 low.
Or will the market trade slightly lower but lack follow-through selling, closing with a long tail below or a bull body, and above the 20-day EMA?
Andrew

3/9/25 Bulls Need Follow-Through Buying
Monday’s candlestick (Sept 2) was a bull bar closing near its high.
In our last report, we stated that traders would assess whether the bears could create follow-through selling or if the market would reverse sharply, creating a bear trap.
The market gapped up and closed higher above the 20-day EMA. The bears were unable to create follow-through selling.
The bulls want the 20-day EMA and the bull trend line to act as support, and the pullback to be weak and sideways, lacking follow-through selling, as has been the case with all recent pullbacks (Jul 1 and Aug 4).
They want it to form a higher low followed by a reversal from a double bottom bull flag (Aug 21 and Aug 29).
They hope Friday's candlestick will become a bear trap. They need to create follow-through buying to increase the odds of a retest and a breakout above the August high.
The bears want a reversal from a wedge pattern (June 20, July 24, and August 19), and a large double top bar flag with the February high.
They need to create strong follow-through selling, trading below the 20-day EMA and the bear trend line to increase the odds of a sustained move.
If the market trades higher, they want it to form a lower high or a double top.
Production for Sept should be flat or down.
Refineries' appetite to buy remains decent.
Export: August export up 10%.
So far, the recent sideways to down pullback has formed a higher low. There was no follow-through selling below the 20-day EMA.
For tomorrow (Wednesday, Sept 3), traders will see if the bulls can create strong follow-through buying. If they can, the odds of a retest near the August high will increase.
Or will the market trade slightly higher, but close with a long tail above or a bear body instead?
Andrew
2/9/25 Can Bears Create FT Selling, or Bear Trap?
Friday’s candlestick (Aug 29) was a bear bar closing near its low.
In our last report, we stated that traders would see if the bears could create strong follow-through selling, closing below the 20-day EMA, or if the market would find support at the 20-day EMA and close higher for the day instead.
The bears got follow-through selling, closing below the 20-day EMA.
The bulls want the 20-day EMA and the bull trend line to act as support, and the pullback to be weak and sideways, lacking follow-through selling, as has been the case with all recent pullbacks (Jul 1 and Aug 4).
They want it to form a higher low followed by a reversal from a double bottom bull flag (Aug 21 low).
They hope Friday's candlestick will become a bear trap.
They want a retest and a breakout above the August high.
They need to create strong bull bars to show they are back in control.
The bears want a reversal from a wedge pattern (June 20, July 24, and August 19), and a large double top bar flag with the February high.
They need to create strong follow-through selling, trading below the 20-day EMA and the bear trend line to increase the odds of a sustained move.
If the market trades higher, they want it to form a lower high or a double top.
Production for Sept should be flat or down.
Refineries' appetite to buy remains decent.
Export: August export up 10%.
The sideways to down pullback phase is still underway.
Traders will see if the bears can create follow-through selling. Or will the market reverse sharply, creating a bear trap?
For tomorrow (Tuesday, Sept 2), traders will see if the bears can create strong follow-through selling below the 20-day EMA.
Or will the market reverse above the 20-day EMA instead?
Andrew
29/5/25 Sideways to Down PB testing the 20-day EMA
Thursday’s candlestick (Aug 28) was a bear bar closing in its lower half with a prominent tail below.
In our last report, we stated that traders would observe whether the bulls could create a strong follow-through bull bar or if the market would trade lower, breaking below the August 21 low and testing the 20-day EMA instead.
The bulls were not able to create a follow-through bull bar, and the market traded lower to test the 20-day EMA.
They want the 20-day EMA and the bull trend line to act as support and the pullback to be weak and sideways, lacking follow-through selling, as has been the case with all recent pullbacks.
They want it to form a higher low followed by a reversal from a double bottom bull flag (Aug 21 low).
They need to create strong bull bars to show they are back in control.
The bears want a reversal from a wedge pattern (June 20, July 24, and August 19), and a large double top bar flag with the February high.
They need to create strong follow-through selling, trading below the 20-day EMA and the bear trend line to increase the odds of a sustained move.
Production for August may be flat or down. Sept should be flat or down as well.
Refineries' appetite to buy remains decent.
Export: August export up 10% in the first 25 days.
So far, the pullback phase is still holding above the 20-day EMA and is a higher low.
The sideways to down pullback phase is still underway.
Tomorrow's daily candlestick will determine the weekly candlestick. The bulls want a strong bull bar so that the weekly candlestick will close with a long tail below. The bears want a strong bear bar so that the weekly candlestick will close near its low, which increases the odds of the market trading at least a little lower next week.
For tomorrow (Friday, Aug 29), traders will see if the bears can create strong follow-through selling, closing below the 20-day EMA.
Or will the market find support at the 20-day EMA and close higher for the day instead?
Andrew
28/8/25 Bulls Need a Strong Follow-through Bull Bar
Wednesday’s candlestick (Aug 27) was a bull bar closing slightly above the middle of its range with a prominent tail above.
In our last report, we stated that traders would observe whether the bears could create a strong second leg sideways to down, breaking below the August 21 low and testing the 20-day EMA, or if the market would trade lower but stall around the August 21 low or the 20-day EMA instead.
So far, the second leg sideways to down is stalling around the August 21 low area.
The bulls see the current move as part of a two-legged pullback.
They want any pullback to be weak and sideways, lacking follow-through selling, as has been the case with all recent pullbacks.
They want it to form a double bottom bull flag with the August 21 low.
They need to create a strong follow-through bull bar tomorrow to increase the odds of a retest of the August 19 high, followed by a strong breakout above.
If the market trades lower, the bulls want the 20-day EMA to act as support.
The bears want a reversal from a wedge pattern (June 20, July 24, and August 19), and a large double top bar flag with the February high.
They view the current move as the second leg sideways to down.
They need to create strong follow-through selling, trading below the August 21 low to increase the odds of a reversal.
Production for August may be flat or down. Sept should be flat or down as well.
Refineries' appetite to buy remains decent.
Export: August export up 10% in the first 25 days.
So far, the pullback phase has been mostly sideways, characterized by overlapping candlesticks. The pullback appears to be minor for now.
The bulls need to create a strong follow-through bull bar to increase the odds of a reversal from a double bottom bull flag.
For tomorrow (Thursday, Aug 28), traders will see if the bulls can create a strong follow-through bull bar. If they do, the odds of retesting the August 19 high will increase.
Or will the market trade lower, breaking below the August 21 low and testing the 20-day EMA instead?
Andrew

27/8/25 PB Phase, Bears Need Strong FT Selling
Tuesday’s candlestick (Aug 26) was a follow-through bear bar closing near its low.
In our last report, we stated that traders would see if the bears could create a strong second leg sideways to down testing the August 21 low, or if the second leg sideways to down would lack strong follow-through selling, stalling around the August 21 low instead.
The market is forming the second leg sideways to down, testing the August 21 low.
The bulls see the current move as part of a two-legged pullback.
They want any pullback to be weak and sideways, lacking follow-through selling, as has been the case with all recent pullbacks.
They want it to form a double bottom bull flag with the August 21 low.
They want a retest of the August 19 high, followed by a strong breakout above it after the pullback.
If the market trades lower, the bulls want the 20-day EMA to act as support.
The bears want a reversal from a wedge pattern (June 20, July 24, and August 19), and a large double top bar flag with the February high.
They see the current move as the second leg sideways to down.
They need to create strong follow-through selling, trading below the August 21 low to increase the odds of a reversal.
Production for August may be flat or down. Sept should be flat or down as well.
Refineries' appetite to buy remains decent.
Export: August export up 10% in the first 25 days.
The market is still in the sideways to down pullback phase following the wedge pattern.
So far, the pullback phase has been mostly sideways, characterized by overlapping candlesticks. The pullback appears to be minor for now.
For tomorrow (Wednesday, Aug 27), traders will see if the bears can create a strong second leg sideways to down, breaking below the August 21 low and testing the 20-day EMA.
Or will the market trade lower, but stall around the August 21 low or the 20-day EMA instead?
Andrew
26/8/25 2-Legged Sideways to Down Pullback
Monday’s candlestick (Aug 25) was a bear bar closing in its lower half with a small tail below.
In our last report, we stated that traders would see if the bulls could create a follow-through bull bar and sustained follow-through buying testing the August 19 high, or if the bears would be able to get a lower high (vs Aug 19) and another sideways to down leg.
The market opened higher but lacked follow-through buying and traded lower. The bulls could not get a follow-through bull bar.
The bulls want another strong leg up that lasts for several weeks.
They see the current move as part of a two-legged pullback.
They want any pullback to be weak and sideways, lacking follow-through selling, as has been the case with all recent pullbacks.
They want a retest of the August 19 high, followed by a strong breakout above it after the pullback.
If the market trades lower, they want it to form a double bottom bull flag with the August 21 low.
The bears want a reversal from a wedge pattern (June 20, July 24, and August 19), and a large double top bar flag with the February high.
They see the current move (Friday and Monday) as the second leg sideways to down.
If the market trades higher, they want it to stall below the August 19 high, forming a small double top.
They want the Feb high area to act as resistance.
They need to create strong follow-through selling, trading below the August 21 low to increase the odds of a reversal.
Production for August may be flat or down. Sept should be flat or down as well.
Refineries' appetite to buy remains decent.
Export: August export up 10% in the first 25 days.
So far, the buying pressure is stronger (consecutive bull bars) compared to the weaker selling pressure (bear bars with no follow-through selling).
So far, the pullback phase has been mostly sideways, characterized by overlapping candlesticks. The pullback appears to be minor.
For tomorrow (Tuesday, Aug 26), traders will see if the bears can create a strong second leg sideways to down testing the August 21 low.
Or will the second leg sideways to down lack strong follow-through selling, stalling around the August 21 low instead?
Andrew

25/8/25 Bulls Need Sustained Follow-through Buying
Friday’s candlestick (Aug 22) was a bull bar closing in its upper half with a prominent tail above.
In our last report, we stated that traders would see if the bulls could create a strong retest of the August 19 high, or if the bears would be able to get a lower high (vs Aug 19) and another sideways to down again.
The market traded higher, and the bears were not able to get another bear bar.
The bulls want another strong leg up that lasts for several weeks.
They want any pullback to be weak and sideways, lacking follow-through selling, as has been the case with all recent pullbacks. So far, this appears to be the case.
They want a retest of the August 19 high followed by a strong breakout above it.
They need to create follow-through buying next week to increase the odds of a sustained move.
The bears want a reversal from a wedge pattern (June 20, July 24, and August 19), and a large double top bar flag with the February high.
They see Friday as a pullback and want a second leg sideways to down.
If the market trades higher, they want it to stall below the August 19 high, forming a small double top.
They want the Feb high area to act as resistance.
They need to create strong follow-through selling to increase the odds of a reversal.
Production for August may be flat or down. Sept should be flat or down as well.
Refineries' appetite to buy remains decent.
Export: August export up 13% in the first 20 days.
So far, the buying pressure is stronger (consecutive bull bars) compared to the weaker selling pressure (bear bars with no follow-through selling).
So far, the pullback (Aug 21) has overlapping candlesticks and appears to be minor.
For tomorrow (Monday, Aug 25), traders will see if the bulls can create a follow-through bull bar and sustained follow-through buying testing the August 19 high.
Or will the bears be able to get a lower high (vs Aug 19) and another sideways to down leg?
Andrew

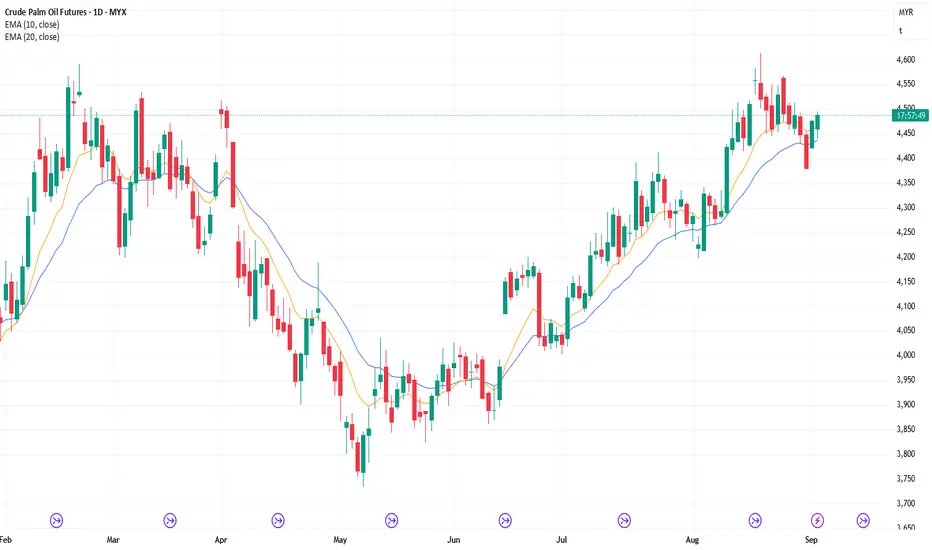
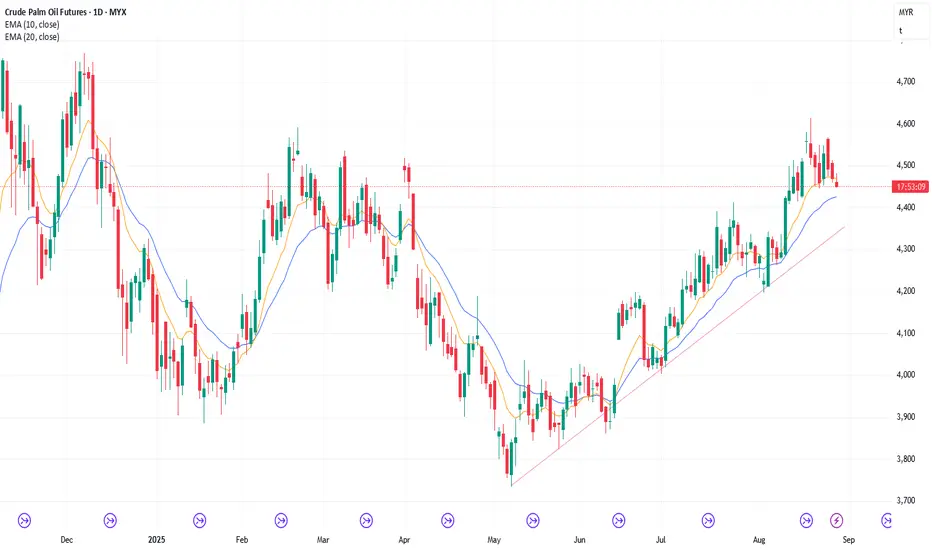
FCPO Week 35 2025: Retracement?The concept is that price didn't go up in a straight line. Therefore I'm expecting that price will retrace a bit towards 4330 area before continuing higher with 4600 as target. However if price fail to defend the support area (as shown in chart) then there is likelihood that price is going lower towards 4200.
Happy trading.

22/8/25 Minor PB, Bulls Want Retest Aug 19 High
Thursday’s candlestick (Aug 21) was an outside bear bar closing in its lower half with a long tail above.
In our last report, we stated that traders would observe whether the bulls could create a strong retest of the August 19 high, or if the bears would be able to establish a lower high (compared to August 19) and a second leg sideways to down.
The market traded higher but lacked follow-through buying. The bears got a second leg sideways to down.
The bulls want another strong leg up that lasts for several weeks.
They want any pullback to be weak and sideways, lacking follow-through selling, as has been the case with all recent pullbacks. So far, this appears to be the case.
They want a retest of the August 19 high followed by a strong breakout above it.
If the market trades lower, they want the 20-day EMA to act as support.
The bears want a reversal from a wedge pattern (June 20, July 24, and August 19), and a large double top bar flag with the February high.
At the least, they want a two-legged pullback.
If the market trades higher, they want it to stall below the August 19 high, forming a small double top.
They want the Feb high area to act as resistance.
They need to create strong follow-through selling to increase the odds of a reversal.
Production for August may be flat or down. Sept should be flat or down as well.
Refineries' appetite to buy remains decent.
Export: August export up 13% in the first 20 days.
So far, the buying pressure is stronger (consecutive bull bars) compared to the weaker selling pressure (bear bars with no follow-through selling).
The market formed a pullback after testing the February high.
Traders are wondering if the current pullback would be minor (lacking follow-through selling) like all recent pullbacks, or if the bears would finally be able to create strong consecutive bear bars instead? Traders will continue to monitor the next few days.
So far, the pullback has an overlapping range and appears to be minor.
For tomorrow (Friday, Aug 22), traders will see if the bulls can create a strong retest of the August 19 high. If they can, the weekly candlestick will close near its high, which will increase the odds of next week trading at least a little higher.
Or will the bears be able to get a lower high (vs Aug 19) and another sideways to down again? If the bears can get a strong bear bar, the weekly candlestick will close with a big bear body, which will reduce the recent bullishness.
Andrew
