FET SHort exitMy NYSE:FET short exit remains $1.4 at the High Volume Node support EQ.
I don't expect FET to be a significant player moving forward.
Safe trading
FET

FET global trend. Ascending channel. Wedge. AI hype. 01 2026Logarithm. 1-month time frame. Linear chart without market noise. The idea is to visually understand the long-term trend direction of this cryptocurrency. The AI monopolists—giants of the non-cryptocurrency world—are using it.
Medium-term and local.
FET secondary trend. Wedge. Fractals. AI hype. January 2026

FET secondary trend. Wedge. Fractals. AI hype. January 2026Logarithm. 1-week time frame. Classic trading based on reversal zones and the resulting wedge formation.
This zone is in the main trend (entire trading history). 1-month time frame. Suitable for long-term investment for those for whom trading is not their occupation.
FET global trend. Ascending channel. Wedge. AI hype. 01 2026
Markets move according to their market phases:
1) accumulation + sometimes part of it capitulation;
2) participation, that is, a price rise towards distribution;
3) distribution + sometimes part of it super hype;
4) decline, that is, a price drop towards accumulation zones and a repetition of the "golden ring of Baal's calf (Baal)"...
That is, markets move according to the seasonality of the action of large capital “without personal” (supply/demand).

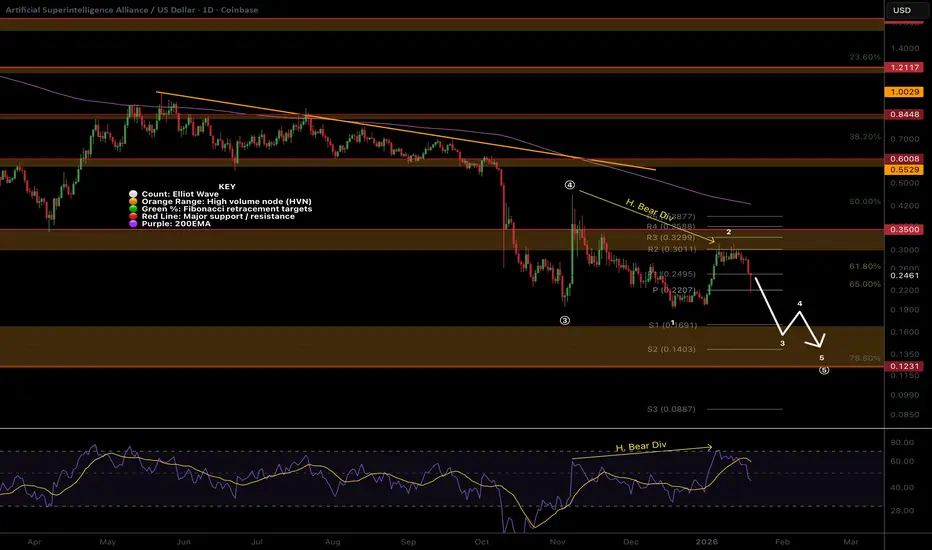
FET looking for new lows, downtrend in tact, h. bear divNYSE:FET
🎯The downtrend is intact, with wave 2 appearing complete. Wave 3 down is strong and hard. Price appears to want to continue lower to test the altCoin golden pocket at 0.786 Fibonacci retracement.
📈 Daily RSI went too high, too fast, and printed hidden bearish divergence at a High Volume node. The rejection was hard and swift.
👉 Analysis is invalidated above wave 2 swing high, $0.3.
Safe trading
A buying opportunity has formed on FET (4H)A clear bullish Change of Character (CHoCH) has formed on the chart, created with strong momentum from buyers. This shift in market structure indicates that bullish participants are gaining control and that the probability of continuation to the upside has increased.
At the moment, price is trading around a key level, an area that has previously acted as an important decision zone for the market. Holding and accepting value above this level strengthens the bullish scenario and increases the likelihood of further upward movement.
Above the current price, there is a large liquidity pool formed around recent highs. This liquidity has not yet been taken and may be swept in the near future, which often acts as a catalyst for an impulsive bullish move.
We have identified two entry zones on the chart. Rather than entering aggressively, it is recommended to enter positions using a DCA (Dollar-Cost Averaging) approach within these areas to manage risk and reduce exposure to volatility.
Targets are clearly marked on the chart.
Once price reaches Target 1, consider taking partial profits. After securing some gains, the stop loss should be moved to break-even, allowing the remaining position to run with reduced risk while targeting higher levels.
As always, proper risk management is essential, and patience in execution will be key for this setup.
If you would like us to analyze a coin or altcoin for you, first like this post, then comment the name of your altcoin below.

$FET bullish setupey traders,
I’m feeling pumped today and bringing you the second analysis of the day. The last time I talked about NYSE:FET I was wrong and the price dropped sharply. This time, backed by my previous analysis on Ethereum dominance, I believe Fetch could perform quite well over the coming months.
Leaving behind the legal issues with Ocean Protocol, it seems the project is about to regain momentum. It has been forming higher lows over the past few weeks, and I’ve noticed some very interesting on-chain accumulation.
Because of that, I think it may enter a small rally in the next few months:
1st target → $0.50
2nd target → $0.80
3rd target → $1.00
As I always say — stay smart and stay calm!
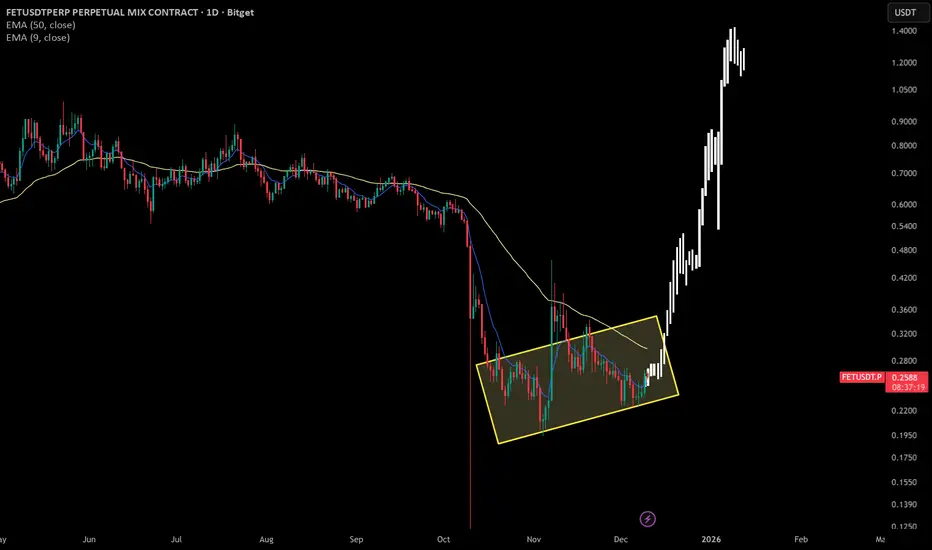
FETUSDT Forming Bullish MomentumFETUSDT is forming a clear bullish momentum pattern, a classic bullish reversal signal that often indicates an upcoming breakout. The price has been consolidating within a narrowing range, suggesting that selling pressure is weakening while buyers are beginning to regain control. With consistent volume confirming accumulation at lower levels, the setup hints at a potential bullish breakout soon. The projected move could lead to an impressive gain of around 90% to 100% once the price breaks above the wedge resistance.
This falling wedge pattern is typically seen at the end of downtrends or corrective phases, and it represents a potential shift in market sentiment from bearish to bullish. Traders closely watching FETUSDT are noting the strengthening momentum as it nears a breakout zone. The good trading volume adds confidence to this pattern, showing that market participants are positioning early in anticipation of a reversal.
Investors’ growing interest in FETUSDT reflects rising confidence in the project’s long-term fundamentals and current technical strength. If the breakout confirms with sustained volume, this could mark the start of a fresh bullish leg. Traders might find this a valuable setup for medium-term gains, especially as the wedge pattern completes and buying momentum accelerates.
✅ Show your support by hitting the like button and
✅ Leaving a comment below! (What is your opinion about this Coin?)
Your feedback and engagement keep me inspired to share more insightful market analysis with you!

#FET/USDT bullish momentum#FET
The price is moving in a descending channel on the 1-hour timeframe. It has reached the lower boundary and is heading towards breaking above it, with a retest of the upper boundary expected.
We have a downtrend on the RSI indicator, which has reached near the lower boundary, and an upward rebound is expected.
There is a key support zone in green at 0.2280. The price has bounced from this level multiple times and is expected to bounce again.
We have a trend towards consolidation above the 100-period moving average, as we are moving close to it, which supports the upward movement.
Entry price: 0.2440
First target: 0.2522
Second target: 0.2630
Third target: 0.2765
Don't forget a simple principle: money management.
Place your stop-loss order below the support zone in green.
For any questions, please leave a comment.
Thank you.

FETUSDT – Trade ideaFET has shown a local market structure shift (MSS) and is currently pulling back into a key demand zone.
This setup aligns with a TOTAL Market Cap MSS on the 4H, supporting a broader bullish continuation scenario.
Bias
As long as price holds above demand, a bounce and continuation higher is favored.
Confluence with TOTAL MC MSS (4H) increases the probability of this move.
Invalidation
Acceptance below demand invalidates the bullish setup.
Are you waiting for reaction at demand or already positioned? 📊👀
MrC

FET/USDT – Long Trade Setup (Daily)FET/USDT – Long Trade Setup (Daily)
Price forming a base after a strong downtrend
Falling wedge/compression near support
Price below cloud, but selling pressure weakening
Long Plan
Entry Zone: 0.19 – 0.205
Stop Loss: 0.1840
Targets:
T1: 0.26
T2: 0.32
T3: 0.37+
DYOR | NFA

TradeCityPro | FET Testing Key Range, Bears in Control for Now👋 Welcome to TradeCity Pro!
In this analysis, I want to review FET, one of the AI projects, which with a market cap of $558 million is ranked 80th on CoinMarketCap.
⏳ 4-hour timeframe
On the 4-hour timeframe, this coin is ranging between the zones 0.2321 and 0.2652.
💥 The overall trend for FET is currently bearish, but the price is now ranging between these two zones and forming a new structure.
⚡️ After the last time the price reached 0.2652, it got rejected, and volume started decreasing, and it is still decreasing.
✔️ The bottom of the range can also be considered as a support zone. Breaking this zone would be a very good trigger for a short position, and the price could move towards 0.2021 after breaking this level.
🎲 The middle line of the range is at 0.2472, and breaking this level will give us a early long trigger.
✨ The next level we can open the main long position after breaking is 0.2652.
📝 Final Thoughts
Stay calm, trade wisely, and let's capture the market's best opportunities!
This analysis reflects our opinions and is not financial advice.
Share your thoughts in the comments, and don’t forget to share this analysis with your friends! ❤️

FET/USDT — Decision Point: The 0.21–0.14 Zone That Defined!The FET/USDT weekly chart is revisiting one of the most historically significant zones in its entire price history — the 0.21–0.14 demand block.
This zone is not just a support area. It has consistently acted as the boundary between Accumulation and Capitulation since 2019. Every major FET rally began only after this zone was defended.
And now, price has returned to this zone once again — making this a major decision point for the next macro trend.
---
Why This Zone Matters
The 0.21–0.14 range served as the structural base for the powerful rallies in 2020, 2021, and the AI-driven surge in 2024.
The sharp downside wick below the zone followed by a fast recovery suggests a liquidity grab, hinting that larger players may still be accumulating here.
Price action is forming a compression pattern, a structure that typically precedes explosive breakouts — either up or down.
This is a point where the market rarely stays quiet for long.
---
Technical Structure & Pattern
FET has formed Lower Highs since the 2024 peak → medium-term downtrend still intact.
But price reactions within 0.21–0.14 remain strong, indicating an early-stage reaccumulation pattern.
The wick sweep below the zone resembles a potential Wyckoff Spring, not yet confirmed but clearly visible.
In simple terms:
If this zone holds, a long-term reversal can begin. If it fails, the chart opens the door to a new bearish leg.
---
Bullish Scenario
🔵 1. Demand Holds: “Buyers Take Control”
If the weekly candle closes above 0.21–0.18, it signals that buyers are still defending this historical demand block.
A stronger confirmation appears once price reclaims 0.30, the nearest structural resistance.
➡️ Bullish Targets:
0.30 → short-term confirmation
0.50 – 0.60 → mid-range resistance
0.90 – 1.50 → major recovery zone
2.50 – 3.40 → full cycle retracement if the AI narrative reignites
This would frame the 0.21–0.14 zone as a macro reaccumulation base before the next expansion phase.
---
Bearish Scenario
🔴 1. Clean Breakdown: “Demand Fails”
A weekly close below 0.14 would invalidate the entire multi-year structure.
If that happens:
the demand block collapses,
bearish continuation becomes highly likely,
and the chart enters a deeper macro range.
➡️ Bearish Targets:
0.10 – 0.07 → historical liquidity zone from 2019–2020
Further downside becomes possible if momentum accelerates
A breakdown below 0.14 would turn FET into a completely new market structure.
---
Key Insight
FET is currently sitting on a zone that has defined every major trend shift for the past 5 years.
The next weekly closes will determine whether we are entering:
a Phase B Accumulation → new macro rally, or
a structural breakdown → multi-month bearish continuation.
This is the calm before a major move — and the 0.21–0.14 zone remains the battlefield.
---
#FETUSDT #FetchAI #CryptoAnalysis
#KeyLevel #DecisionPoint #WeeklyChart #CryptoTA
#SupportZone #Wyckoff #SmartMoneyConcepts #AINarrative

FETUSDTThe overall trend of BINANCE:FETUSDT remains bearish as long as the price stays below the major moving averages. However, a potential bullish correction could start if buyers defend the key demand zone around $0.2100. A break above $0.3400 would strengthen bullish momentum and shift focus toward higher resistance targets.
Supports
$0.2100
$0.1120
Resistances
$0.3400
$0.5500
$0.7800

FET 🚨📊 FET Update
FET has also formed a new resistance zone in red 🔴.
This level is now acting as a strong ceiling,
and price must break out above this red resistance
to show any real bullish momentum again.
Until that breakout happens,
sellers remain in control and upside stays limited.

FET looking more and more like a pump & dump scam.Huge engulfing candle from the oversold threshold just above the 0.786 alt-coin golden pocket.
The trend remains down despite this candle with no bullish market structure yet. The weekly 200EMA is finally turning down. Until we get above the descending trend-line, the probability is lower. The 5-wave structure down hints at no new all-time high, as this is a motif wave.
🎯 Terminal target for the business cycle could see prices as high $1.2 when momentum returns
📈 Weekly RSI tapped oversold with no divergence and can remain here for months
👉 Analysis is invalidated above the weekly pivot
Safe trading

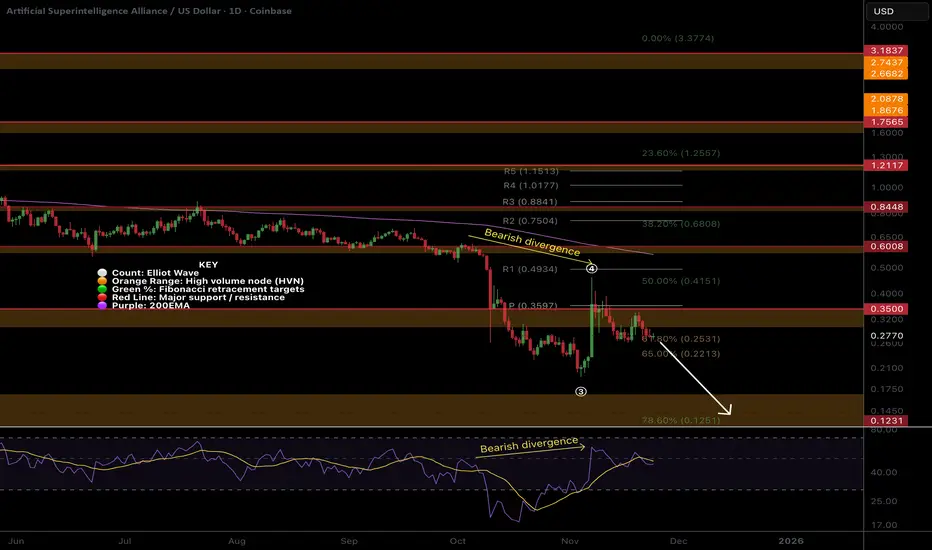
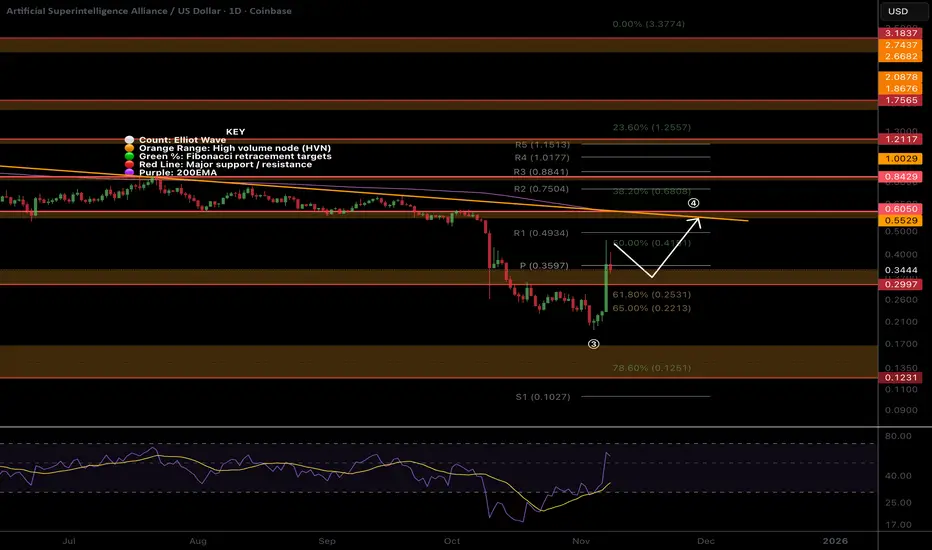
FET looks weak, more downsidePrice bounced with a one-day candle of 70% for wave (4), immediately being rejected on daily bearish divergence.
Chasing candles higher is what’s on the cards of naive investors now. Greed and FOMO immediately took over socials with much gloating, and price humbled them. This is a recipe for lower. Price has lost the High Volume Node, pivot and is well below the 200 EMA.
📈 Daily RSI went too high, too fast, and now has bearish divergence in a bear market, a strong signal.
👉 The next downside target is $0.13
Safe trading
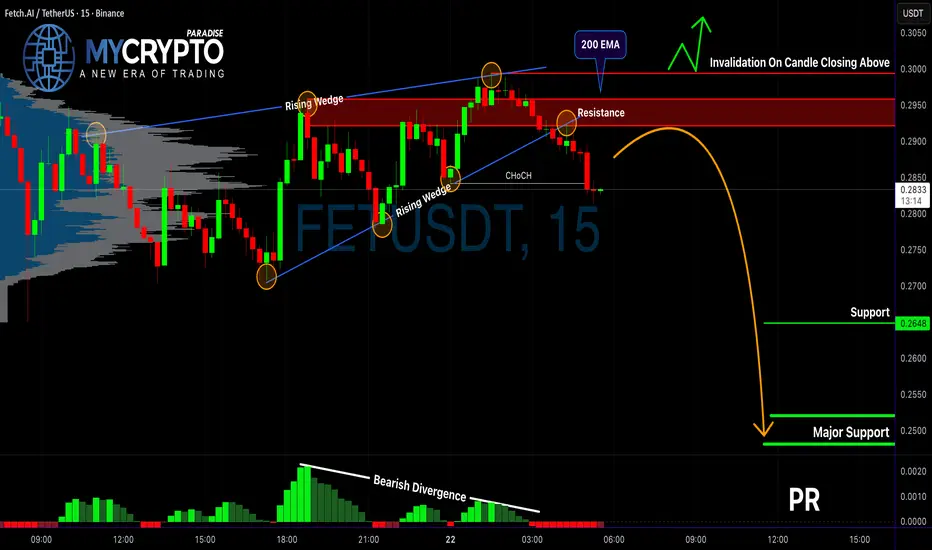
FET Breakdown: Is a Major Dump Just Getting Started?Yello, Paradisers! Have you seen what just happened on FET/USDT? The chart is flashing multiple warning signs, and if you’re not paying close attention, you could get caught on the wrong side of the next big move. Let’s break it down.
💎FETUSDT has officially broken out of a rising wedge pattern—a well-known bearish structure. This breakdown didn’t happen in isolation. It was accompanied by a clear bearish divergence, showing that while the price pushed higher, the underlying momentum was already fading. That’s a red flag for anyone still thinking bullish.
💎More importantly, price action has shown a bearish Change of Character (CHoCH), confirming a potential shift in the trend direction. On top of that, the recent rejection came precisely from the 200 EMA and a known resistance zone, both of which have historically acted as key turning points. When these factors align, they significantly increase the probability of a deeper move to the downside.
💎If the price pulls back from here, the smarter move is to wait for a bearish candlestick pattern to form right at the resistance zone. That would give a cleaner entry with stronger confirmation and a higher reward-to-risk ratio. While aggressive traders may be tempted to enter from current levels—where a 1:1 RR still exists—this is not a sustainable strategy over the long run. Discipline and patience are key if you want to stay consistently profitable.
💎However, if the price breaks out above our invalidation level and closes with conviction, the bearish setup becomes invalid. In that case, it’s best to step aside and wait for more favorable price action to form. There’s no need to rush; missing a trade is always better than forcing one with poor structure.
🎖Strive for consistency, not quick profits. Treat the market as a businessman, not as a gambler.
MyCryptoParadise
iFeel the success🌴
TradeCityPro | FET: Will It Bounce at Support or Fall Further?👋 Welcome to TradeCityPro!
In this analysis, I want to review the FET coin , one of the crypto projects related to artificial intelligence, with a $635 million market cap, currently ranked 78th on CoinMarketCap.
⏳ 4-Hour Timeframe
On the 4-hour timeframe, this coin had an upward movement and then entered a correction phase, reaching an important PRZ support zone.
💡 The zone the price is currently testing is a very critical support area, which we had already identified in the chart. Additionally, this zone coincides with the golden Fibonacci zone.
✔️ Given the length of time the price has been correcting, we can confirm a trend change sooner and don’t need to wait for the main support at 0.2036 to be broken.
🔔 Currently, the selling volume is increasing, and the price has reached the lower bound of the box between 0.2638 and 0.3306.
🧮 There’s significant bearish momentum entering the market, and it can be said that the only reason some coins like FET are still holding above their support is Bitcoin’s dominance.
⚖️ If the price stabilizes below its support zone, we will confirm the bearish trend and can open a short position. The next support levels are 0.2340 and 0.2036.
💫 However, if the price rises and moves toward the upper bound of the box, breaking 0.3306, we can become optimistic about the coin’s upward movement again.
📝 Final Thoughts
Stay calm, trade wisely, and let's capture the market's best opportunities!
This analysis reflects our opinions and is not financial advice.
Share your thoughts in the comments, and don’t forget to share this analysis with your friends! ❤️

FET - Bulls Preparing for a Comeback?FET has completed a clean correction after its previous strong impulse move, retracing all the way back into the support zone around 0.23–0.28, which has been acting as a key demand area for weeks.
Price bounced from that zone and is now attempting to reclaim structure, signaling that buyers might be preparing to take control again.
For now, the market structure is simple:
Impulse upward ➝ Correction ➝ Potential new impulse.
If the bulls manage to hold above the orange zone and break the descending correction trendline, the next impulsive leg toward 0.50 becomes the most likely scenario.
However, if FET breaks back below 0.23, the bullish setup would fail and deeper downside would be expected.
We are now at the stage where the market decides whether the bulls fully take over… or if this bounce is just a pause before another dip. 🤔
⚠️ Disclaimer: This is not financial advice. Always do your own research and manage risk properly.
📚 Stick to your trading plan regarding entries, risk, and management.
Good luck! 🍀
All Strategies Are Good; If Managed Properly!
~Richard Nasr.

#FET/USDT bullish momentum#FET
The price is moving within a descending channel on the 1-hour frame, adhering well to it, and is heading for a strong breakout and retest.
We have a bearish trend on the RSI indicator that is about to be broken and retested, which supports the upward breakout.
There is a major support area in green at 0.2500, which represents a strong support point.
We are heading for consolidation above the 100 moving average.
Entry price: 0.2667
First target: 0.2707
Second target: 0.2795
Third target: 0.2884
Don't forget a simple matter: capital management.
When you reach the first target, save some money and then change your stop-loss order to an entry order.
For inquiries, please leave a comment.
Thank you.

FET, Pump and dump?NYSE:FET Price bounced with a one day candle of 70% recovering the High Volume Node resistance and daily pivot from the golden pocket Fibonacci retracement.
Chasing candles higher is what’s on the cards of naive investors now. Greed and FOMO immediately took over socials with much gloating. This is a recipe for lower, humbling them.
📈 Daily RSI went too high, too fast, and now has bearish divergence in a bear market, a strong signal.
👉 Continued upside has a target of the daily 200EMA and High Volume Node resistance at $0.6.
Safe trading
Fet next period.If weekly closes occur above the parallel channel, the situation becomes positive. Until then, the situation is negative.
The news that will come as a result of the end of their partnership with Ocean Protocol is very important.
* The purpose of my graphic drawings is purely educational.
* What i write here is not an investment advice. Please do your own research before investing in any asset.
* Never take my personal opinions as investment advice, you may lose your money.

FET/USDT — Testing the Critical Support Zone: Will Reversal?The FET/USDT (4D timeframe) chart shows the price currently sitting at the major support area between $0.25 and $0.20, highlighted by the yellow block. This zone has historically acted as a strong demand area, which previously triggered a massive rally toward the $1+ region in late 2023.
The recent sharp drop indicates heavy selling pressure, but the presence of a long lower wick (rejection) around this area suggests that buyers are still defending this key level — signaling a potential buying reaction zone or early accumulation phase.
---
Pattern Description
The price structure is currently in a descending pattern, but it’s now reaching a potential bottom area. The current setup could evolve into a double bottom or accumulation base formation if the price can hold above $0.20 for the next few candles. This region is crucial for defining whether FET is forming a cycle low before a major rebound.
---
Bullish Scenario
Price holds above $0.25–$0.20 and confirms with a bullish reversal candle (hammer or engulfing).
Break and hold above $0.30 will be the first bullish confirmation.
Mid-term targets: $0.385 – $0.57 – $0.78.
If momentum strengthens, the next potential target is $1.09.
---
Bearish Scenario
If price breaks below $0.20 and fails to recover, the next key support lies around $0.113 (historical low).
A confirmed breakdown below $0.20 signals loss of major structure, opening room for a deeper distribution phase.
In an extreme bearish case, FET may form a new cycle low before any sustainable recovery.
---
Conclusion
The $0.25–$0.20 zone is the key decision point for FET/USDT in the medium term.
Holding this support would strengthen the case for a bottom formation and reversal setup,
but losing it would likely confirm a continuation of the downtrend toward lower levels.
---
#FETUSDT #FetchAI #CryptoAnalysis #TechnicalAnalysis #AltcoinUpdate #SupportZone #CryptoReversal #BullishScenario #BearishScenario #MarketStructure #AIcrypto
