FETUSDT at Major Demand — Reversal Brewing or Breakdown Ahead?On the 1W (Weekly) timeframe, FETUSDT remains in a macro downtrend after failing to hold a strong supply area following the 2024 peak. A sequence of Lower Highs (LH) and Lower Lows (LL) continues to form, indicating sellers still dominate the market.
Price is now approaching a major historical demand zone — an area that previously acted as an accumulation base before a large bullish impulse.
Key zone:
0.092 – 0.066 USDT (yellow block on the chart).
This area represents the last defensive demand in the weekly structure.
---
Pattern / Structure Formation
1. Macro Downtrend Structure
Clear formation of LH → LL since the top.
Every relief rally fails to break prior structure.
Signals ongoing distribution / markdown phase.
2. Weekly Supply Rejection
The 2.0 – 3.4 USDT area acts as macro supply.
Long upper wicks indicate heavy sell orders.
3. Demand Retest Phase
Price is currently retesting historical demand.
This zone is the origin of the previous bullish impulse.
Often becomes a smart money accumulation area.
---
Key Levels
Resistance:
0.25 USDT — Minor structure resistance
0.40 USDT — Mid resistance / previous support
0.60 USDT — Breakdown level
1.00 USDT — Psychological + supply flip
Support / Demand:
0.153 USDT — Current weekly reaction
0.092 – 0.066 USDT — Major Demand Zone
0.052 USDT — Absolute macro low
---
Bullish Scenario
The bullish scenario becomes valid if the demand zone holds selling pressure.
Confirmation to watch:
1. Formation of a Weekly Higher Low inside / above demand.
2. Appearance of a bullish engulfing or strong rejection wick.
3. Break of minor structure at 0.25 USDT.
If confirmed, potential upside targets:
0.25 USDT (first relief rally)
0.40 USDT
0.60 USDT
1.00 USDT (macro target)
From a risk-reward perspective, reactions from weekly demand often produce a mid-term reversal or at least a strong relief rally.
---
Bearish Scenario
Bearish continuation occurs if demand fails to hold.
Breakdown confirmations:
1. Weekly close below 0.066 USDT.
2. Lack of significant rejection.
3. Increasing sell volume on breakdown.
Potential downside targets:
0.052 USDT (macro low retest)
Possible entry into lower price discovery if the broader crypto market weakens.
A weekly demand breakdown typically triggers panic selling + capitulation.
---
Conclusion
FET is currently at a macro decision zone.
The 0.092 – 0.066 demand is a critical area.
A bullish reaction could trigger a mid-term reversal.
A breakdown would continue the macro bearish structure.
In short:
This is not a FOMO area — it’s a zone to observe smart money reaction.
#FET #FETUSDT #FetchAI #CryptoAnalysis #TechnicalAnalysis #Altcoin #CryptoTrading #SupplyAndDemand #MarketStructure #WeeklyChart #AltcoinAnalysis
Fetchai

$FET bullish setupey traders,
I’m feeling pumped today and bringing you the second analysis of the day. The last time I talked about NYSE:FET I was wrong and the price dropped sharply. This time, backed by my previous analysis on Ethereum dominance, I believe Fetch could perform quite well over the coming months.
Leaving behind the legal issues with Ocean Protocol, it seems the project is about to regain momentum. It has been forming higher lows over the past few weeks, and I’ve noticed some very interesting on-chain accumulation.
Because of that, I think it may enter a small rally in the next few months:
1st target → $0.50
2nd target → $0.80
3rd target → $1.00
As I always say — stay smart and stay calm!
#FET/USDT bullish momentum#FET
The price is moving in a descending channel on the 1-hour timeframe. It has reached the lower boundary and is heading towards breaking above it, with a retest of the upper boundary expected.
We have a downtrend on the RSI indicator, which has reached near the lower boundary, and an upward rebound is expected.
There is a key support zone in green at 0.2280. The price has bounced from this level multiple times and is expected to bounce again.
We have a trend towards consolidation above the 100-period moving average, as we are moving close to it, which supports the upward movement.
Entry price: 0.2440
First target: 0.2522
Second target: 0.2630
Third target: 0.2765
Don't forget a simple principle: money management.
Place your stop-loss order below the support zone in green.
For any questions, please leave a comment.
Thank you.

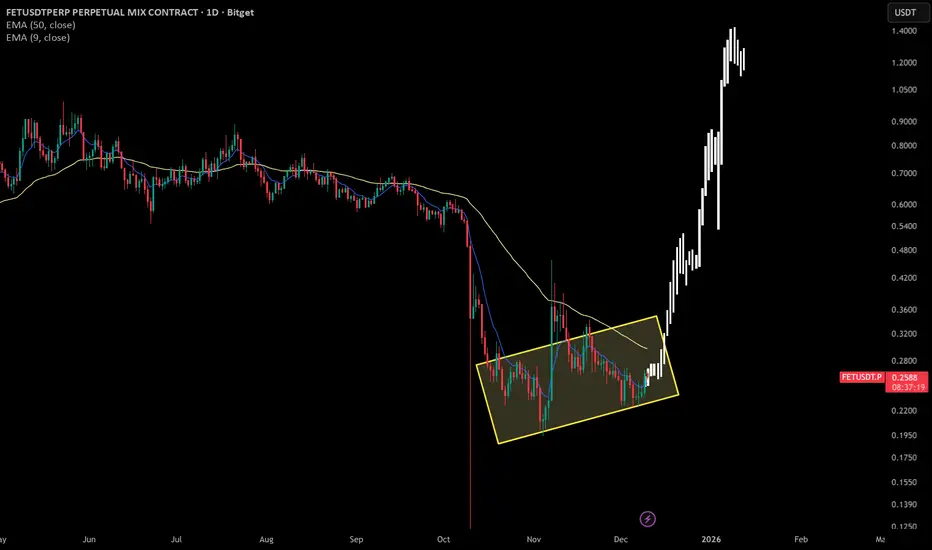
FET/USDT – Long Trade Setup (Daily)FET/USDT – Long Trade Setup (Daily)
Price forming a base after a strong downtrend
Falling wedge/compression near support
Price below cloud, but selling pressure weakening
Long Plan
Entry Zone: 0.19 – 0.205
Stop Loss: 0.1840
Targets:
T1: 0.26
T2: 0.32
T3: 0.37+
DYOR | NFA

FETCH – Weekly AnalysisFETCH is currently trading at a key HTF support zone that has acted as
support → resistance → support multiple times in the past.
Price is also compressing against a descending trendline, which increases the probability of a volatility expansion.
Key observations:
Strong historical support around current price
Downtrend structure still intact
Potential trendline breakout if buyers step in
No confirmation yet → patience required
Bullish scenario:
Weekly close above the descending trendline
Support holds as higher low
➡️ Possible trend reversal / expansion
Bearish scenario:
❌ Loss of HTF support
➡️ Continuation of the macro downtrend
Always wait for confirmation. What’s your bias here?

FETUSDTThe overall trend of BINANCE:FETUSDT remains bearish as long as the price stays below the major moving averages. However, a potential bullish correction could start if buyers defend the key demand zone around $0.2100. A break above $0.3400 would strengthen bullish momentum and shift focus toward higher resistance targets.
Supports
$0.2100
$0.1120
Resistances
$0.3400
$0.5500
$0.7800

#FET/USDT bullish momentum#FET
The price is moving within a descending channel on the 1-hour frame, adhering well to it, and is heading for a strong breakout and retest.
We have a bearish trend on the RSI indicator that is about to be broken and retested, which supports the upward breakout.
There is a major support area in green at 0.2500, which represents a strong support point.
We are heading for consolidation above the 100 moving average.
Entry price: 0.2667
First target: 0.2707
Second target: 0.2795
Third target: 0.2884
Don't forget a simple matter: capital management.
When you reach the first target, save some money and then change your stop-loss order to an entry order.
For inquiries, please leave a comment.
Thank you.

FETUSD Will it continue on its historic bullish pattern?Artificial Superintelligence Alliance (FETUSD) has been trading within a 6.5-year Channel Up ever since its first trading day. The pattern's Bullish and Bearish Legs are very distinct and since its March 25 2024 All Time High (ATH), the market has been on the latest Bearish Leg (red Channel).
The 1W RSI just touched its 30.00 oversold barrier and last time it did so on a Bearish Leg (June 13 2022), the bottoming process (Higher Low) started towards the 0.236 Fibonacci level of the multi-year Channel Up.
As a result, FET may start its new Bullish Leg, as long as the overall market remains on a Bull Cycle. The short-term Target is the 1W MA50 (blue trend-line), with which contact can be made around $0.62000. Long-term (again if the Bull Cycle extends) we could see another +6430% Bullish Leg to $8.000.
-------------------------------------------------------------------------------
** Please LIKE 👍, FOLLOW ✅, SHARE 🙌 and COMMENT ✍ if you enjoy this idea! Also share your ideas and charts in the comments section below! This is best way to keep it relevant, support us, keep the content here free and allow the idea to reach as many people as possible. **
-------------------------------------------------------------------------------
💸💸💸💸💸💸
👇 👇 👇 👇 👇 👇

$FET bullish momentumHey traders!
It’s been a while since we last talked. This time I bring you my thoughts about FETCH.AI ( NYSE:FET ). Since all the tariff and deepseek staff its mcap valuation decreased significantly.
In my opinion, as it shown us some strenght "jumping" from 0,3$ and consolidating for almost 4 months on 0,6 - 0,9 (50% retracement from its local high) range I think it's a good opportunity to see an expansion movement.
In addition, chartism shows a clear ABC correction movement that has already finished. In my opinion ( ONLY MY OPINION NOT A FINANCIAL ADVICE) we could see a potential impulsive movement on Sept - October.
My targets -> 1,5 - 2,5 - ATH.
Stay safe!

FET ROADMAPTo me the view is pretty clear.
* The purpose of my graphic drawings is purely educational.
* What i write here is not an investment advice. Please do your own research before investing in any asset.
* Never take my personal opinions as investment advice, you may lose your money.

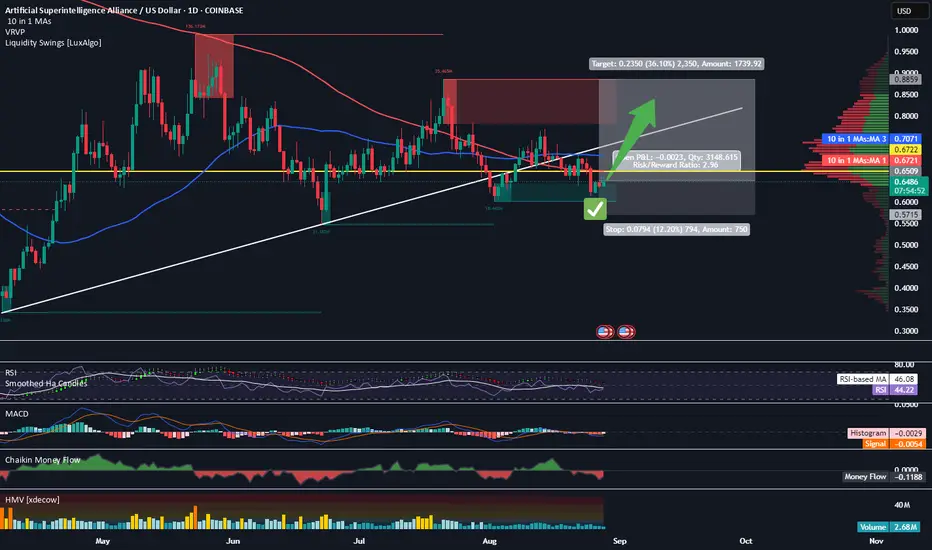
FET/USDT — Bullish Reversal or Bearish Continuation?FET/USDT is now trading at 0.575 USDT, right inside the critical support zone between 0.50–0.62 (yellow box). This level has been a major battleground since early 2024, repeatedly holding back sellers and triggering strong rebounds.
Looking closely, the chart has formed a Descending Triangle pattern:
Lower highs show persistent selling pressure.
Horizontal support at 0.50–0.62 acts as the last stronghold for buyers.
Price is already near the apex, signaling that a major breakout is likely approaching.
---
🟢 Bullish Scenario
Trigger: a decisive 4D close above the descending trendline and the 0.70–0.78 resistance zone, supported by strong volume.
Narrative: a breakout here would flip the structure into a classic bear trap, trapping shorts and fueling an aggressive rally.
Targets:
TP1 = 0.784 (+36% from current levels)
TP2 = 1.135 (+97%)
TP3 = 1.617 (+181%)
Strategy: safer entry after breakout + successful retest, with stop loss below 0.62.
---
🔴 Bearish Scenario
Trigger: a confirmed 4D close below 0.50 USDT with rising sell volume.
Narrative: once this key support breaks, buyers lose control, and a strong downside move may follow.
Targets:
Breakdown target from pattern = 0.216 USDT (−62% from current levels).
Next historical support lies near 0.16 USDT.
Strategy: avoid long entries during breakdown. Safer approach is waiting for support confirmation below, or consider short setups.
---
📌 Conclusion
FET is standing at a make-or-break zone. The 0.50–0.62 range will decide its next major move:
A breakout could trigger a multi-stage rally,
While a breakdown risks opening a capitulation phase toward much lower levels.
Key point: wait for 4D close confirmation + volume before committing. Patience will define profit.
---
#FETUSDT #FetchAI #CryptoAnalysis #ChartPattern #DescendingTriangle #Altcoin #CryptoTrading #SupportResistance #BreakoutSetup

FET: Eyes Further Gains as Uptrend Remains Intact FET managed to edge higher since last Thursday, further advancing orange wave b as we had primarily anticipated. We still expect its corrective high below the resistance at $1.16 before orange wave c likely triggers a decline toward support at $0.55. Above this level, we anticipate the low of blue wave (ii), which would signal a trend reversal to the upside. We currently assign a 35% probability to a somewhat deeper completion of the interim correction—in the form of wave alt.(ii) in blue—between the two support levels at $0.55 and $0.35.

FET: Still on My Radar, Still Looking BullishA few weeks ago, I pointed out that FET is one of the alts firmly on my radar and that I was looking to add more to my bag. The market has delivered exactly what I wanted to see:
• The coin reinforced support just above 0.55, proving that buyers are very active at this level.
• From there, FET has started to rise again, showing constructive price action
This is in line with my broader outlook from the Total Excluding Top 10 analysis , where I argued that acceleration to the upside could be the next big move for alts.
Trading Plan
For FET specifically, the picture is clear:
• As long as 0.55 holds, dips should be treated as buying opportunities.
• The next logical target in such a breakout scenario is 1 USD, which is both a round psychological level and a strong resistance from the past.
🚀 Strategy: Buy dips against 0.55. Targeting 1 USD in the coming wave.

Long Signal Given on Fetch AIFetch AI runs hot when it goes. Recently, I received a BUY alert from my indicator letting me know that we’re getting close to another run soon. I have entered here and will have a fairly conservative target of .88. My SL is .57, giving me a fairly modest 1:3 rrr. My plan is to sell half at the target and let the rest ride. Of course, that could always change with time, so keep an eye on my trade tracker.
FetchAI · $3.33 · Elliott & Market WavesFetchAI is in a standard situation. Notice how small is the first bullish move. This is always wave 1. Between 7-April and 23-May.
Wave 2 would be the consolidation pattern and here is why I continue to say that the next high will not be the end of the bull market.
Wave 3 is the next advance, the one that will develop after FETUSDT breaks out of the consolidation pattern. The peak can be $3.33 or can be higher.
After this peak, we have wave 4 which is another correction similar to wave 2. The difference is that wave 2 lasted a long while while wave 4 will be quick.
Finally, wave 5 will produce the bull run and potential all-time high. Not all pairs will hit a new all-time high but the highest prices will definitely be reached within the fifth wave.
It is still early for FETUSDT. There is plenty of room left available for growth.
Namaste.

FET/USDT — Symmetrical Triangle: Ready for Breakout or BreakdownSummary
The FET/USDT (1D) chart is forming a symmetrical triangle — a consolidation pattern where descending highs and ascending lows converge. Price is trading around 0.7020 inside a tight range, with volatility shrinking as it approaches the apex. Major resistance levels are 0.9089, 1.2319, 1.6173, 2.2200, while the key support lies at 0.3444.
---
Pattern Explanation
Pattern Name: Symmetrical Triangle.
Nature: Neutral; direction depends on breakout confirmation.
Context: Formed after a strong downtrend (Dec–Apr) followed by higher lows since April, suggesting possible accumulation.
Key Point: Breakout/breakdown probability increases as the price nears the apex. Always confirm with volume.
---
Measured Move Projection
Triangle height: 2.2200 – 0.3444 = 1.8756.
Breakout projection from ~0.7020 = 2.5776 (long-term measured move target).
Realistically, price will face major resistances first: 0.9089 → 1.2319 → 1.6173 → 2.2200.
---
Bullish Scenario
Confirmation:
Daily close above descending trendline and ideally 0.9089.
Volume expansion above average.
Retest of breakout zone turning into support.
Targets:
Conservative 1: 0.9089.
Conservative 2: 1.2319.
Aggressive: 1.6173 → 2.2200 → measured move ~2.58.
Trading idea:
Aggressive: enter on breakout with stop loss below breakout candle (~<0.65).
Conservative: wait for breakout + retest above 0.9089, enter on retest.
---
Bearish Scenario
Confirmation:
Daily close below ascending trendline.
Volume spike on sell-side.
Retest failure of broken support as resistance.
Targets:
Initial target: 0.3444.
Extended bearish levels: 0.30 → 0.20 if momentum accelerates.
Trading idea:
Short on retest after breakdown or enter on close confirmation.
Stop loss above retest level (e.g. >0.75 if breakdown occurs around 0.70).
---
Key Notes / Risk Management
Watch volume for confirmation, avoid fakeouts.
Confluence with indicators: RSI, MACD, MA 50/200.
Manage risk: use stop loss, avoid overexposure (1–3% per trade).
Keep an eye on fundamentals or project-related news that could trigger sudden volatility.
---
FET/USDT — forming a Symmetrical Triangle near the apex. A breakout above 0.9089 with strong volume could target 1.23 / 1.62 (ext. 2.22 → measured ~2.58). Breakdown below the rising support risks a drop toward 0.344. Always wait for confirmation and manage risk.
#FETUSDT #FET #CryptoAnalysis #TrianglePattern #Breakout #AltcoinAnalysis #SupportResistance #CryptoTrading #TechnicalAnalysis

#FET/USDT Preparing for a Major Rally ?#FET
The price is moving within a descending channel on the 1-hour frame and is expected to break and continue upward.
We have a trend to stabilize above the 100 moving average once again.
We have a downtrend on the RSI indicator that supports the upward break.
We have a support area at the lower boundary of the channel at 0.655, acting as strong support from which the price can rebound.
We have a major support area in green that pushed the price upward at 0.650.
Entry price: 0.665
First target: 0.688
Second target: 0.716
Third target: 0.750
To manage risk, don't forget stop loss and capital management.
When you reach the first target, save some profits and then change the stop order to an entry order.
For inquiries, please comment.
Thank you.

Mirroring alts - FET weekly update August 10 - 16thFetch.ai (FET) is advancing within a multi-degree Elliott Wave alignment that mirrors the structures seen across many other altcoins. At the Cycle degree, price is in Wave 1; at the Primary degree, a completed 1–2 structure suggests that Wave 3 is now underway; at the Intermediate degree, the same 1–2 formation implies another Wave 3; at the Minor degree, price is currently in Wave 1; and at the Minute degree, price is in the late stages of Wave 3, which is likely to end inside the highlighted Fair Value Gap (FVG).
Once this smaller Wave 3 completes, a short-lived Wave 4 pullback is expected, followed by Wave 5 to finish Minor Wave 1. A deeper retracement into the 0.5–0.764 Fibonacci zone would then be possible as part of Minor Wave 2 before the next sustained advance. The structure remains bullish as long as key support levels hold.
From a sentiment and liquidity standpoint, funding rates are positive, indicating a bias toward long positions. The liquidity heatmap shows only limited liquidity above current price, while there is more liquidity resting below — a configuration that could allow for a quick liquidity sweep before continuation.
This chart pattern is notably similar to many other altcoin structures right now, reflecting the high degree of correlation within the crypto market. If Bitcoin confirms its own bullish wave count, these aligned setups could trigger synchronized breakouts. Conversely, a BTC rejection could weigh on all correlated altcoins, including FET.
In the broader macroeconomic context, the CME FedWatch Tool indicates a 88,9% probability of a Federal Reserve rate cut at the September FOMC meeting. Markets often front-run such decisions, and this could act as a catalyst for impulsive Wave 3 rallies across crypto. However, heavily skewed bullish sentiment increases the risk of a “sell-the-news” event if traders over-leverage ahead of the announcement. Institutional accumulation likely occurred earlier in the cycle, leaving retail traders to drive the next legs higher.
As long as structural support remains intact and the anticipated Wave 4–5 sequence plays out, FET appears well-positioned for continuation — in alignment with the bullish setups currently visible across much of the altcoin market.

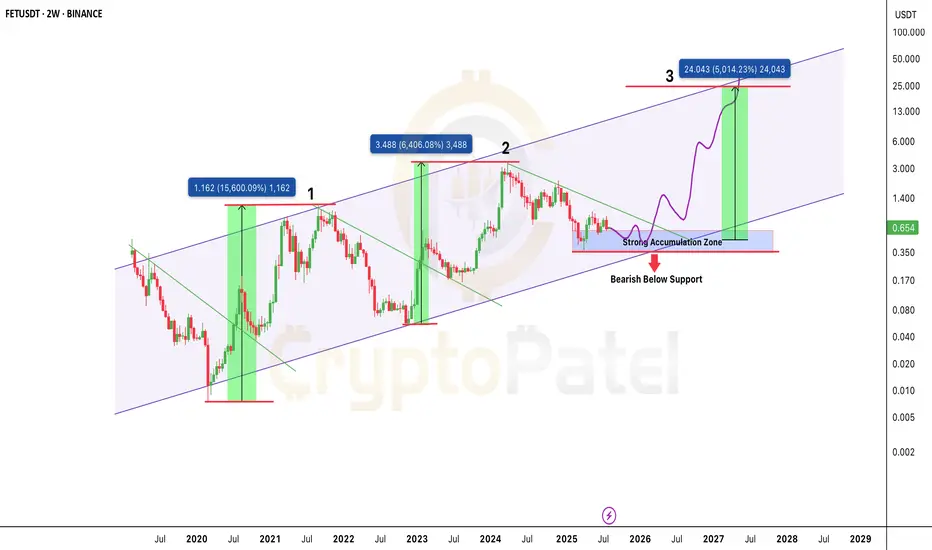
$FET is back in the zone that sparked 15,000%+ rallies?NYSE:FET is back in the zone that sparked 15,000%+ rallies. Same setup. 50x incoming?
FET continues to respect its multi-year ascending channel structure, active since 2020.
Price Action History:
🔹 Wave 1 (2020–2021): +15,600% rally from channel support to resistance
🔹 Wave 2 (2022–2024): +6,400% move following a similar breakout pattern.
🔹 Current Cycle (2025): Price is consolidating in the same accumulation range of $0.35–$0.65.
Key Demand Zone: $0.35–$0.65
Upside Target: ~$24.00 (5,000%+ potential)
🔻 Breakdown Level: Below $0.35 = Structure invalidation
Structure Insight:
Each macro move begins with:
🔹 Accumulation at channel support
🔹 Break of falling trendline
🔹 Aggressive expansion toward the upper boundary
The projected Wave 3 follows this same path if demand zone holds. The structure remains bullish as long as price stays above $0.35.
FET is trading at a high probability accumulation level within a valid macro trend. If history repeats, this could be the next major leg up.
✅ Favor long accumulation strategies
❌ Exit plan needed below $0.35
NFa & DYOR
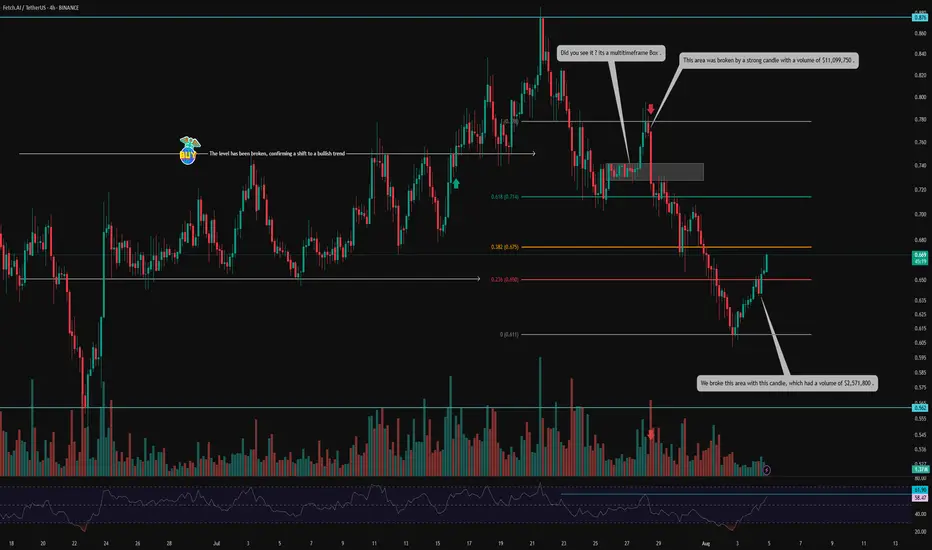
FET on Fire: Volume-Backed V-Pattern Breakout in 4H Structure💀 Hey , how's it going ? Come over here — Satoshi got something for you !
⏰ We’re analyzing FET on the 4-hour timeframe .
👀 After breaking out of its range around $0.75, FET experienced a solid upward move , reaching $0.876 . However , it was rejected from that level and faced heavy selling pressure , eventually forming a consolidation box on the multi-timeframe .
The break of this box, accompanied by rising volume and a total market structure break , led to a move toward the $0.778 resistance , where the price dropped again — this time with significant sell volume .
🎮 The Fibonacci levels in this chart are drawn based on volume-based market activity — specifically from the candle where the sell-off began to the candle where selling pressure ended and a reversal candle formed .
It may sound a bit technical , but the 0.236 Fib level acted as a key V-pattern resistance , which was beautifully broken with a strong $2,571,800 volume, and the candle closed above it .
Following that , traders showed reactions to this level , and the liquidity absorption can be seen in the form of wicks .
🔑 The next important zone is the 0.382 Fibonacci level at $0.675, where we see two possible scenarios :
Reaction and pullback , followed by a breakout .
Breakout first , then a pullback .
You can also place a buy stop at this level — just make sure to use a wider stop-loss .
⚙️ The structure is looking relatively good . The 61.9 RSI region could cause some noise in lower timeframes , but the key area is RSI 70 , which is the entrance to the Overbought zone .
🔼 Volume has been decent , especially considering today is Saturday and a weekend session . This adds more confirmation to the breakout of the V-pattern and the potential end of the correction .
🖥 Summary :
FET is one of those coins with strong recovery potential , operating in the AI sector . It tends to respect classic price action patterns , and with well-drawn Fibonacci levels , volume confirmation , and RSI moving into Overbought , it often activates buy-stop positions cleanly .
💡 Disclaimer :!!! .
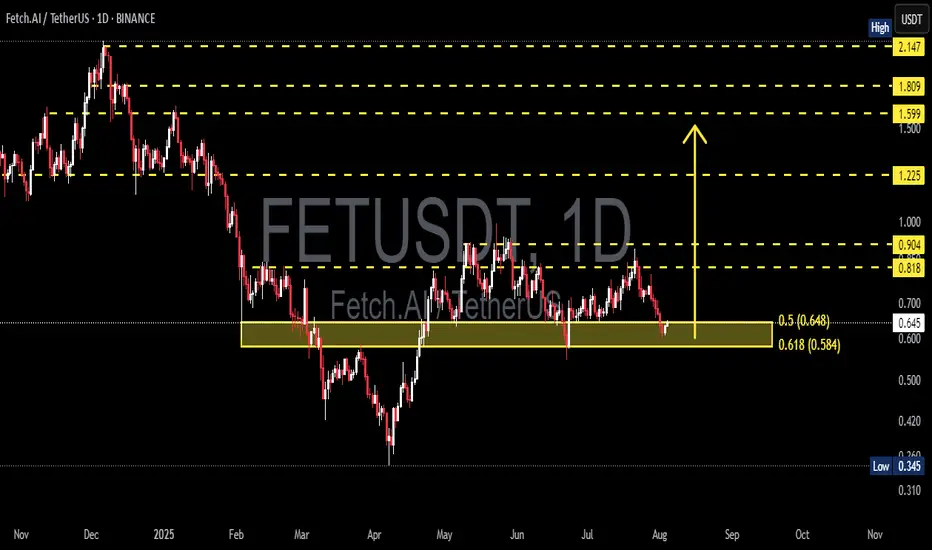
FET/USDT Testing Fibonacci – Bounce Incoming or Breakdown Ahead?📊 Technical Analysis Overview:
FET/USDT is currently testing a strong demand zone aligned with the Fibonacci Retracement 0.5 – 0.618 levels, specifically between $0.648 and $0.584. This “golden pocket” area is historically significant and often acts as a pivot zone for price reversals.
🔍 Chart Pattern:
The price formed a series of higher highs and higher lows from March to June, indicating a bullish structure.
Since July, momentum has weakened, and the price has corrected back into the key support zone that previously acted as a base for a rally.
---
📈 Bullish Scenario:
If price holds above $0.584 and forms a reversal candlestick (e.g., bullish engulfing or hammer), a strong rebound is likely.
Key upside targets:
$0.818 (minor resistance)
$0.904 (psychological level)
Potential breakout toward $1.225 if bullish volume returns.
📉 Bearish Scenario:
A decisive breakdown below $0.584 with high volume could trigger further downside toward:
$0.42 – $0.345 (next major support zone)
This move could confirm a bearish continuation pattern such as a descending triangle if resistance continues to hold.
---
🎯 Strategic Outlook:
The current zone is a make-or-break level, and the market is at a decision point. Traders should wait for a clear confirmation through price action and volume before committing to directional trades.
#FETUSDT #CryptoAnalysis #FibonacciSupport #AltcoinSetup #FetchAI #TechnicalOutlook #BullishOrBearish #SupportZone #GoldenPocket
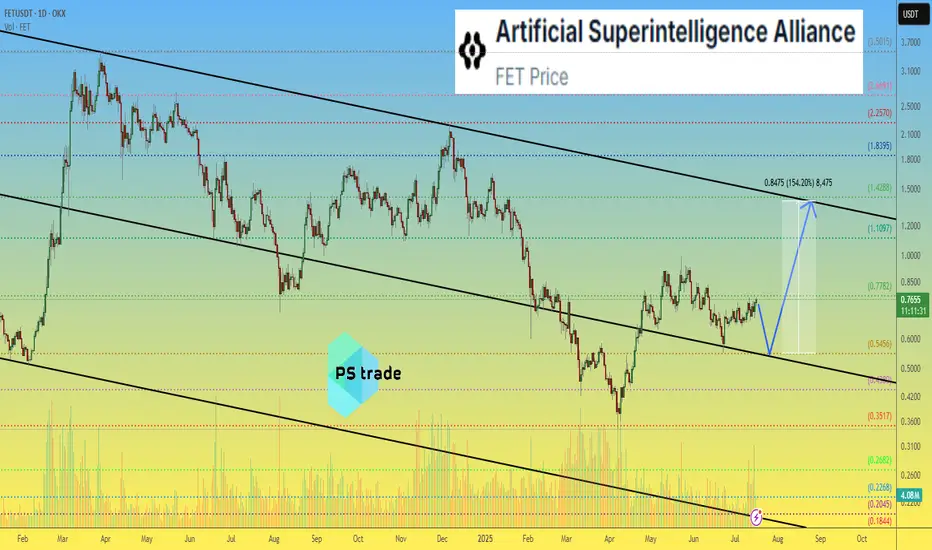
Artificial Superintelligence Alliance - FET price analysis📈 It looks like the price of the combined and updated #FET is trying to consolidate at the top of the channel.
All that remains is to wait for confirmation, i.e., for the OKX:FETUSDT price to stay above $0.55 in the coming days/weeks.
🤖 And then the #ArtificialSuperintelligenceAlliance token (the name is more complicated than the stop word from the movie “Eurotrip” — "hello olds" :) can be purchased for an investment portfolio with a growth potential of at least +150%.
_____________________
Did you like our analysis? Leave a comment, like, and follow to get more
#FET/USDT#FET
The price is moving within a descending channel on the 1-hour frame, adhering well to it, and is heading towards a strong breakout and retest.
We are seeing a rebound from the lower boundary of the descending channel. This support is at 0.634.
We have a downtrend on the RSI indicator that is about to be broken and retested, which supports the upward trend.
We are looking for stability above the 100 moving average.
Entry price: 0.661
First target: 0.684
Second target: 0.720
Third target: 0.754
