BICO STAGES TAKING PROFIT 1 AND 2BICO long from here. Bico is going or 10x. Get rich !! NFA NFA one of the best altcoin set up!!BLongby chartbusters891
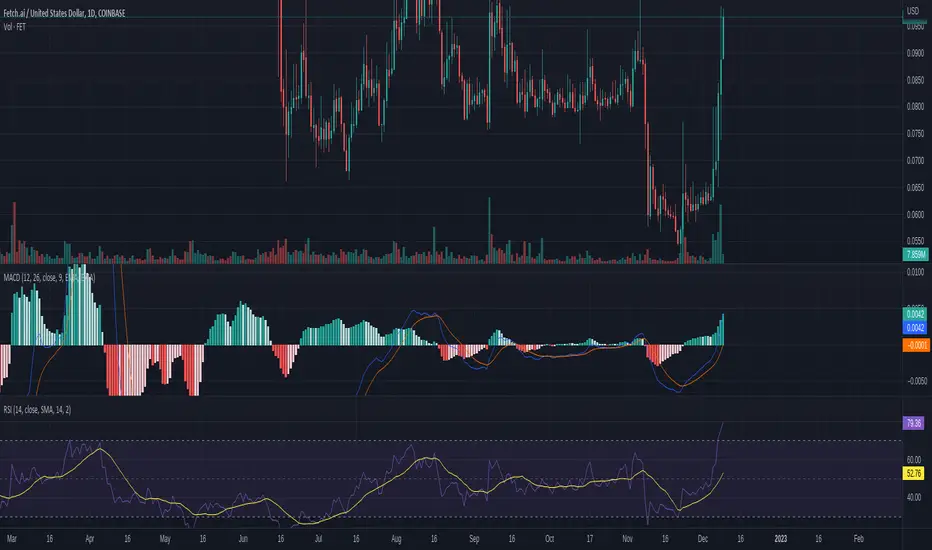
FET|USD Soars 326% in 30 Days: A Rapid Rise ReflectionsFetch.ai is a decentralized platform that provides AI-powered solutions for various industries, including finance, transportation, and energy. It uses blockchain technology to allow for secure and efficient exchanges of data and value, enabling the creation of autonomous economic agents. Fetch.ai offers a range of products, including a decentralized marketplace for data exchange, a digital twin platform for modeling real-world systems, and a suite of AI tools for businesses and developers. The platform enables efficient, secure, and decentralized transactions between individuals and organizations, allowing for a more efficient and fair exchange of value. Fetch.ai's vision is to create a decentralized, self-organizing, and autonomous digital economy, where data, value, and tasks are managed and executed by autonomous agents, allowing for more efficient and effective transactions. By leveraging the power of AI and blockchain technology, Fetch.ai aims to revolutionize traditional industries and create new opportunities for businesses and individuals. A 1-day chart analysis of Fetch.ai (FET) can provide valuable insights for short-term holders of the cryptocurrency. By examining the price trends, volatility, and volume of Fetch.ai over the past day, it is possible to make predictions about the short-term performance of the asset. For instance, a sudden surge in the price of Fetch.ai, accompanied by high trading volume, can indicate a sudden increase in demand for the asset, which can be a good opportunity for short-term traders to take advantage of the price increase and sell at a profit. On the other hand, if the chart shows a lot of volatility and price swings, it could signal a lack of market stability, which may be a concern for short-term holders. Additionally, a 1-day chart analysis can also provide insights into the impact of any major events or news on the price of Fetch.ai. For example, if there was a significant spike in price following the announcement of a new partnership or product launch, this may indicate that the market is optimistic about the potential of the project and that short-term holders may benefit from this positive sentiment. Overall, a 1-day chart analysis can provide valuable information for short-term Fetch.ai holders to make informed decisions about their investments. By monitoring trends and staying informed about market conditions, they can make more informed decisions about buying and selling Fetch.ai. by SuzanneSpisak116
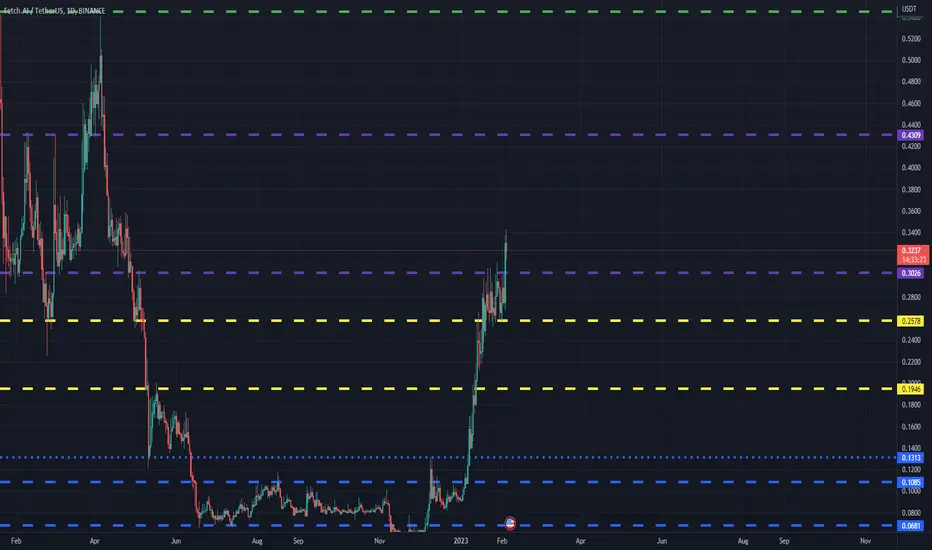
FETUSDT(Fetch.ai) Daily tf Range Updated till 4-02-23FETUSDT(Fetch.ai) Daily timeframe range. from local low it already retraced 530%+. thats actually some insane gains.retraced right back to its old range. it do have a decent retail interest. dont fotget AI is a new trend. by cryptoforever17
FET Fetch.ai Coin Price PredictionAs you can see on FET Fetch.ai Coin 4h Price chart price broke the key resistance level at around $0.30 and if price comes down to this level again there would be a nice buying opportunity.by SuperTradeish1
FETCH.ai CRYPTO:FETUSD FETUSD I think after FET was listed on BINANCE Perpetual Futures , FETCH.ai start printing Wickoff Distribution Schema , maybe CZ want to buy more & dump more .. Couse i think all AI coins&stock will be next bubble in our life :) I am preparing for cumulate some of this , but who know ? I really dont know nothing ,this is not advice do your own research :D ... couse my ideas are 60% wrong ... I am only conspirate...Shortby Chlvx187808Updated 553
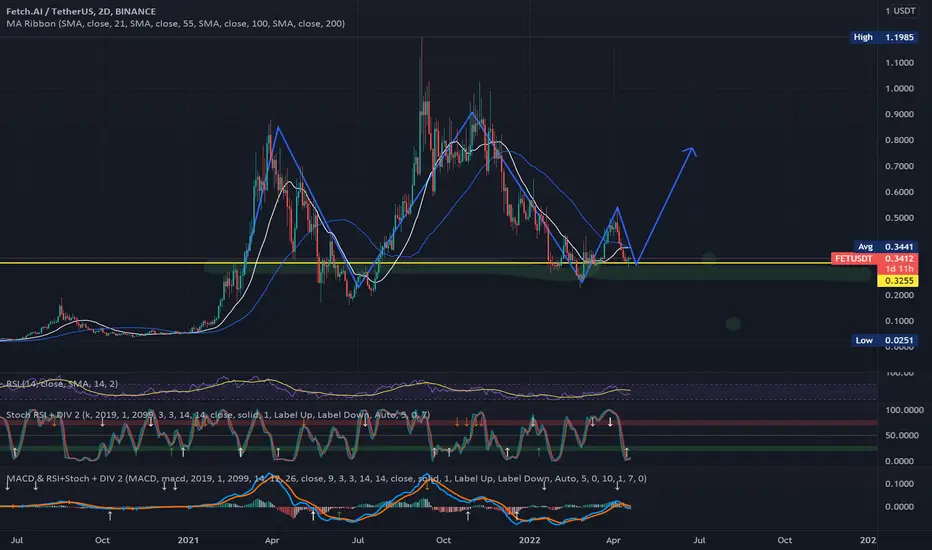
Nice targets! (bullish mid term)Here are main levels, studying main resistances for mid-term and checking also de Fib retracement. My personal target: 0.5 mid term. Let's see!Longby DanyBoy4k2
FET/USDT. BitVero Crypto Academy. Disclamer: We are not financial advisors. The content that we share on this website are for educational purposes and are our own personal opinions.Longby Veromento1
FET Towards $0.3400Looking at the daily chart of FET/USDT, the FET price was swinging from $0.08231 to $0.1683 within the past 30 days after going to its lowest of the month at $0.08231. Bouncing back from the support level, FET seem to aim towards to the previous order block at $0.31. If FET is able to break out of the order block and rises higher, we can expect FET to reach $0.3400. Meanwhile, our long-term FET price prediction for 2023 is bullish if it cannot break the support level. We can expect FET to reach $0.5 this year. Longby CoinEdition225
$FET - Power of 3Power of 3: - accumulation - manipulation - expansion Beautiful. Longby cryptovatsik552
✴️ Fetch.AI | BULLS ConfirmedI initially shared this pair 8-December... All targets have been hit and beyond (See below)... It went beyond all the mapped targets but there can be more. We see three waves. The fourth should be a corrective wave and then the fifth another high. Remember the saying... What one does, the rest follows. Expect the entire cryptocurrency/altcoins market to follow. FetchAI (FETUSDT) bullishness confirms the bullish wave we've been predicting for the past month. It is now only a matter of time before EVERYTHING speeds up UP!. 👆 Thanks for the trust and support. Namaste. Longby MasterAnanda3316
Watched FetchAI this week - 3 things all fetusdt HODLer loveWatched FetchAI this week There are 3 things all fetusdt HODLer will love to see 1. a bullish divergence in the weekly RSI 2. price might close above volume profile $0,081 in a few hours 3. we see increase in volume after long decrease Let me know your thoughts in the comments🤗 ⬇️⬇️⬇️ Likes and Follow for updates appreciated🤗 Disclaimer: Not financial advice Do your own research before investing The content shared is for educational purposes only and is my personal opinionLongby Crypto4EverybodyUpdated 226
fetch.ai is looking good :)fetch.ai is strong daily and lets hope it can last a few more days :) by dr0izUpdated 111
$FET to $.22-$.24?Fet looks like it's about to make a big run. It's been in accumulation for 6 month and looks like it's about to break out. Once it can break the bottom resistance at $.09, I think there could be a quick move to $.13 and if that breaks, there's a lot of room for price to move upwards. I ultimately think the move will take us somewhere to the $.22-.24 range before topping. Let's see. Long from under $.09.Longby benjihyamUpdated 4
FETch.AI-USDTGreetings, Coin goes like many altcoins on the same program, a break of consolidation and further development of the upward movement. A very similar pattern could be seen on these coins: ETH ETC QTUM DCR Depending on the capitalization and the coin pamping at different percentages, some of the process is still underway and you can search for similar trade sets on your own. This coin has a low capitalization and is in the 300th place in the CMC, with a listing on all the top exchanges. Therefore, the targets can be expected to be more optimistic than those of the top 30 coins. At the moment an attempt to break the local resistance around 1100, with increased vertical volume. Volume growth over the last 24 hours x1.6 CMC data. Potential entry points on a pullback or a breakdown of this zone, as well highlighted zones for stops, depending on your risk profile. 12H Also, if someone is interested in pair to BTC Attached more ideas below, or see in my profile. If you liked this stuff then like this and subscribe so you won't miss anything. Always use STOP, and do not use a leverage higher than x3. A trader must always have tomorrow.by Kirill_Gaitan6
📈Fetch.ai (FET) Jul-22 #FET $FETAfter receiving a strong selling force on July 20, FET did not decrease further, but increased again, which shows that the possibility of rising of FET is still very high and it is heading to the bottom of Ichimoku cloud at the $0.1 zone by the end of July and may continue to rise sharply to the $0.12 zone in mid-August. However, if FET loses the $0.08 zone, we need to be careful because it can drop strongly to the $0.065 zone to retest this bottom and may continue to fall back to the $0.05 zone so we need to consider carefully when buying it at 0.065$Longby CryptoStation3
FET: +50% tradeHello everybody, FET broke the main resistance, as you can see from the chart the width of this range is high, so low risk and a lot of rewards, if all goes according to plan it will definitely be a great trade in the short term. target: $ 0.139 stop: close below $ 0.89Longby MC_Capital_Updated 4
Didn't hit rock bottom yetImagine if we get/are in a recession, this coin might go all the way down again to it's lows. Might be a good one then to buy the dip, but i feel like more pain is still to comeby Nielsagaert1
Locked and Loaded FET/BTC #FET $FET #FETBTCThere appears to be an Inverted Head and Shoulders on our FET BTC chart ! That's good . That's a bullish structure . You can see the structure has been building since we bottomed out near 640 sats not that long ago . It shouldn't be long now until we complete the right shoulder which we are already halfway through . And then this should go up ! First target area would probably be near the top of the Ichimoku cloud around 12xx sats or so. Where the green arrow is . After that we have to consolidate on top of the cloud and will need to break through our previous resistance of 1550 but then we should definitely see more upside ! FET looks great for this year ! A gem . PS - you can see we've clearly closed above that previous Falling Wedge we were in so that's also Bullish .Longby shimmeringpathUpdated 557
FET/USDT#FET/USDT ANALYSIS ###################################################################################################################################################+ It is holding above horizontal and trendline support. MACD crossover is loosing bearish momentum. As it is currently creating a higher low, so a good volume will confirm a bullish move from here and a sustain breakdown of the support would confirm bearish move. FET has real great project. you can buy it under 0.35 BUY ORDER < 0.344 SELL ORDER >= 0.37-0.70 Targets: T1: 0.37 T2: 0.42 T3:0.47 T4: the moon If u agree & like my trading still give me some like and follow me boss! love all of u !!! HAPPPY TRADING!!!Longby similarKing71131226
FET on Binance - Breakout+Retest & preparing to move toward 1$Fetch Ai (FET) On Binance Daily Chart Successeful Breakout + Retest Done.. Patience is Key. Aggressive entry now at 0.327 Stoploss after a Daily Close Below 0.25 Safe entry after a Daily Close above 0.43 TP1 0.60 TP2 0.75 TP3 0.99 TP4 2.00 DYOR.Longby ScalperDotComUpdated 4
Fetch.AI FETUSDT - Breaking out! + Channel + Head and Shoulders- FET looks very strong on the daily time frame! - We have a breakout (Head and shoulders + Descending channel). - Profit target slightly below all time high levelLongby UnknownUnicorn25375182212
FET - Wait For The Trigger!Hello TradingView Family / Fellow Traders. This is Richard, as known as theSignalyst. FET is overall bullish trading inside the brown rising broadening wedge pattern. FET is now approaching the lower brown trendline and green support so we will be looking for buy setups. on DAILY: The sellers seem to be exhausted, as the last swing couldn’t push lower, instead resulting in a higher lower. This gives us an early alert that a potential shift in momentum might occur soon! Moreover, FET formed a valid wedge pattern in red and inverse head and shoulders pattern. But it doesn’t mean that the bulls took over yet. Trigger => For the bulls to take control, before we buy, we need a candle close above the gray neckline. Meanwhile, until the buy is activated, FET can still trade lower inside the green support before trading higher. Good luck! All Strategies Are Good; If Managed Properly! ~RichLongby TheSignalyst272726
FetchAI Getting Stronger, Massive Growth Ahead!FetchAI Getting Stronger, Massive Growth Ahead! FETBTC is now looking really nice and today we have a break above EMA50. I am not going deep into analysis since I did this in the past few months... The intention now is to remind you that the Altcoins will ALL grow strong. The targets are marked yellow on the chart. Namaste.by MasterAnanda1113