Cleanest chart iv ever seen Ready to moonFinally its safe to say the March 13 drop was bitcoin and fetch.ai bottom. After a year of accumulation and downtrend we are ready.
Chart shows we are already on uptrend.
Lines on the chart shows resistance and once it breaks it will turn into support.
Colored boxes are heavy resistance which might be an area of accumulation.
Heavy accumulation is = Great reward.
Fetch.ai listed on coinbase custody which probably be listed on coinbase pro
Based on BAND and Kyber network after listed on the custody they mooned in which they greatly accumulated as well.
Fetchbitcoin

Fetch demand zone Hello, traders.
For Fetch, we had an excellent entry point into the demand zone for this asset, but this train has already passed.
But if anyone is bought in this asset should think about booking some profits considering that we are in an overbought zone in a lot of indicators. A correction would be healthy for the asset
Push the like button and follow us on TradingView.

FET/BTC over 200MA First time this coin has closed above its 200MA on the daily time frame.
This is not investment advice please do your own research.


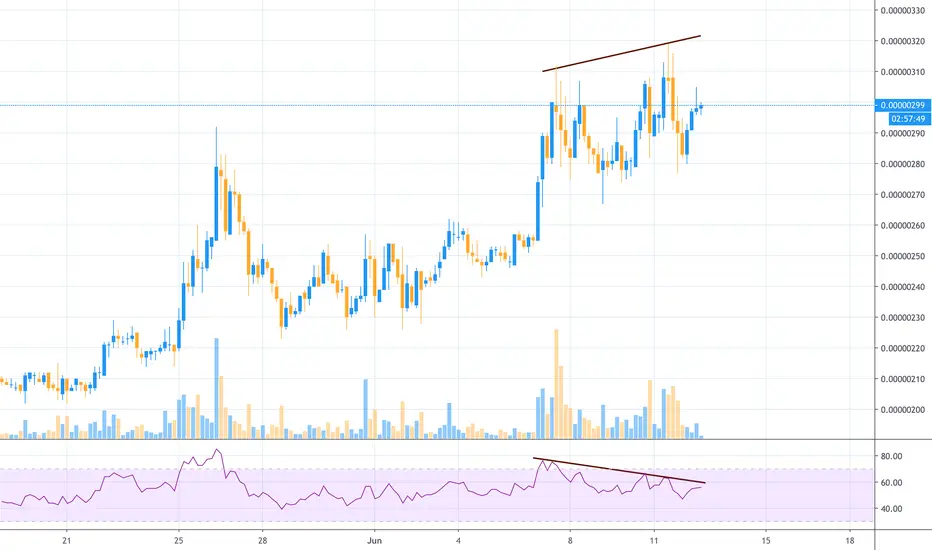
FET/BTC running out of steam?FET/BTC has a strong bearish divergence on the RSI could signal a reversal of the trend.
If you like my ideas and the work I do, please check out the links in the signature ;).
SimilaritiesThis pattern has been appearing across a wide range of alt coins including Fetch and District0x, district0x in which i am long on. Is this a bullish pattern? Alt coins may be on the VERGE of large growth. The pattern shows a clear top with an indistinguishable shoulder formation. Any comments on the formation would be helpful..
Cheers
Bixley


FETCHBTC Is this a bullish pattern? - EducationPosting this to see the outcome. Have been consistently seeing this pattern across a wide range of low cap cryptocurrencies.

FETBTC forming bullish Shark | Upto 168% move aheadPriceline of World's 117th ranked cryptocurrency out of more than 2300 cryptocurrencies Fetch.ai (FET) with Bitcoin pair is forming bullish Shark pattern and soon it will be entered in potential reversal zone and will be ready for bullish reversal soon.
This potential reversal zone should be used as stop loss in case of complete candle stick closes below this zone.
Let’s have a look on the dimensions of FET price action's moves:
After inertial leg (X to A) the A to B leg is retraced between 0.382 to 0.618 Fibonacci and then B to C leg is projected between 1.13 to 1.618 of A to B leg's Fibonacci projection and final (C to D) leg is suppose to be retraced between 0.886 to 1.13 Fibonacci for a perfect bullish Shark and then the price action will be entered in potential reversal zone of this bullish Shark pattern, then we can expect bullish divergence at any time which will lead the priceline between 0.382 to 0.786 Fibonacci projection of C to D leg, but after this bullish divergence if the candles sticks will be closed above 0.786 Fibonacci levels then it can also lead to the long term bullish move.
As per Fibonacci sequence method we can set our targets as below for mid term trade:
Buy between: 0.00000431 to 0.00000305 sats
Sell between: 0.00000555 to 0.00000820 sats
So this trade has potential to produce upto 168% massive bullish move.
Regards,
Atif Akbar (moon333)
The harmonic moves analysis involves hours of hard work and determination however the success of harmonic trading in fiat and cryptocurrencies is around 80% therefore it is always important that you follow any stop loss strategy while trading harmonic patterns I have also shared a stop loss idea in this article, the information in this article is for educational purpose only this is not intended to be investment advice, I have tried my best to catch the harmonic moves as per predefined classical harmonic bullish Shark pattern if you find any flaw or you have any suggestion feel free to share with me in comments section.

We need to break 534 to move on! Might take some attemptsFETCH are following my analysis 1:1
Next step is to break 534!
If we go above 534, we can move to 700!

WE BROKE 474 AS I SAID NOW WE NEED TO HOLD IT AS SUPPORTAs i said in previous analysis, we had to break 474. Now we have to hold before we go for 500 sats.

WE BROKE TRIANGLE. WE ARE GOING TO RETEST 474 AGAINAS PREDICTED WE BROKE THE TRIANGLE. WE HAVE TO BREAK 474


FET LONG $FET potential scalp:
Looking pretty good in terms of volume and divergences; potential 38% play here.

FETBTC formed bullish BAT | A good buying opportunityPriceline of Fetch / Bictoin cryptocurrency has formed a bullish BAT pattern and entered in potential reversal zone.
This PRZ area should be used as stop loss.
We have a 100 simple moving average support above the PRZ area therefore the priceline may only give spike in this buying zone.
I have used Fibonacci sequence to set the targets:
Buy between: 0.00000513 to 0.00000492
Sell between: 0.00000524 to 0.00000549
Regards,
Atif Akbar (moon333)


FETBTC POSSIBLE ROADMAN ADDED AND ALSO EXPLANATION READ.TIME TO UPDATE WHATS HAPPENING WITH CURRENT POSITIONS.
I HAVE ADDED ACCUMULATION AND POSSIBLE ROADMAP AS TO WHAT I SEE HAPPENING.
BITCOIN IS BEING PUMPED AND DUMPED CONTINUOUSLY MEANING THAT COINS WILL GO BACK TO PREVIOUS LEVELS AND SOME OF THEM WILL BE DUMPED AS PEOPLE DONT KNOW WHAT TO DO.
FET IS ACCUMULATING AND IS VERY CLEAR AND EVIDENT IN THE CHART.
NOTHING TO WORRY ABOUT THIS IS SOMETHING THAT I HAVE SEEN MANY TIMES ON THE CHARTS AND IS NOTHING NEW.
WHALES WILL GET RID OF YOU SHAKY HANDS AND THEY WILL BUY YOUR COINS AND THEN THEY WILL PUMP IT AND YOU WILL WANT IN AGAIN AND THEN YOU WILL LOSE YOUR MONEY
SET UP A BUY LIMIT IN AREA RECOMMENDED!

FetchAI/Bitcoin (Aug 23) #FET $FET #BTC $BTCFET looks so bad now. I think we shouldn't hold it at this time. We will take risk to buy it at 2 points : 600sts zone and 560sts zone

FetchAI/Bitcoin (July 30) #FET $FET #BTC $BTCFET is going to the 1.618 Fib Level so consider selling if you are in profit!
Wait to buy : Close to 850 as possible
Sell : 1000-1150
Mid Hold : 1370-1550
Long Hold : 2380-3240-3570
Stop : Under 840

Binance IEO Coins Pumping FET Buy Zone: 1200 - 1250 Satoshi
Sell Zone: 1350 - 1477 - 1550 - 1800 - 2000
Stop Below 1100 Satoshi
Binance IEO Coins Pumping.

FetchAI/Bitcoin (June 28) #FET $FET #BTC $BTCAccumulate : 1300-1325
Sellzone : 1490-1800-2380
Stoploss : Under 1200
