A buying opportunity has formed on FET (4H)A clear bullish Change of Character (CHoCH) has formed on the chart, created with strong momentum from buyers. This shift in market structure indicates that bullish participants are gaining control and that the probability of continuation to the upside has increased.
At the moment, price is trading around a key level, an area that has previously acted as an important decision zone for the market. Holding and accepting value above this level strengthens the bullish scenario and increases the likelihood of further upward movement.
Above the current price, there is a large liquidity pool formed around recent highs. This liquidity has not yet been taken and may be swept in the near future, which often acts as a catalyst for an impulsive bullish move.
We have identified two entry zones on the chart. Rather than entering aggressively, it is recommended to enter positions using a DCA (Dollar-Cost Averaging) approach within these areas to manage risk and reduce exposure to volatility.
Targets are clearly marked on the chart.
Once price reaches Target 1, consider taking partial profits. After securing some gains, the stop loss should be moved to break-even, allowing the remaining position to run with reduced risk while targeting higher levels.
As always, proper risk management is essential, and patience in execution will be key for this setup.
If you would like us to analyze a coin or altcoin for you, first like this post, then comment the name of your altcoin below.
Fetusd

#FET/USDT bullish momentum#FET
The price is moving in a descending channel on the 1-hour timeframe. It has reached the lower boundary and is heading towards breaking above it, with a retest of the upper boundary expected.
We have a downtrend on the RSI indicator, which has reached near the lower boundary, and an upward rebound is expected.
There is a key support zone in green at 0.2280. The price has bounced from this level multiple times and is expected to bounce again.
We have a trend towards consolidation above the 100-period moving average, as we are moving close to it, which supports the upward movement.
Entry price: 0.2440
First target: 0.2522
Second target: 0.2630
Third target: 0.2765
Don't forget a simple principle: money management.
Place your stop-loss order below the support zone in green.
For any questions, please leave a comment.
Thank you.

FET/USDT – Long Trade Setup (Daily)FET/USDT – Long Trade Setup (Daily)
Price forming a base after a strong downtrend
Falling wedge/compression near support
Price below cloud, but selling pressure weakening
Long Plan
Entry Zone: 0.19 – 0.205
Stop Loss: 0.1840
Targets:
T1: 0.26
T2: 0.32
T3: 0.37+
DYOR | NFA

FET/USDT — Decision Point: The 0.21–0.14 Zone That Defined!The FET/USDT weekly chart is revisiting one of the most historically significant zones in its entire price history — the 0.21–0.14 demand block.
This zone is not just a support area. It has consistently acted as the boundary between Accumulation and Capitulation since 2019. Every major FET rally began only after this zone was defended.
And now, price has returned to this zone once again — making this a major decision point for the next macro trend.
---
Why This Zone Matters
The 0.21–0.14 range served as the structural base for the powerful rallies in 2020, 2021, and the AI-driven surge in 2024.
The sharp downside wick below the zone followed by a fast recovery suggests a liquidity grab, hinting that larger players may still be accumulating here.
Price action is forming a compression pattern, a structure that typically precedes explosive breakouts — either up or down.
This is a point where the market rarely stays quiet for long.
---
Technical Structure & Pattern
FET has formed Lower Highs since the 2024 peak → medium-term downtrend still intact.
But price reactions within 0.21–0.14 remain strong, indicating an early-stage reaccumulation pattern.
The wick sweep below the zone resembles a potential Wyckoff Spring, not yet confirmed but clearly visible.
In simple terms:
If this zone holds, a long-term reversal can begin. If it fails, the chart opens the door to a new bearish leg.
---
Bullish Scenario
🔵 1. Demand Holds: “Buyers Take Control”
If the weekly candle closes above 0.21–0.18, it signals that buyers are still defending this historical demand block.
A stronger confirmation appears once price reclaims 0.30, the nearest structural resistance.
➡️ Bullish Targets:
0.30 → short-term confirmation
0.50 – 0.60 → mid-range resistance
0.90 – 1.50 → major recovery zone
2.50 – 3.40 → full cycle retracement if the AI narrative reignites
This would frame the 0.21–0.14 zone as a macro reaccumulation base before the next expansion phase.
---
Bearish Scenario
🔴 1. Clean Breakdown: “Demand Fails”
A weekly close below 0.14 would invalidate the entire multi-year structure.
If that happens:
the demand block collapses,
bearish continuation becomes highly likely,
and the chart enters a deeper macro range.
➡️ Bearish Targets:
0.10 – 0.07 → historical liquidity zone from 2019–2020
Further downside becomes possible if momentum accelerates
A breakdown below 0.14 would turn FET into a completely new market structure.
---
Key Insight
FET is currently sitting on a zone that has defined every major trend shift for the past 5 years.
The next weekly closes will determine whether we are entering:
a Phase B Accumulation → new macro rally, or
a structural breakdown → multi-month bearish continuation.
This is the calm before a major move — and the 0.21–0.14 zone remains the battlefield.
---
#FETUSDT #FetchAI #CryptoAnalysis
#KeyLevel #DecisionPoint #WeeklyChart #CryptoTA
#SupportZone #Wyckoff #SmartMoneyConcepts #AINarrative

FETUSDTThe overall trend of BINANCE:FETUSDT remains bearish as long as the price stays below the major moving averages. However, a potential bullish correction could start if buyers defend the key demand zone around $0.2100. A break above $0.3400 would strengthen bullish momentum and shift focus toward higher resistance targets.
Supports
$0.2100
$0.1120
Resistances
$0.3400
$0.5500
$0.7800

#FET/USDT bullish momentum#FET
The price is moving within a descending channel on the 1-hour frame, adhering well to it, and is heading for a strong breakout and retest.
We have a bearish trend on the RSI indicator that is about to be broken and retested, which supports the upward breakout.
There is a major support area in green at 0.2500, which represents a strong support point.
We are heading for consolidation above the 100 moving average.
Entry price: 0.2667
First target: 0.2707
Second target: 0.2795
Third target: 0.2884
Don't forget a simple matter: capital management.
When you reach the first target, save some money and then change your stop-loss order to an entry order.
For inquiries, please leave a comment.
Thank you.

Fet next period.If weekly closes occur above the parallel channel, the situation becomes positive. Until then, the situation is negative.
The news that will come as a result of the end of their partnership with Ocean Protocol is very important.
* The purpose of my graphic drawings is purely educational.
* What i write here is not an investment advice. Please do your own research before investing in any asset.
* Never take my personal opinions as investment advice, you may lose your money.

FET/USDT — Testing the Critical Support Zone: Will Reversal?The FET/USDT (4D timeframe) chart shows the price currently sitting at the major support area between $0.25 and $0.20, highlighted by the yellow block. This zone has historically acted as a strong demand area, which previously triggered a massive rally toward the $1+ region in late 2023.
The recent sharp drop indicates heavy selling pressure, but the presence of a long lower wick (rejection) around this area suggests that buyers are still defending this key level — signaling a potential buying reaction zone or early accumulation phase.
---
Pattern Description
The price structure is currently in a descending pattern, but it’s now reaching a potential bottom area. The current setup could evolve into a double bottom or accumulation base formation if the price can hold above $0.20 for the next few candles. This region is crucial for defining whether FET is forming a cycle low before a major rebound.
---
Bullish Scenario
Price holds above $0.25–$0.20 and confirms with a bullish reversal candle (hammer or engulfing).
Break and hold above $0.30 will be the first bullish confirmation.
Mid-term targets: $0.385 – $0.57 – $0.78.
If momentum strengthens, the next potential target is $1.09.
---
Bearish Scenario
If price breaks below $0.20 and fails to recover, the next key support lies around $0.113 (historical low).
A confirmed breakdown below $0.20 signals loss of major structure, opening room for a deeper distribution phase.
In an extreme bearish case, FET may form a new cycle low before any sustainable recovery.
---
Conclusion
The $0.25–$0.20 zone is the key decision point for FET/USDT in the medium term.
Holding this support would strengthen the case for a bottom formation and reversal setup,
but losing it would likely confirm a continuation of the downtrend toward lower levels.
---
#FETUSDT #FetchAI #CryptoAnalysis #TechnicalAnalysis #AltcoinUpdate #SupportZone #CryptoReversal #BullishScenario #BearishScenario #MarketStructure #AIcrypto

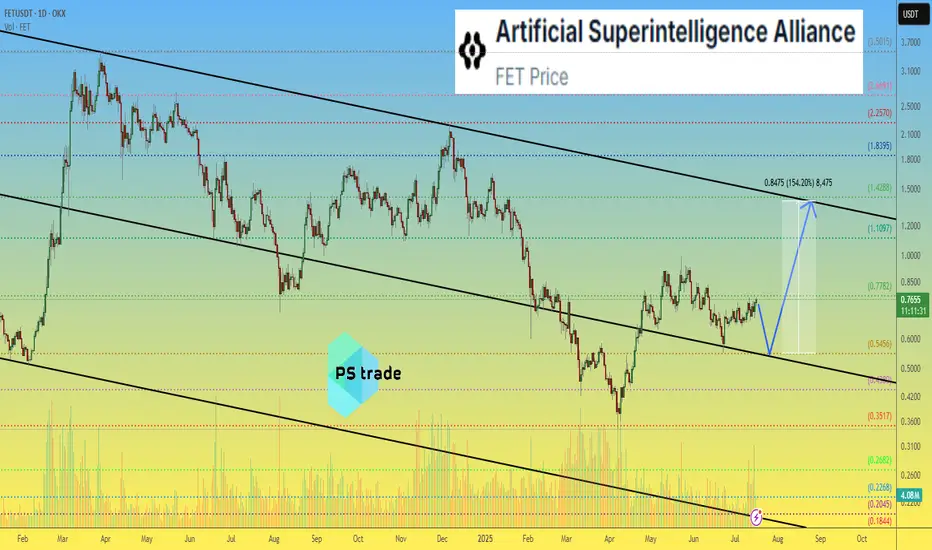
FETUSD Will it continue on its historic bullish pattern?Artificial Superintelligence Alliance (FETUSD) has been trading within a 6.5-year Channel Up ever since its first trading day. The pattern's Bullish and Bearish Legs are very distinct and since its March 25 2024 All Time High (ATH), the market has been on the latest Bearish Leg (red Channel).
The 1W RSI just touched its 30.00 oversold barrier and last time it did so on a Bearish Leg (June 13 2022), the bottoming process (Higher Low) started towards the 0.236 Fibonacci level of the multi-year Channel Up.
As a result, FET may start its new Bullish Leg, as long as the overall market remains on a Bull Cycle. The short-term Target is the 1W MA50 (blue trend-line), with which contact can be made around $0.62000. Long-term (again if the Bull Cycle extends) we could see another +6430% Bullish Leg to $8.000.
-------------------------------------------------------------------------------
** Please LIKE 👍, FOLLOW ✅, SHARE 🙌 and COMMENT ✍ if you enjoy this idea! Also share your ideas and charts in the comments section below! This is best way to keep it relevant, support us, keep the content here free and allow the idea to reach as many people as possible. **
-------------------------------------------------------------------------------
💸💸💸💸💸💸
👇 👇 👇 👇 👇 👇

FET ROADMAPTo me the view is pretty clear.
* The purpose of my graphic drawings is purely educational.
* What i write here is not an investment advice. Please do your own research before investing in any asset.
* Never take my personal opinions as investment advice, you may lose your money.

FET Secondary trend 19 07 2025Logarithm. Time frame 1 week for clarity.
Main trend is an ascending channel.
Secondary trend is a descending channel
Local trend is a Ross hook, at the median resistance. Reversal zone.
By the way, the trading idea from 2022 FET/BTC is still relevant. Pay attention to where the price is.
FET/BTC Main trend. Pump zone cycles . 2022 06

FET Macro Outlook, Why Hasn't it moved?NYSE:FET macro still appears to be in an expanding megaphone pattern with an expected terminal target of the R2 pivot at $4.73 almost a 10x from here.
After being one of the best performers late 2024 FET drew a lot of attention and trapped a lot of new investors and traders. This attracts whales, who pray on the assets sentiment and hope. They apply continued downside pressure every time it pumps as new traders will get excited about that big profits happening again and this wont stop until everyone capitulates and leaves the asset.
Wave 2 of V appears to be underway with a target of the ascending orange support line.
Analysis is invalidated if we drop below wave IV and head to the High Volume Node support at $0.3 keeping wave IV alive but highly likely terminating there and starting a new uptrend with power.
Price is below the weekly 200EMA and weekly RSI is in bottoming zone but and may print bullish divergence.
I plan to execute longs at the key areas to capture at least a bounce profit if not the bottom.
Safe trading

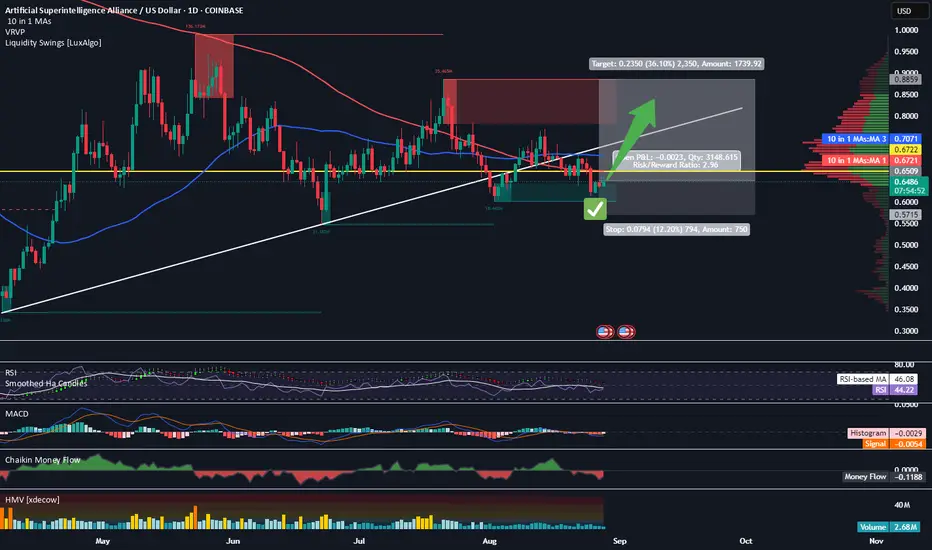
Long Signal Given on Fetch AIFetch AI runs hot when it goes. Recently, I received a BUY alert from my indicator letting me know that we’re getting close to another run soon. I have entered here and will have a fairly conservative target of .88. My SL is .57, giving me a fairly modest 1:3 rrr. My plan is to sell half at the target and let the rest ride. Of course, that could always change with time, so keep an eye on my trade tracker.
FET Wave 2 Underway, Triangle InvalidatedWave C of 2 appears to be underway for $FET. With the 1:1 extension target from wave A lines up with the golden pocket retracement and S2 daily pivot so is definitely an area to watch.
RSI has room to fall into oversold.
Price failed 2 tests of the descending daily 200EMA, we expect price to break through on the 4th.
Safe trading

FET/USDT — Symmetrical Triangle: Ready for Breakout or BreakdownSummary
The FET/USDT (1D) chart is forming a symmetrical triangle — a consolidation pattern where descending highs and ascending lows converge. Price is trading around 0.7020 inside a tight range, with volatility shrinking as it approaches the apex. Major resistance levels are 0.9089, 1.2319, 1.6173, 2.2200, while the key support lies at 0.3444.
---
Pattern Explanation
Pattern Name: Symmetrical Triangle.
Nature: Neutral; direction depends on breakout confirmation.
Context: Formed after a strong downtrend (Dec–Apr) followed by higher lows since April, suggesting possible accumulation.
Key Point: Breakout/breakdown probability increases as the price nears the apex. Always confirm with volume.
---
Measured Move Projection
Triangle height: 2.2200 – 0.3444 = 1.8756.
Breakout projection from ~0.7020 = 2.5776 (long-term measured move target).
Realistically, price will face major resistances first: 0.9089 → 1.2319 → 1.6173 → 2.2200.
---
Bullish Scenario
Confirmation:
Daily close above descending trendline and ideally 0.9089.
Volume expansion above average.
Retest of breakout zone turning into support.
Targets:
Conservative 1: 0.9089.
Conservative 2: 1.2319.
Aggressive: 1.6173 → 2.2200 → measured move ~2.58.
Trading idea:
Aggressive: enter on breakout with stop loss below breakout candle (~<0.65).
Conservative: wait for breakout + retest above 0.9089, enter on retest.
---
Bearish Scenario
Confirmation:
Daily close below ascending trendline.
Volume spike on sell-side.
Retest failure of broken support as resistance.
Targets:
Initial target: 0.3444.
Extended bearish levels: 0.30 → 0.20 if momentum accelerates.
Trading idea:
Short on retest after breakdown or enter on close confirmation.
Stop loss above retest level (e.g. >0.75 if breakdown occurs around 0.70).
---
Key Notes / Risk Management
Watch volume for confirmation, avoid fakeouts.
Confluence with indicators: RSI, MACD, MA 50/200.
Manage risk: use stop loss, avoid overexposure (1–3% per trade).
Keep an eye on fundamentals or project-related news that could trigger sudden volatility.
---
FET/USDT — forming a Symmetrical Triangle near the apex. A breakout above 0.9089 with strong volume could target 1.23 / 1.62 (ext. 2.22 → measured ~2.58). Breakdown below the rising support risks a drop toward 0.344. Always wait for confirmation and manage risk.
#FETUSDT #FET #CryptoAnalysis #TrianglePattern #Breakout #AltcoinAnalysis #SupportResistance #CryptoTrading #TechnicalAnalysis

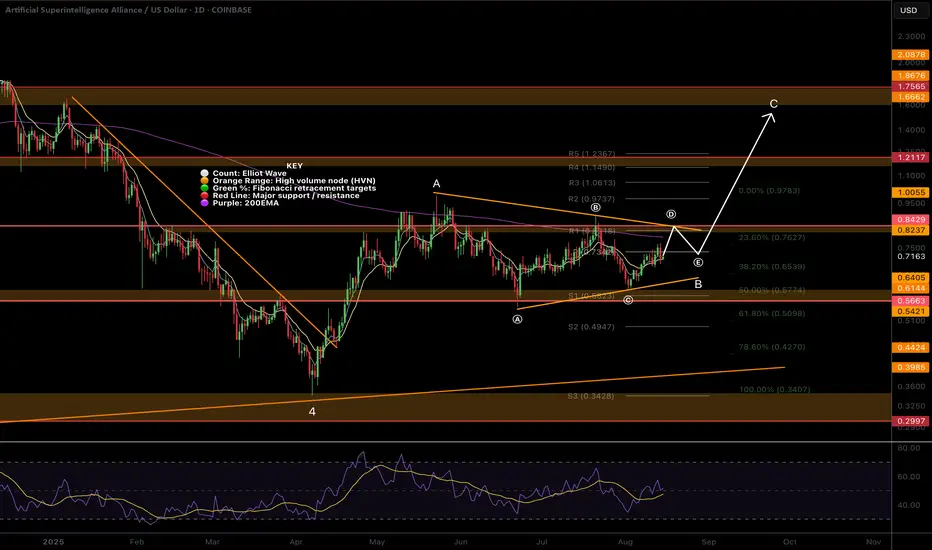
$FET Elliot Wave Updated, Triangle forming?NYSE:FET appears to be printing a triangle in a larger degree wave B of an ABC counter-bear trend correction.
Wave (D) is expected to finish at the descending resistance, poking above the daily 200EMA, while wave (e) is often shallow so expected to end at the daily pivot point. The target is $1.6 at he triangle pattern depth and major High Volume Node resistance.
An ABC corrective wave does not mean that the macro count is invalidated and may form part of larger ending diagonal series of ABCs to achieve my high degree wave 5 targets above all time high. I will update the weekly chart to reflect this shortly.
Safe trading
#FET/USDT Preparing for a Major Rally ?#FET
The price is moving within a descending channel on the 1-hour frame and is expected to break and continue upward.
We have a trend to stabilize above the 100 moving average once again.
We have a downtrend on the RSI indicator that supports the upward break.
We have a support area at the lower boundary of the channel at 0.655, acting as strong support from which the price can rebound.
We have a major support area in green that pushed the price upward at 0.650.
Entry price: 0.665
First target: 0.688
Second target: 0.716
Third target: 0.750
To manage risk, don't forget stop loss and capital management.
When you reach the first target, save some profits and then change the stop order to an entry order.
For inquiries, please comment.
Thank you.

FETUSDT|C&H Setup +100% Breakout MA cluster-A High Quality BreakCup&Handle setup with a high quality breakout the confluent MA cluster—especially the 200-day— as the gatekeeper.
If price hold above the ma200 (and the nearby 20/50) cluster a high-quality breakout and more likely to break the handle and the cup rim.
Here is how I’d weigh it and trade it: DON'T WAIT FOR CUP RIM BREAKOUT
Priority of BUY signal strength indication:
1. Daily close & hold above the ma200 dynamic resistance the most institutions watch - follow BUY
2. Cup handle breakout watch for volume expansion on the break (> 20-day average)
3. Cup rim breakout with a golden cross ma20 reclaim > ma50 curl up is a follow-through BUY
Decision matrix:
- Breaks above key fib level - look for a shallow retest of the breakout line / MA bundle at key fib zone 38.2% - 61.8% liquidity zone for proper trailing stop / limit order.
Target
- TP1 100% fib zone (+50%)
- TP2 extended 161.8% (+100%)
SL slightly below previous low
RR: 3:1
Always trade with affordable risk and respect your stop!

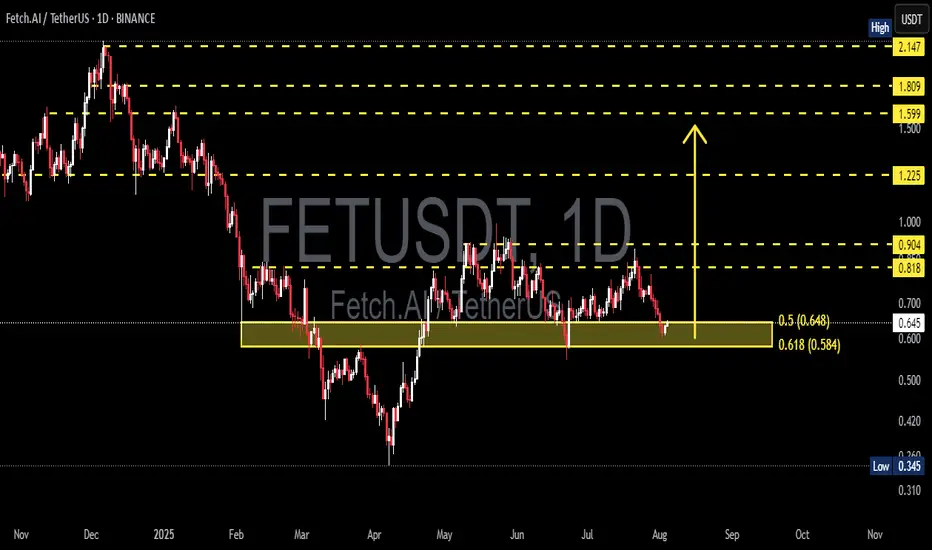
FET/USDT Testing Fibonacci – Bounce Incoming or Breakdown Ahead?📊 Technical Analysis Overview:
FET/USDT is currently testing a strong demand zone aligned with the Fibonacci Retracement 0.5 – 0.618 levels, specifically between $0.648 and $0.584. This “golden pocket” area is historically significant and often acts as a pivot zone for price reversals.
🔍 Chart Pattern:
The price formed a series of higher highs and higher lows from March to June, indicating a bullish structure.
Since July, momentum has weakened, and the price has corrected back into the key support zone that previously acted as a base for a rally.
---
📈 Bullish Scenario:
If price holds above $0.584 and forms a reversal candlestick (e.g., bullish engulfing or hammer), a strong rebound is likely.
Key upside targets:
$0.818 (minor resistance)
$0.904 (psychological level)
Potential breakout toward $1.225 if bullish volume returns.
📉 Bearish Scenario:
A decisive breakdown below $0.584 with high volume could trigger further downside toward:
$0.42 – $0.345 (next major support zone)
This move could confirm a bearish continuation pattern such as a descending triangle if resistance continues to hold.
---
🎯 Strategic Outlook:
The current zone is a make-or-break level, and the market is at a decision point. Traders should wait for a clear confirmation through price action and volume before committing to directional trades.
#FETUSDT #CryptoAnalysis #FibonacciSupport #AltcoinSetup #FetchAI #TechnicalOutlook #BullishOrBearish #SupportZone #GoldenPocket
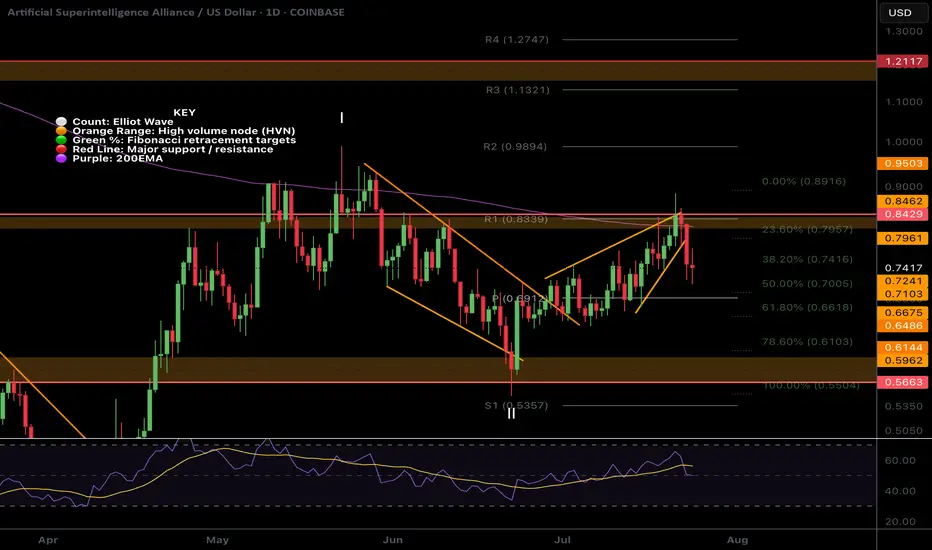
$FET local ending Diagonal and wave 2 near completion?NYSE:FET was rejected for the 4th time at the daily 200EMA! Each time the probability of a breakout increases.
I have adjusted the High Volume Nodes for accuracy.
Locally Fetch appears to have completed a motif wave up with an ending diagonal for wave 5. Wave 2 is expected to find support at the daily pivot and .618 Fibonacci retracement before attempting a breakout of the daily 200EMA once more.
A move below wave II will invalidate this analysis.
Safe trading
Artificial Superintelligence Alliance - FET price analysis📈 It looks like the price of the combined and updated #FET is trying to consolidate at the top of the channel.
All that remains is to wait for confirmation, i.e., for the OKX:FETUSDT price to stay above $0.55 in the coming days/weeks.
🤖 And then the #ArtificialSuperintelligenceAlliance token (the name is more complicated than the stop word from the movie “Eurotrip” — "hello olds" :) can be purchased for an investment portfolio with a growth potential of at least +150%.
_____________________
Did you like our analysis? Leave a comment, like, and follow to get more
$FET Does Zooming out look better?NYSE:FET has been underperforming lately and the local chart looks trash so I wanted to zoom out to give us all some context on the larger picture which hasn't really changed.
Price appears to have completed wave II at the High Volume Node (HVN) support and 0.5- 0.618 'Golden Pocket' Fibonacci retracement and wave 3 is underway but finding local resistance.
Pivots are warped due to the strength of the move last year so wouldn't count them as reliable so focusing on support and resistance. The megaphone pattern is clear and the next area of resistance when FET starts moving is the $1.2
Weekly RSI is decreasing and is attempting to cross bearishly. If Bitcoin has a significant pullback I would expect new lows for FET at this rate. I have a neutral stance at this point.
Analysis is invalidated below $0.546
Safe trading

FET – HTF Setup Primed for ExpansionFET is looking strong here from a high time frame perspective — currently sitting around $0.739, well into the discount zone of the macro trend channel.
We’ve got:
✅ Price holding monthly demand
✅ A clear swing higher low forming on the weekly and 3W
✅ Already seen the first expansion leg out of demand
✅ Now potentially loading the next move higher
Zooming out, price is still trading below the midline of the long-term uptrend channel — and a move back to the upper boundary puts targets in the $6 region, aligned with a new higher high.
📈 HTF Structure
Midline rejection flipped support
Demand tested and respected
HL printed after clean retest
370% upside just to retest the prior HH at $3.50
HTF trend structure still fully intact
This setup is also supported by the broader HTF bullish bias across BTC, ETH, and majors, which adds confluence to a potential larger expansion phase for alts — especially strong narratives like AI.
🎯 Targets
🎯 $3.50 = prior high
🎯 $6.00+ = upper channel target / next HTF extension zone
From current levels, risk/reward looks very clean.
1W:
3W:
3M:
