FET/USDT — Decision Point: The 0.21–0.14 Zone That Defined!The FET/USDT weekly chart is revisiting one of the most historically significant zones in its entire price history — the 0.21–0.14 demand block.
This zone is not just a support area. It has consistently acted as the boundary between Accumulation and Capitulation since 2019. Every major FET rally began only after this zone was defended.
And now, price has returned to this zone once again — making this a major decision point for the next macro trend.
---
Why This Zone Matters
The 0.21–0.14 range served as the structural base for the powerful rallies in 2020, 2021, and the AI-driven surge in 2024.
The sharp downside wick below the zone followed by a fast recovery suggests a liquidity grab, hinting that larger players may still be accumulating here.
Price action is forming a compression pattern, a structure that typically precedes explosive breakouts — either up or down.
This is a point where the market rarely stays quiet for long.
---
Technical Structure & Pattern
FET has formed Lower Highs since the 2024 peak → medium-term downtrend still intact.
But price reactions within 0.21–0.14 remain strong, indicating an early-stage reaccumulation pattern.
The wick sweep below the zone resembles a potential Wyckoff Spring, not yet confirmed but clearly visible.
In simple terms:
If this zone holds, a long-term reversal can begin. If it fails, the chart opens the door to a new bearish leg.
---
Bullish Scenario
🔵 1. Demand Holds: “Buyers Take Control”
If the weekly candle closes above 0.21–0.18, it signals that buyers are still defending this historical demand block.
A stronger confirmation appears once price reclaims 0.30, the nearest structural resistance.
➡️ Bullish Targets:
0.30 → short-term confirmation
0.50 – 0.60 → mid-range resistance
0.90 – 1.50 → major recovery zone
2.50 – 3.40 → full cycle retracement if the AI narrative reignites
This would frame the 0.21–0.14 zone as a macro reaccumulation base before the next expansion phase.
---
Bearish Scenario
🔴 1. Clean Breakdown: “Demand Fails”
A weekly close below 0.14 would invalidate the entire multi-year structure.
If that happens:
the demand block collapses,
bearish continuation becomes highly likely,
and the chart enters a deeper macro range.
➡️ Bearish Targets:
0.10 – 0.07 → historical liquidity zone from 2019–2020
Further downside becomes possible if momentum accelerates
A breakdown below 0.14 would turn FET into a completely new market structure.
---
Key Insight
FET is currently sitting on a zone that has defined every major trend shift for the past 5 years.
The next weekly closes will determine whether we are entering:
a Phase B Accumulation → new macro rally, or
a structural breakdown → multi-month bearish continuation.
This is the calm before a major move — and the 0.21–0.14 zone remains the battlefield.
---
#FETUSDT #FetchAI #CryptoAnalysis
#KeyLevel #DecisionPoint #WeeklyChart #CryptoTA
#SupportZone #Wyckoff #SmartMoneyConcepts #AINarrative
Fetusdtidea

FET/USDT — Testing the Critical Support Zone: Will Reversal?The FET/USDT (4D timeframe) chart shows the price currently sitting at the major support area between $0.25 and $0.20, highlighted by the yellow block. This zone has historically acted as a strong demand area, which previously triggered a massive rally toward the $1+ region in late 2023.
The recent sharp drop indicates heavy selling pressure, but the presence of a long lower wick (rejection) around this area suggests that buyers are still defending this key level — signaling a potential buying reaction zone or early accumulation phase.
---
Pattern Description
The price structure is currently in a descending pattern, but it’s now reaching a potential bottom area. The current setup could evolve into a double bottom or accumulation base formation if the price can hold above $0.20 for the next few candles. This region is crucial for defining whether FET is forming a cycle low before a major rebound.
---
Bullish Scenario
Price holds above $0.25–$0.20 and confirms with a bullish reversal candle (hammer or engulfing).
Break and hold above $0.30 will be the first bullish confirmation.
Mid-term targets: $0.385 – $0.57 – $0.78.
If momentum strengthens, the next potential target is $1.09.
---
Bearish Scenario
If price breaks below $0.20 and fails to recover, the next key support lies around $0.113 (historical low).
A confirmed breakdown below $0.20 signals loss of major structure, opening room for a deeper distribution phase.
In an extreme bearish case, FET may form a new cycle low before any sustainable recovery.
---
Conclusion
The $0.25–$0.20 zone is the key decision point for FET/USDT in the medium term.
Holding this support would strengthen the case for a bottom formation and reversal setup,
but losing it would likely confirm a continuation of the downtrend toward lower levels.
---
#FETUSDT #FetchAI #CryptoAnalysis #TechnicalAnalysis #AltcoinUpdate #SupportZone #CryptoReversal #BullishScenario #BearishScenario #MarketStructure #AIcrypto

FET/USDT — Bullish Reversal or Bearish Continuation?FET/USDT is now trading at 0.575 USDT, right inside the critical support zone between 0.50–0.62 (yellow box). This level has been a major battleground since early 2024, repeatedly holding back sellers and triggering strong rebounds.
Looking closely, the chart has formed a Descending Triangle pattern:
Lower highs show persistent selling pressure.
Horizontal support at 0.50–0.62 acts as the last stronghold for buyers.
Price is already near the apex, signaling that a major breakout is likely approaching.
---
🟢 Bullish Scenario
Trigger: a decisive 4D close above the descending trendline and the 0.70–0.78 resistance zone, supported by strong volume.
Narrative: a breakout here would flip the structure into a classic bear trap, trapping shorts and fueling an aggressive rally.
Targets:
TP1 = 0.784 (+36% from current levels)
TP2 = 1.135 (+97%)
TP3 = 1.617 (+181%)
Strategy: safer entry after breakout + successful retest, with stop loss below 0.62.
---
🔴 Bearish Scenario
Trigger: a confirmed 4D close below 0.50 USDT with rising sell volume.
Narrative: once this key support breaks, buyers lose control, and a strong downside move may follow.
Targets:
Breakdown target from pattern = 0.216 USDT (−62% from current levels).
Next historical support lies near 0.16 USDT.
Strategy: avoid long entries during breakdown. Safer approach is waiting for support confirmation below, or consider short setups.
---
📌 Conclusion
FET is standing at a make-or-break zone. The 0.50–0.62 range will decide its next major move:
A breakout could trigger a multi-stage rally,
While a breakdown risks opening a capitulation phase toward much lower levels.
Key point: wait for 4D close confirmation + volume before committing. Patience will define profit.
---
#FETUSDT #FetchAI #CryptoAnalysis #ChartPattern #DescendingTriangle #Altcoin #CryptoTrading #SupportResistance #BreakoutSetup

FET/USDT — Symmetrical Triangle: Ready for Breakout or BreakdownSummary
The FET/USDT (1D) chart is forming a symmetrical triangle — a consolidation pattern where descending highs and ascending lows converge. Price is trading around 0.7020 inside a tight range, with volatility shrinking as it approaches the apex. Major resistance levels are 0.9089, 1.2319, 1.6173, 2.2200, while the key support lies at 0.3444.
---
Pattern Explanation
Pattern Name: Symmetrical Triangle.
Nature: Neutral; direction depends on breakout confirmation.
Context: Formed after a strong downtrend (Dec–Apr) followed by higher lows since April, suggesting possible accumulation.
Key Point: Breakout/breakdown probability increases as the price nears the apex. Always confirm with volume.
---
Measured Move Projection
Triangle height: 2.2200 – 0.3444 = 1.8756.
Breakout projection from ~0.7020 = 2.5776 (long-term measured move target).
Realistically, price will face major resistances first: 0.9089 → 1.2319 → 1.6173 → 2.2200.
---
Bullish Scenario
Confirmation:
Daily close above descending trendline and ideally 0.9089.
Volume expansion above average.
Retest of breakout zone turning into support.
Targets:
Conservative 1: 0.9089.
Conservative 2: 1.2319.
Aggressive: 1.6173 → 2.2200 → measured move ~2.58.
Trading idea:
Aggressive: enter on breakout with stop loss below breakout candle (~<0.65).
Conservative: wait for breakout + retest above 0.9089, enter on retest.
---
Bearish Scenario
Confirmation:
Daily close below ascending trendline.
Volume spike on sell-side.
Retest failure of broken support as resistance.
Targets:
Initial target: 0.3444.
Extended bearish levels: 0.30 → 0.20 if momentum accelerates.
Trading idea:
Short on retest after breakdown or enter on close confirmation.
Stop loss above retest level (e.g. >0.75 if breakdown occurs around 0.70).
---
Key Notes / Risk Management
Watch volume for confirmation, avoid fakeouts.
Confluence with indicators: RSI, MACD, MA 50/200.
Manage risk: use stop loss, avoid overexposure (1–3% per trade).
Keep an eye on fundamentals or project-related news that could trigger sudden volatility.
---
FET/USDT — forming a Symmetrical Triangle near the apex. A breakout above 0.9089 with strong volume could target 1.23 / 1.62 (ext. 2.22 → measured ~2.58). Breakdown below the rising support risks a drop toward 0.344. Always wait for confirmation and manage risk.
#FETUSDT #FET #CryptoAnalysis #TrianglePattern #Breakout #AltcoinAnalysis #SupportResistance #CryptoTrading #TechnicalAnalysis

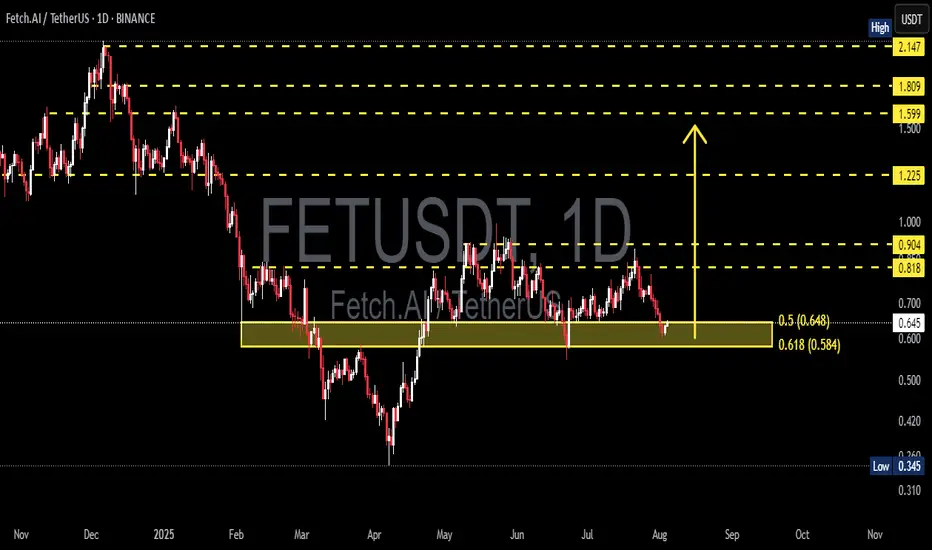
FET/USDT Testing Fibonacci – Bounce Incoming or Breakdown Ahead?📊 Technical Analysis Overview:
FET/USDT is currently testing a strong demand zone aligned with the Fibonacci Retracement 0.5 – 0.618 levels, specifically between $0.648 and $0.584. This “golden pocket” area is historically significant and often acts as a pivot zone for price reversals.
🔍 Chart Pattern:
The price formed a series of higher highs and higher lows from March to June, indicating a bullish structure.
Since July, momentum has weakened, and the price has corrected back into the key support zone that previously acted as a base for a rally.
---
📈 Bullish Scenario:
If price holds above $0.584 and forms a reversal candlestick (e.g., bullish engulfing or hammer), a strong rebound is likely.
Key upside targets:
$0.818 (minor resistance)
$0.904 (psychological level)
Potential breakout toward $1.225 if bullish volume returns.
📉 Bearish Scenario:
A decisive breakdown below $0.584 with high volume could trigger further downside toward:
$0.42 – $0.345 (next major support zone)
This move could confirm a bearish continuation pattern such as a descending triangle if resistance continues to hold.
---
🎯 Strategic Outlook:
The current zone is a make-or-break level, and the market is at a decision point. Traders should wait for a clear confirmation through price action and volume before committing to directional trades.
#FETUSDT #CryptoAnalysis #FibonacciSupport #AltcoinSetup #FetchAI #TechnicalOutlook #BullishOrBearish #SupportZone #GoldenPocket
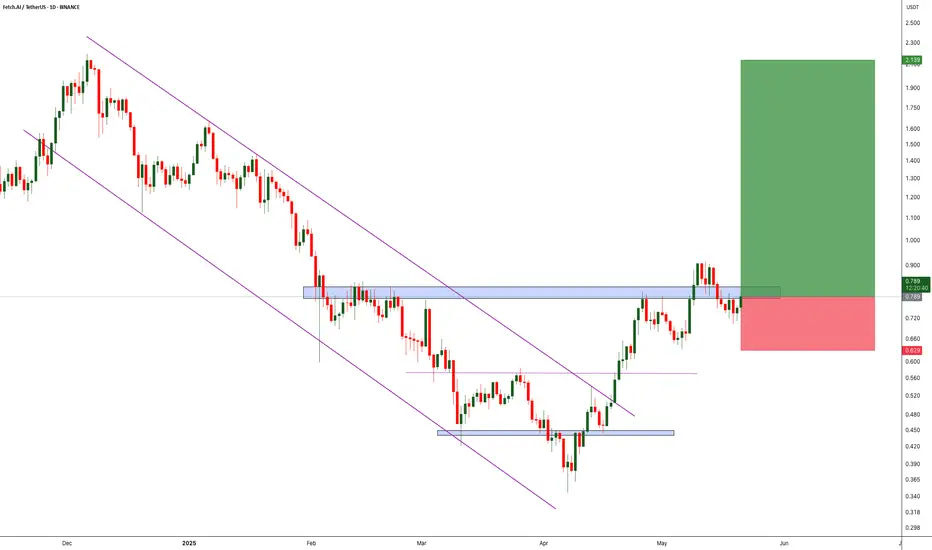
FET/USDT Breakout Imminent? Preparing for a Major Rally!
🧠 Key Pattern: Descending Trendline Breakout
On the daily chart (1D), FET/USDT (Fetch.AI) has been consolidating under a strong descending trendline since its late 2024 highs. Currently, price action is coiling tightly just below this resistance, signaling a potential explosive breakout.
The price is trading near $0.72, right below the trendline — is this the calm before a major move?
🔍 Technical Analysis Overview
📉 Previous Downtrend Structure:
After peaking above $2, FET underwent a prolonged correction phase marked by lower highs and lower lows.
Sellers dominated for months, but the momentum is now shifting.
📈 Current Setup:
FET is forming a series of higher lows since March — an early sign of bullish reversal.
Volume is showing slight increases, which often precedes breakout attempts.
✅ Bullish Scenario (Breakout Rally)
If the price breaks and closes above the descending trendline (~$0.75–$0.78):
1. Initial Resistance: $0.818 → minor overhead supply zone.
2. Confirmation Level: $0.904 → breakout validation zone.
3. Major Upside Targets:
$1.225 → psychological resistance & previous consolidation level.
$1.599 & $1.809 → Fibonacci extension targets from prior impulse.
$2.147 – $2.195 → potential retest of the previous high.
📌 Upside Potential: Over +150%, if breakout is confirmed with strong volume and sustained momentum.
❌ Bearish Scenario (Rejection & Pullback)
If the price gets rejected from the trendline:
Possible pullback to $0.65, the recent higher low support.
Breakdown below this could extend the move toward $0.55 or even $0.47.
Major support: $0.345 → long-term demand zone.
📉 A failed breakout (fakeout) is possible if volume does not support the move.
📊 Trading Strategy Suggestions:
Breakout Entry: Above $0.78 with stop-loss below $0.70.
Retest Entry: Wait for a pullback to confirm support at the trendline after breakout.
Volume Confirmation is Critical — avoid chasing without strong bullish candles.
🧠 Narrative Bonus:
Fetch.AI remains one of the top AI-related projects in the crypto space. As the AI narrative resurfaces, a technical breakout could align with renewed fundamental attention — creating the perfect storm for a rally.
📌 Conclusion:
FET/USDT is positioned at a highly critical technical and psychological level. A confirmed breakout could initiate a large bullish wave, while rejection could drag the price lower. Manage your risk wisely and watch for volume cues.
#FETUSDT #FetchAI #BreakoutSetup #CryptoTrading #AltcoinRally #TechnicalAnalysis #DescendingTrendline #CryptoSignals #AIcoins

FETUSDT Major Resistance Cracked, Eyes on Sky!BINANCE:FETUSDT has recently broken out from a significant resistance level that previously acted as a strong barrier. After this breakout, the price action displayed a textbook retest of the former resistance—now turned support which held firm, confirming the bullish move.
This successful retracement signals strength in the current uptrend and opens the door for potential continuation towards higher highs. The market structure is showing signs of higher lows and increasing momentum, which could fuel a strong rally in the near term.
While the setup looks promising, it’s essential to emphasize risk management. Always use a stop-loss to protect your capital and manage your position sizing according to your trading plan. The crypto market can be volatile, and smart risk control separates long-term winners from short-term chasers.
All eyes are now on NYSE:FET for its next move. If momentum continues, we could witness a significant upward leg. Stay sharp and let the trend be your guide!
BINANCE:FETUSDT Currently trading at $0.88
Buy level : Above $0.8
Stop loss : Below $0.63
Target 1: $1.1
Target 2: $1.4
Target 3: $2.1
Max leverage 3x
Always keep stop loss
Follow Our Tradingview Account for More Technical Analysis Updates, | Like, Share and Comment Your thoughts
$FET has formed an ascending triangle pattern!NYSE:FET has formed an ascending triangle pattern!
After getting rejected from the $0.93–$0.95 resistance zone, price pulled back but it's holding above this lower trend-line support and this 100EMA.
If this support holds, we could see a move back toward the resistance zone, and maybe even a breakout above it.
DYOR, NFA

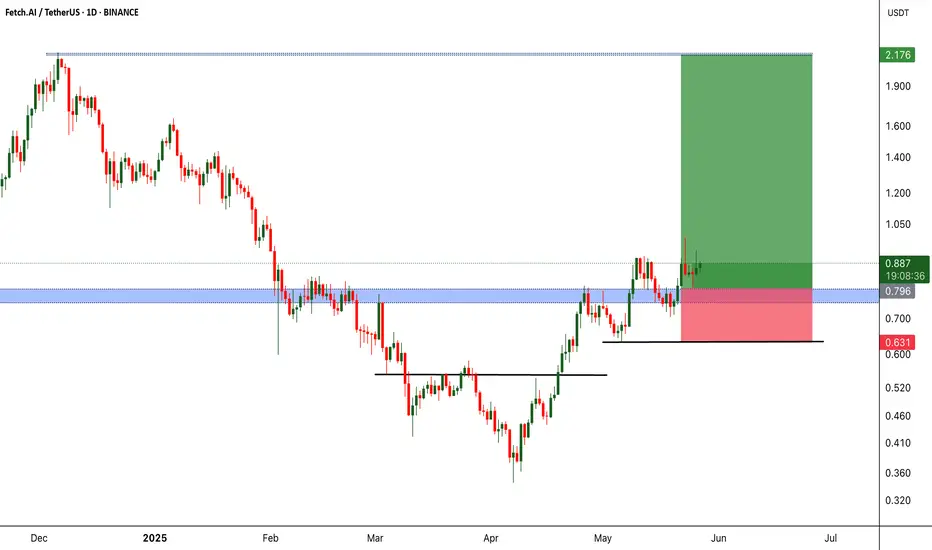
Eyes on FET – The Calm Before the Bullish Storm?BINANCE:FETUSDT previously broke out of a clean descending channel, flipping the trend and shifting into a bullish structure. Since the breakout, the price has been forming consistent higher highs and higher lows — a clear sign of growing momentum. Right now, it’s testing a local resistance zone. A strong breakout above this level could trigger a significant move to the upside, potentially setting the stage for a new bullish leg. Keep an eye on volume confirmation and price action at the resistance.
As always, manage your risk carefully — smart stop loss placement is key in volatile markets. Let the trend be your friend, but don’t forget your seatbelt!
BINANCE:FETUSDT Currently trading at $0.8
Buy level : Above $0.8
Stop loss : Below $0.63
Target : $2.1
Max leverage 3x
Always keep stop loss
Follow Our Tradingview Account for More Technical Analysis Updates, | Like, Share and Comment Your thoughts
FETUSDT.P Breakdown Incoming? Supply Zone + Rising Wedge FET just tapped into a strong supply zone and formed a rising wedge — usually a bearish sign. Price looks weak here and might break down soon.
If the wedge breaks, I’m looking for a short setup.
Entry: 0.716 - Wait for breakdown
Stoploss: 0.746
Target 1: 0.685
Target 2: 0.657
Target 3: 0.607
Waiting for confirmation before jumping in. Let’s see how it plays out.

#FET/USDT Futures Trade Setup!#FET looks good if you missed.
Two options to enter:
1. You can accumulate .5869 to .6080
2. Wait for the US Open and buy at CMP with confirmations.
Targets : .6377 .6522, .6755, .6838 and .7021
SL .5772
Dyor, NFA
Do hit the like button if you want me to post more setups like this.
Thank you
#PEACE

FETUSDT 1D AnalysisFET ~ 1D Analysis
#FET Buy after successfully penetrating this resistant line with a short -term target of at least 10%+ from here.

FETUSDT 1WFET ~ 1W Analysis
#FET Buy gradually from here if you still have a Conviction on this coin with a short -term target of at least 20%+.

FETUSDT 1WFET ~ 1W Analysis
#FET If you still have a Conviction on this coin. Maybe you can consider this support to start buying back from here with a minimum target of 20%+.

FETUSDT Analysis: Tremendous Potential If the Blue Box Is RegainFolks, FETUSDT is showing some big league potential . If it regains this blue box , we’re talking about a move that could be absolutely tremendous . This zone is carefully selected—it’s no coincidence, believe me.
Why the Blue Box Matters:
Critical Level: If buyers step up here, we’re looking at a major opportunity.
High Potential: Regaining this zone opens the door for explosive moves.
Precision Tools: I’ll use CDV, liquidity heatmaps, volume profiles, and volume footprints for confirmation. Only the best tools for the best trades.
Want to Learn the Secrets? I can teach you how to master CDV, liquidity heatmaps, volume profiles, and volume footprints . DM me and get ahead of the game.
Final Thoughts: This blue box is the real deal, folks. Manage your risk, stay patient, and let the market come to you.
If this helps you, boost, comment, and follow!
Let me tell you, folks, this is amazing. Nobody does analysis like I do. Believe me. If this helps you, don't forget to boost and comment! It’s a big deal, motivates me to share even more winning insights with you. Tremendous insights.
I keep my charts the best, clean, simple, and clear. You know it, I know it, clarity leads to better decisions. No question about it. My approach? Built on years of tremendous experience. Incredible track record. I don’t claim to know it all, but I spot high-probability setups like nobody else. Trust me.
Want to learn how to use the heatmap, cumulative volume delta, and volume footprint techniques I use to determine demand regions with stunning accuracy? Send me a private message—totally free, folks. That’s right. I help anyone who wants it, absolutely no charge. Unbelievable value.
Here’s the list, long list, great list, of some of my previous incredible analyses. Each one, a winner:
🎯 ZENUSDT.P: Patience & Profitability | %230 Reaction from the Sniper Entry
🐶 DOGEUSDT.P: Next Move
🎨 RENDERUSDT.P: Opportunity of the Month
💎 ETHUSDT.P: Where to Retrace
🟢 BNBUSDT.P: Potential Surge
📊 BTC Dominance: Reaction Zone
🌊 WAVESUSDT.P: Demand Zone Potential
🟣 UNIUSDT.P: Long-Term Trade
🔵 XRPUSDT.P: Entry Zones
🔗 LINKUSDT.P: Follow The River
📈 BTCUSDT.P: Two Key Demand Zones
🟩 POLUSDT: Bullish Momentum
🌟 PENDLEUSDT.P: Where Opportunity Meets Precision
🔥 BTCUSDT.P: Liquidation of Highly Leveraged Longs
🌊 SOLUSDT.P: SOL's Dip - Your Opportunity
🐸 1000PEPEUSDT.P: Prime Bounce Zone Unlocked
🚀 ETHUSDT.P: Set to Explode - Don't Miss This Game Changer
🤖 IQUSDT: Smart Plan
⚡️ PONDUSDT: A Trade Not Taken Is Better Than a Losing One
💼 STMXUSDT: 2 Buying Areas
🐢 TURBOUSDT: Buy Zones and Buyer Presence
🌍 ICPUSDT.P: Massive Upside Potential | Check the Trade Update For Seeing Results
🟠 IDEXUSDT: Spot Buy Area | %26 Profit if You Trade with MSB
📌 USUALUSDT: Buyers Are Active + %70 Profit in Total
🌟 FORTHUSDT: Sniper Entry +%26 Reaction
🐳 QKCUSDT: Sniper Entry +%57 Reaction
📊 BTC.D: Retest of Key Area Highly Likely
And that’s just the start. The list goes on and on, folks. It’s a tremendous list, the best. I stopped adding because, frankly, it’s tiring. So many wins. People are amazed. You can check my profile and see for yourself, winning moves, all the time. Believe me, nobody does it better.

FETUSDT 1WFET Update ~ 1W
#FET At Time Frame 1W, NYSE:FET Again rejected from this resistance line. The best way for now. You need to wait for this resistance line to be broken with a Full Candel. Or you can place buyers on this support block.
These two scenarios are with a minimum target of 20%+

FET Breaks Out: Bullish Momentum Ahead!NYSE:FET has broken out of a symmetrical triangle pattern and is currently holding above the breakout level!
📈 Entry: Accumulate above $1.90
🎯 Targets:
Midterm: $3.50 (80% upside)
Long-term: $6.00 (200% upside)
🛡️ Stop-loss: $1.70
Available for both spot and futures trading. The breakout confirms bullish momentum, making this a strong candidate for a trend continuation play.
ABOUT NYSE:FET
Fetch.ai ( NYSE:FET ) powers decentralized machine learning on autonomous economic agents, optimizing the economy and creating new value networks.
🚨 DYOR, NFA.
#Crypto #Altcoins #FET

FETUSDT FETUSDT techncial analsysi udpate
FETUSDT has formed an inverse head-and-shoulders pattern at a strong support level. The price is now breaking above the pattern's neckline resistance on the daily chart. A rise in volume has been observed over the past few days near the resistance level. Once the breakout is confirmed, a strong bullish move can be expected in FET.
Regards
Hexa

$FETUSDT Heating Up for a Major Breakout!BINANCE:FETUSDT recently experienced an unsuccessful breakout from an inverse head and shoulders pattern, followed by a consolidation phase. Now, it’s forming a bullish channel and showing signs of strength, indicating that a significant upward move may be on the horizon.
As always, remember to use a stop loss and invest only a small portion of your capital to manage risk effectively.
BINANCE:FETUSDT Currently trading at $1.29
Buy level: Above $1.27
Stop loss: Below $1.05
TP1: $1.5
TP2: $1.75
TP3: $2.5
TP4: $3.5
Max Leverage 3x
Follow Our Tradingview Account for More Technical Analysis Updates, | Like, Share and Comment Your thoughts

FETUSDT: Ready to Smash Resistance! FETUSDT: A Second Chance at Breaking Resistance!
FETUSDT has recently faced challenges with an unsuccessful breakout from a head and shoulders pattern, but it's now making another attempt to break through major resistance. This presents a compelling opportunity for traders looking to enter the market. As FETUSDT approaches this critical resistance level, a successful breakout could signal the start of a bullish rally.
For those looking to capitalize on this potential move, consider entering the trade once the resistance is confirmed as broken. Remember to implement a stop loss to manage risk effectively, ensuring you protect your capital.
FETUSDT Currently trading at $1.44
Buy level: Above $1.488
Stop loss: Below $1.22
TP1: $1.77
TP2: $2
TP3: $2.6
TP4: $3.5
Max Leverage 3x
Follow Our Tradingview Account for More Technical Analysis Updates, | Like, Share and Comment Your thoughts

FETUSDTFET ~ 3D
#FET Buy after breaking this descending pattern or buy when this support block is retested. Minimum target 20%

Fetusdt setupWe are looking a nice bullish fvg on the daily, for my point of view we are seeing a bullish flag on the daily,you could for long entry based your entry rules it might be breakout or something,but crypto does loon interesting to long.

FETUSDTFET ~ 3D
#FET Buy after breaking this descending pattern or buy when this support block is retested. Minimum target 20%
