FF looks Bearish (4H)It appears that we have an ABC pattern in which wave B formed a triangle, and the final leg of this triangle | wave e of B | has now completed. The price is entering a larger wave C, which is a bearish wave.
A 4-hour candle closing above the invalidation level will invalidate this analysis.
The targets are marked on the chart. These targets are for taking profit. Price can even move beyond the green zone, but since this is a volatile and newly listed coin, it’s better to take profit at each level and then move the stop-loss to breakeven.
For risk management, please don't forget stop loss and capital management
When we reach the first target, save some profit and then change the stop to entry
Comment if you have any questions
Thank You
FFUSDT

FF Looks Bullish (2H)FFUSDT has been ranging within a zone for a while, taking out both buyers’ and sellers’ stop-losses. After creating a large liquidity pool at the bottom and sweeping that lower pool, it now appears ready to move toward the key level.
On this timeframe, we have a bullish outlook on the FFUSDT pair.
Do not enter the position without capital management and stop setting
Comment if you have any questions
thank you

FFUSDT Forming Bullish WaveFFUSDT is currently displaying a bullish wave pattern, indicating a potential continuation of its upward momentum. This technical formation often appears when a cryptocurrency consolidates after an accumulation phase, setting the stage for a significant move higher. The good trading volume confirms growing market participation, which strengthens the bullish setup and signals that investors are actively positioning for the next major breakout. The overall price structure suggests that FFUSDT could be preparing for a powerful wave extension in the coming sessions.
With the expected gain between 190% to 200%+, FFUSDT presents an impressive upside potential for traders closely watching this asset. The bullish wave pattern typically unfolds in multiple impulsive legs, and the current wave structure seems to be forming its next bullish leg. Momentum indicators like RSI and MACD are supporting this view, hinting at renewed strength and a possible continuation toward higher resistance levels.
Investor sentiment toward this project is improving, as evident from the increasing trading activity and buying pressure. This growing confidence may push FFUSDT into a strong breakout zone, attracting both short-term traders and long-term investors. If the momentum continues, the price could enter a parabolic phase, leading to substantial returns as it rides the next bullish wave.
✅ Show your support by hitting the like button and
✅ Leaving a comment below! (What is You opinion about this Coin)
Your feedback and engagement keep me inspired to share more insightful market analysis with you!

FFUSDT UPDATE#FF
UPDATE
FF Technical Setup
Pattern: Symmetrical triangle breakout
Current Price: $0.157
Target Price: $0.215
Target % Gain: 155.46%
NYSE:FF has broken out of a symmetrical triangle pattern on the 4H timeframe, signaling a potential bullish continuation. With the current price at $0.157, the projected target stands at $0.215 — representing a 155% upside move. Momentum looks strong following the breakout, suggesting a possible trend expansion.
Time Frame: 4H
Risk Management Tip: Always use proper risk management.

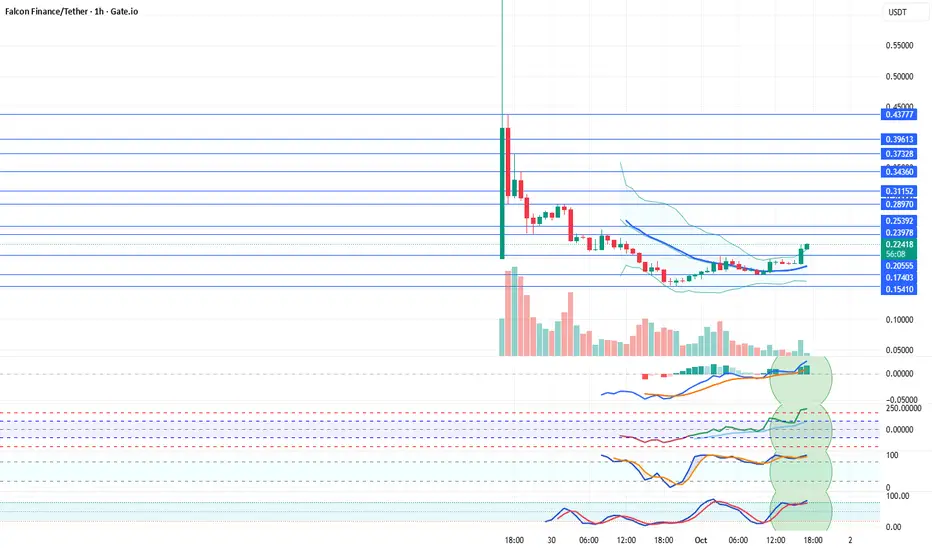
FFUSDT 1 Hour Technical AnalysisFFUSDT 1 Hour Technical Analysis
Falcon Finance Coin has risen above its 21-day moving average. After the sharp decline following its listing, it now appears to be recovering. Having broken above the 0.20555 resistance, we believe Falcon Finance Coin may continue its upward movement if indicators remain positive. Resistance levels will be monitored closely.
Resistances: 0.2397 – 0.2539 – 0.2897 – 0.3115 – 0.3436 – 0.3732 – 0.3961 – 0.4377
Supports: 0.2055 – 0.1740 – 0.1541
We’d appreciate it if you 🚀 rocket our posts. Also, don’t forget to share them on your social media accounts.
Legal Disclaimer:
The information, comments, and recommendations provided here do not constitute investment advisory services. Investment advisory services are offered within the framework of an investment advisory agreement to be signed between the client and brokerage firms, portfolio management companies, or non-deposit banks. The content shared on this page reflects only personal opinions. These views may not be suitable for your financial situation, risk profile, or return preferences. Therefore, no investment decisions should be made based on the information provided here.
FFUSDT Coin 15 Min. Technical AnalysisFFUSDT Coin 15 Min. Technical Analysis
Falcon Finance, a newly listed coin on the exchanges, is currently moving sideways in the 15-minute technical analysis. As long as it is priced above the 0.239 support, there may be a possibility to test the 0.507 resistance in the future.
Resistances: 0.2897 - 0,3115 - 0,3436 - 0,3732 - 0,3961 - 0,4377 - 0,5071
Supports: 0,2397 - 0,2000
We would appreciate it if you rocket our posts. Also, don’t forget to share on your social accounts.
Legal Disclaimer:
The information, opinions, and recommendations contained here do not constitute investment advice. Investment advisory services are provided within the framework of an investment advisory agreement to be signed between clients and brokerage firms, portfolio management companies, or non-deposit banks. The content written on this page only reflects personal views. These views may not be suitable for your financial situation, risk, and return preferences. Therefore, investment decisions should not be made based solely on the information and writings here.
