$AFRM: 🚨 Road to $55 🚀Hi everyone,
Affirm Holdings ( NASDAQ:AFRM ) seems to be capitalizing on their consumers' repayment abilities, showing promising technical signals. Currently, the hourly and daily indicators are tightening, hinting at potential explosion in either direction (Upside likely). Should the price surpass the daily and monthly resistance levels, accompanied by the hourly or daily indicators crossing above the monthly, we could see a surge towards $55, with the weekly indicators serving as a potential support level.
Good luck!
Fibs

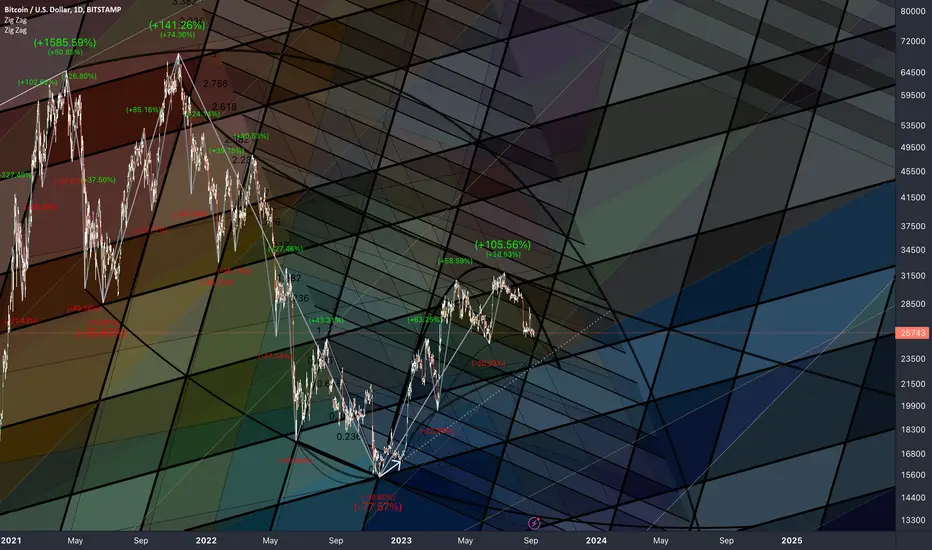
A Bitcoin Fib-Time Based Cycle (Concept #2)In this chart, we take a look at a second Bitcoin Fib-Time Cycles concept (2/5). Refer to the original idea for concept #1 linked below. This Concept #2 is an alternative 8-step cycle phase to my original concept. This zooms out further and takes Bitcoin from a greater 2-phase cycle perspective. This concept is for the long-term investor who aims to track major Bitcoin phases when time is not on their side. Treat each signpost phase as a ranged period mindset until the next is triggered. This is not to be conflicted with the original concept, however, another perspective.
In this second concept, the positioning of the trend-based Fib-Time Extensions has been drawn from Bitcoin's inception to the first impulse rally from 2009 to its 2017 all-time high. From there it is projected sequentially again to 2026. The reasons for placement are through an observational nature in the structure of the cycles, or at least how I see it. From 2009 > 2011 > 2013 > 2017 as being marked one cycle, to 2017 > to now as a potential being marked as the second cycle. A repeat of this cycle however is on a larger scale. The ATHs to cycle lows across these two cycles are also noted as 2011's low from ATH was -93% whereas 2013 was 86%. Thus in 2017, it was -84% and to date 2022 is -76%. It appears that it is 1 larger drop proceeding by a lesser % drop.
Note: These vertical projections are not manually placed; they are based on Fibonacci sequence numbers derived from the noted placements (0-1). Interestingly, where they end up relates to the major pivots across the start and end of the sequence.
Importantly, this is not a price prediction or estimation, nor does it offer an overall bearish or bullish take. Although the outlook seems bullish, cycles can play out over the years, and we may not have seen Bitcoin's final cycle just yet. This is why this is an alternative concept to others I have been exploring. More alternatives in the coming weeks and months.
This merely presents a conceptual analysis of Bitcoin's time and cycles to date, highlighting key pivotal points worth watching for. Timing can be just as crucial as managing risk. Having a plan to correlate these factors allows you to spend less time watching charts and more time enjoying whatever you want.
Key Takeaways:
With a 1-2 weeks variance, each fib level (signpost) approximately triggers the next phase. It is within that phase expect the noted legend and take that mindset.
Each fib range marks approximately 2900 days (8yrs)
Note that 0.5 is not an actual fib level.
Once a cycle of phases is completed, rise and repeat.
We are 8 weeks, 3 days until we hit the next phase (Climb the Wall of Worry)
This current second iteration cycle is projected to end in Dec 2025.
This is purely a concept and not financial advice. I apologise for the resolution. A screenshot can be viewed here:

Ethereum BullishEthereum Bullish
I am not a financial advisor. This is not meant to be and does not constitute financial, investment, trading, or any other types of advice or recommendation.

$PYPL: 🎯 Road to $77 🚀Hi everyone,
PayPal's stock appears bullish. Earlier this year, in January leading into February, the daily indicators tested the weekly ones but were rejected, causing a price drop. Recently, however, the daily indicators have successfully breached the weekly ones, propelling the price towards a potential monthly test. The immediate target is set at $77. A breach of this level could see the price aiming for the monthly target. The daily and weekly indicators will be closely watched for support, should there be any challenges in sustaining the upward momentum.
Good luck!

A Comprehensive Guide to Fibonacci Retracements (Updated)Hello traders, in this post, we will be going over one of the most commonly used tools in all asset classes - the "Fibonacci Retracement" (or Fib for short). For a better viewing experience, please view this on your desktop/PC, as the mobile and tablet versions of the charts are harder to read.
Although I have briefly touched on how to use the Fibonacci Retracement tool in my previous Elliott Waves series, we are now going to go over it in depth, and talk about how this tool can help you find entries and exits within an existing trend with or without the use of the Elliott Wave Theory, which also helps identify whether you are in a bullish or bearish trend.
The Fibonacci Retracement tool, although widely used by many traders, is almost always not correctly used by new traders. Most traders will often connect the wrong points, indicating the wrong Fibonacci retracement levels. Here, I will be explaining the proper way to use the Fibonacci Retracement tool in a very simple translated friendly guide in one post.
-------
What Is the Fibonacci Retracement?
Fibonacci Retracements (Fib(s) for short), are a set of 'ratios', defined by mathematically important Fibonacci sequence. This allows traders to identify key levels of support and resistances for price action. Unlike other indicators, Fibonacci retracements are FIXED, making them very easy to interpret. When combined with additional indicators, Fibs can be used to identify potential entry and exit points with high probability to trade on trending movements. Fibonacci retracements are used to indicate levels of support and resistance for a stock’s price. Although they are similar to moving averages in this respect, Fibonacci retracements are set by the extent of the previous bullish or bearish run and do not change each day in the current trend as moving averages do. Therefore, it can be significantly easier to identify and anticipate support and resistance levels from Fibonacci sequences.
How Is the Fibonacci Retracement Calculated? (You don't need to calculate it yourself - It's already done for you!)
Fibonacci retracements are based on what is known as the 'Fibonacci sequence', where each number in the sequence can be added to the previous number to produce the following number within the sequence. Now, you might be confused here, but don't! - I am just explaining the concept on how it's calculated. You do not need to personally calculate the actual sequence of the Fibonacci Retracement, as everything is already pre-determined and calculated within the tool itself on TradingView. To put it simply, dividing any number in the sequence by the following number yields 1.6180 – known as the "Golden Ratio" – while dividing any number by its predecessor yields 0.6180. Dividing any number in the sequence by two positions in advance yields 0.382, while dividing any number by a number three positions in advance yields 0.236. These ratios originated from the Fibonacci sequence are found throughout nature, mathematics, and architecture - such as flowers, buildings, and so forth. Yes, if you search for Fibonacci sequence examples, you can find these within daily uses, not only in trading.
------
Retracement levels for an asset are drawn based on the prior bearish or bullish movement. Don't forget this - you need to know whether you are in a bullish or bearish trend. Is the stock or coin going up? or down? To plot the retracements, draw a trendline from the low to the high (also known as the swing low to the swing high), or vice versa, high to low, within a continuous price movement trend – Fibonacci retracement levels should be placed at 61.80%, 38.20%, and 23.60% of the height of the line for you by the tool itself. Again, these numbers are already calculated for you within the tool itself. In a bullish trend, the retracement lines start from the top of the movement (i.e. the 23.60% line is closest to the top of the movement), whereas in a bearish movement the retracements are calculated from the bottom of the movement (i.e. the 23.60% line is closest to the bottom of the movement).
------
How to Trade Using the Fibonacci Retracement
Once you have drawn a set of Fibonacci retracements on a chart of your liking, it is possible to anticipate potential reversal points where support or resistance will be encountered. If the retracements are based on a bullish trend, the retracements should indicate potential support levels where a downtrend will reverse bullishly. So to put it simply, the pre-determined Fibonacci levels, should in theory and practicality, act as support if in a bullish trend, and resistance in a bearish trend.
There will always be some form of price reaction at each Fibonacci level just based on Market Psychology. If the retracements are based on a bearish movement, the retracements should indicate potential resistance levels where a rebound will be reversed bearishly, which is vice-versa for the bullish movement trend.
The most common reversals based on Fibonacci retracement levels occur at the 38.20%, 50%, and 61.80% levels (50% comes not from the Fibonacci sequence, but from the theory that on average, stocks retrace half of their prior movements - so this is considered a 'psychological level'). Although retracements do occur at the 23.60% line, these are less frequent and require close attention since they occur relatively quickly after the start of a reversal. In general, retracement lines can be considered stronger support and resistance levels when they coincide with the overall trend, meaning, that if you know that you are in an established bullish or bearish trend, you will most certainly get some form of reaction at the most common reversal levels within the Fibonacci level, which is shown in the image below.
Whenever applying Fibonacci retracements, keep in mind that retracement lines represent only potential support and resistance levels, they are NOT 100% set in stone – they represent price levels at which to be alert, rather than hard buy and sell signals; however, they have HIGH PROBABILITY. It is important to use additional indicators, in particular MACD, to identify when support or resistance is actually being encountered and a reversal is likely. The more that additional indicators are pointing towards a reversal, the more likely one is to occur. Also note that failed reversals, especially at the 38.20% and 50% retracement levels, are common.

Bullish Fibs Upmoves in Oil - Now, Needs to Defend 61.8% LineOil has held bull fibs since Feb 1. The 3 previous fibs are documented and highlighted on the chart. We have been in a wide-range pattern for the past couple of weeks, threatening to keep and hold yearly highs, only to fall back down. Now, it is facing it's biggest test in the upmove, with two different saves at the 61.8% line over the last week. Given the dynamics of the recent down move, I expect this 61.8% line to be challenged early on Sunday night / Monday with a break of 40-60 cents. If we can hold those level above and regain this 77.60 level, I do anticipate a big move to new highs in oil, ALL THE WAY UP TO 82.11.

VRA/USDT Bullish Higher Timeframe Targets #VRA #VRAUSDTHere we see our VRA Weekly chart and you can see it's showing strength now . VRA is pushing up over that dark blue 200MA line and that's very Bullish in my opinion . Altseason seems to be upon us as Bitcoin is right below its' previous ATH . If VRA can get back to it's previous ATH price near
.088 cents then targets above there could be the following fib levels -
1.618 fib extension near .14 cents
2. fib extension near .175 cents
2.618 fib extension near .22 cents
NFA DYOR but VRA is known to have a strong community and possible good news with tokenomics this year

UNI/USDT - Long and Short PlaysNot really sure about this one, as I'm expecting BTC to do a fat ABC retrace after the Elliott Wave that recently finished playing-out (see last two posts) - If BTC does retrace, ALTs should follow.
Ignoring all timings. I'm only focusing on the Elliott Wave counts and any confluence.
For UNI/USDT, I've got 3 x Elliott Waves to give me short, medium and long terms plays in both long and short directions.
Red EW- Long term (1D).
Blue EW - Medium term (4h).
White EW - Short term (1h).
Short term - White EW
Assuming we've already bounced off the white wave-4, I'm now looking for price to tap wave-5 @ 2.618. However, if wave-4 hasn't hit yet, price could first come down as low as the white wave-1 peak.
Medium term - Blue EW
After the blue wave-3 gets tapped @ 1.618, we should retrace to create wave-4. This could be as low as the blue wave-1 peak.
Once wave-4 is complete, we should head up to wave-5 @ 2.618.
Blue wave-5 also aligns with the Point of Control (POC) on my Volume Profile.
Long term - Red EW
After we retrace from Red wave-1 to wave-2, price should back head up to the red wave-3 range @ 1.618.
I think UNI will top at the red wave-5 range @ 2.618.
Red wave-5 also aligns with the Value Area High (VAH) on my Volume Profile.
I put a fib extension on my Volume Profile:
Red wave-3 taps the Volume Profile's 1.618.
Red wave-5 taps the Volume Profile's 2.618.
Let's see...

NEAR Bullish I am not a financial advisor. This is not meant to be and does not constitute financial, investment, trading, or any other types of advice or recommendation.

Bitcoin Fib ScalingAnother alteration of former series of structures which I highly recommend considering to look at in my previous btc-related ideas.
The steepest Fib Channels source and reason why are they are spaced apart relatively far:
The trendlines people draw in TA is replaced with curves in Fractal Analysis.
Since a line is odd to natural formations, it has no value in covering the process of price action too.
The use of straight lines present in my approach is justified since they indicate particular fibonacci ratio that price mechanism abides by.
First of all I want to be clear about the curves:
Being chart-based enables its predictive levels
Curves mimic parabolic tendencies of group of bars in perspective of both time and price scales
Reveals general direction
Curves validate fibonacci fractal structure and their levels
Seeing curves extended to massive scales doesn't necessarily mean that price will reach there.
What important is the market behavior while encountering curves as it bares timing properties that considers the logistic curve of information spreading .
NOT A PREDICTION JUST AN ILLUSTRATION OF PRINCIPLE
For example here we see that the curve ends at 22767.
It's still just an assumption that price would end up falling there according to curve.
Obviously reality is too chaotic to predict it precisely. So instead of focusing on immediate price action, the attention should be at crossings.
The trading trigger should be at the very process of breaking the curve because it means price leaves the logistic curve of information spreading.
Breaking the curves means a market takeover by new narrative (news, rumors, reports, etc) but to the opposite direction of the curve.
Trade plan for LONG hold. Hello, dear community!
I hope you all are fine and doing well, This is what I planned for Monday, if you agree thumbs up if there is any suggestion please let me know. During this long hold, we will have many scalp setups also in our Lower Time frame.
The setup will be invalidated after the red-tagged SL level.
Happy weekend :)

Quest Diagnostics // Buy Future Dip Notes on how I personally use my charts/NFA:
Each level L1-L3 and TP1-TP3 (Or S1-S3) has a deployment percentage. The idea is to flag these levels so I can buy 11% at L1 , 28% at L2 and if L3 deploy 61% of assigned dry powder. The same in reverse goes for TP. TP1: 61%, TP2:28% and TP3:11%. If chart pivots between TP's, in-between or in Between Sell levels these percentages are still respected. I like to use the trading range to accumulate by using this tactic.
Just my personal way of using this. This is not intended or made to constitute any financial advice.
This is not intended or made to constitute any financial advice.
FED Macro Situation Consideration:
All TP's are drawn within the context of a return to FED neutral-easing policy. I do not expect these levels to be reached before tightening is over.
NOT INVESTMENT ADVICE
I am not a financial advisor.
The Content in this TradingView Idea is for informational purposes only, you should not construe any such information or other material as legal, tax, investment, financial, or other advice. Nothing contained within this idea constitutes a solicitation, recommendation, endorsement, or offer to buy or sell any securities or other financial instruments in this or in in any other jurisdiction in which such solicitation or offer would be unlawful under the securities laws of such jurisdiction.
All Content on this idea post is information of a general nature and does not address the circumstances of any particular individual or entity. Nothing in the idea/post constitutes professional and/or financial advice, nor does any information on the idea/post constitute a comprehensive or complete statement of the matters discussed or the law relating thereto. You alone assume the sole responsibility of evaluating the merits and risks associated with the use of any information or other Content on the idea/post before making any decisions based on such information.

🦊FOX SHAPESHIFT TO .25 USDFOX in the Hole!
looking to extend to .255 based on some fib from a sly fox....
support/resistance basics here kids
🦊🦊🦊

Navigating the Markets with Fibonacci ChannelsToday we delve into the fascinating world of Fibonacci Channels, a powerful tool for traders looking to identify potential non-horizontal support and resistance levels in the market.
Throughout the video, we provide a step-by-step guide on how to place Fibonacci Channels on price charts, allowing you to visualize and understand their significance in identifying key price levels. We also showcase real-world examples to demonstrate how Fibonacci Channels can be used to find points of interest, such as trend reversals and price targets.
Furthermore, we discuss the integration of Fibonacci Channels with other technical indicators, providing insights into how this combination can enhance your trading strategy. By the end of this video, you will have a comprehensive understanding of Fibonacci Channels and the ability to confidently incorporate them into your trading approach. Get ready to unlock the potential of Fibonacci Channels and take your trading skills to the next level!

mara So here is my thoughts on MARA which I get a lot of requests for in my group. Been nailing Mara since Mid 2022 TBH.
We are either finished with Wave C of the B or still finishing. If finished with B then we are in W1 of the HTF C which can extended to the 1.618% or truncate at 2021 highs

BTCPossible HTF count if conditions are met. Would be looking for the 3 to top before 1/2ing around SWB:69K

BTCUSD interesting geometryHere is some interesting geometry on an outer edge ray.
- Extrema point 0 on ATH
- Extrema point 1 on PI * 27.3 (orbital period moon) High
- Break on PI
- Retest on 3.5
All within a tiny margin of error.
The time between 0 and 1 ≈ 5 moon orbits
The time between 0 and PI ≈ 16 moon orbits
You could probably draw and find proportions everywhere on either scale, but what is the chance of them relating equally on both price AND time scales?
How unique is this occurrence?
Statistically probably a unicorn event.
How great would it be, to produce analytical algorithms that find these price and time-dependent extrema points and relate them with each other via things like outer edge extension rays, to measure and test at what proportions they are broken/retested, and so change in status, to truly test how unique, predictable and structured-to-nature the market behaves.

S&P-500: All Support and Resistance for Bull and Bear ScenariosLet me explain this. ALL SPIKES ARE THE SAME. However, the different timeframes and chart scales create 4 unique layouts for both Daily and Weeklies.
The top two are Dailies and the bottom two are weeklies. I have labeled which chart scale they are on.
THE TOP TWO HAVE RESISTANCE SCHEMATICS (THE SAME TWO) .
As in, the extensions are RESISTANCE (IN RED)
THE BOTTOM TWO HAVE SUPPORT SCHEMATICS (THEY ARE DIFFERENT) . As in, the extensions are SUPPORT (IN GREEN)
*We have just intersected the 2.618 and now we either....*
A. Go to the 1.618 now at 3970...
B. We go back to 4.236 and crab around...
C. Go through the 4.236 and to the 6.854 where we possibly create a disjointed double top...
D. Drop through all support, destroy schematics at 3500 and find NEXT SUPPORT AT (GREEN)
BTW: The Dailies are 3 Day timeframes because Dailies are too strecthed. BUT THE DAILY SCHEMATICS ARE PURELY MADE FROM DAILIES SO IT DOES NOT MATTER.
---You may notice that the bottom two support schematics are
the same as #2 and #3 on my "S&P-500: All Fibonacci Schematics" idea linked below---

ANALYSIS ON NVDADear Investors and Traders,
I'm sharing with you this analysis on NVDA to let you know that the price will come down after the squeeze it made in October, if you're holding as an investor close your position and take your profits, and if you're trading there's no point of taking long trades on NVDA currently.
For further questions, don't hesitate to ask!

DG Daily Levels Match Up Almost Perfectly with Fibonacci LevelsDG
Replay of DG's Price Movement & Volume -13 October 2023
Dollar General (DG) gapped up and was up 9.16% on the day. DG's volume was nearly 3 x's the amount it was over the last 2.5 weeks.
Daily Levels & Fibonacci Levels
*The .38 retracement level on the daily is in confluence with the 116 daily level on the chart. The .50 fibonacci retracement level aligns with the 120 daily level. Also, the .618 (the reversal fib retracement level), is in confluence with the 124.85 daily level. I like when I see levels line up nearly perfectly with fib retracement levels 😃

Countertrend then Continuation to upside after 2Day OrderBlock If you missed getting in short, here's a 2nd opportunity for a longer run. Speculating price will reject 0.86890 to take out SSL below at 0.86115 (2 Daily OB mitigation). Then this would be a great entry for long (swing trade).
If willing to participate on this short idea, suggestion is to do so at a reduced risk (lower lot size) on the shorting (0.86890) to the 2 Day OrderBlock mitigation. Then enter at a regular risk (whatever your risk appetite is) on the continuation long.

EURJPY "seems" ready to short from BSL/H4 OB mitigationAs price took out not only BSL and mitigated an H4 OB, I do speculate price to sell and find support at the D-OB below / 79% retracement fib level (157.200). There's some news event for JPY coming out Sunday at 7:50 EST to which I wonder if this will drive price down to support at 157.200

NFLX Monthly Chart... 5 trading days to go before the close of the month... which means this last bearish candle that broke the current uptrend can still reverse... let's wait and see.. but currently it is quite bearish... adding the doji that occurred at the .618 Fibonacci retracement level (in red), the RSI not even reaching 60 before reversing and the MACD histogram starting to break down.
Zoom out and NFLX is still on a major long term uptrend... even if the price would drop substantially.
