FILE COIN Buy/Long Signal (4H)Considering the bullish CH, the bearish candle being engulfed, and the formation of a CP move at the top of the chart, Filecoin may be preparing for a strong bullish move.
We have identified two entry points on the chart where you should enter the position using DCA.
The targets are marked on the chart, with the main target being the origin of the CP move.
Do not enter the position without capital management and stop setting
Comment if you have any questions
thank you
FILBTC

#FIL/USDT Ready for a Breakout? Analysis of a Long Accumulatio#FIL
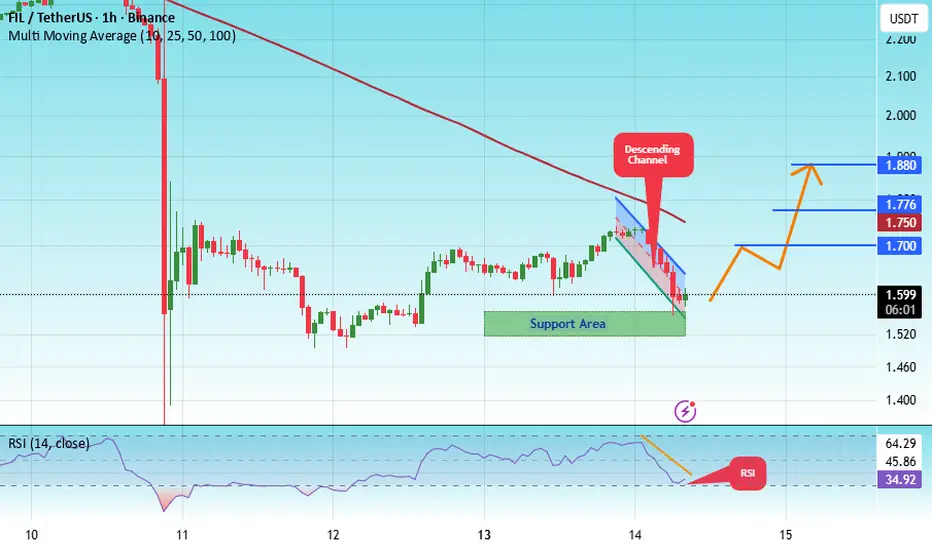
The price is moving within a descending channel on the 1-hour frame, adhering well to it, and is heading for a strong breakout and retest.
We have a bearish trend on the RSI indicator that is about to be broken and retested, which supports the upward breakout.
There is a major support area in green at 1.54, representing a strong support point.
We are heading for consolidation above the 100 moving average.
Entry price: 1.60
First target: 1.70
Second target: 1.77
Third target: 1.80
Don't forget a simple matter: capital management.
When you reach the first target, save some money and then change your stop-loss order to an entry order.
For inquiries, please leave a comment.
Thank you.
FILUSDT Forming Bullish MomentumFIL/USDT is showing strong signs of bullish momentum, and the fundamentals are lining up in a way that supports a potential sustained move. On-chain metrics suggest increasing protocol activity: Filecoin’s network utility is rising, Q3 2025 saw utilization tick up, and active storage demand from enterprise and verified data clients remains robust.
From a fundamental perspective, FIL is deeply tied to real-world data storage demand. The token is used to incentivize storage providers and acts as collateral in the network. Token issuance is gradual and tied to network milestones, supporting long-term alignment. Furthermore, recent protocol upgrades like Proof of Data Possession are improving trust and efficiency, which could drive more enterprise-level adoption.
Economically, there are meaningful supply-side tailwinds. The block reward schedule is designed to decline over time, and a portion of circulating FIL may become deflationary due to network sinks and locking mechanisms.) At the same time, more FIL is being locked by storage providers as collateral, which reduces active supply and supports token value.

#FIL/USDT Ready for a Breakout? Analysis of a Long Accumulatio#FIL
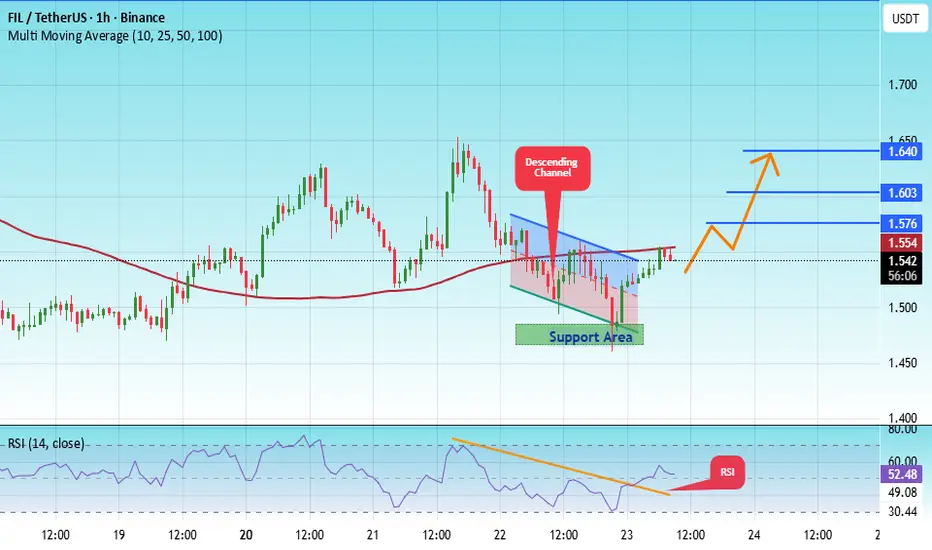
The price is moving within a descending channel on the 1-hour frame, adhering well to it, and is heading for a strong breakout and retest.
We have a bearish trend on the RSI indicator that is about to be broken and retested, which supports the upward breakout.
There is a major support area in green at 1.47, representing a strong support point.
We are heading for consolidation above the 100 moving average.
Entry price: 1.54.
First target: 1.57.
Second target: 1.60.
Third target: 1.64.
Don't forget a simple matter: capital management.
When you reach the first target, save some money and then change your stop-loss order to an entry order.
For inquiries, please leave a comment.
Thank you.
FILUSDT - Massive bullish patternIt broke the main trendline with a massive daily candle.
A Golden Cross pattern is forming — the 25 EMA is about to cross above the 50 EMA, as you can see.
The coin has been in accumulation for 276 days, initially breaking down to sweep liquidity, and now it’s trading back near that range.
If it breaks upward, it could easily rally 300% or more from here.
Best Regards:
Ceciliones🎯

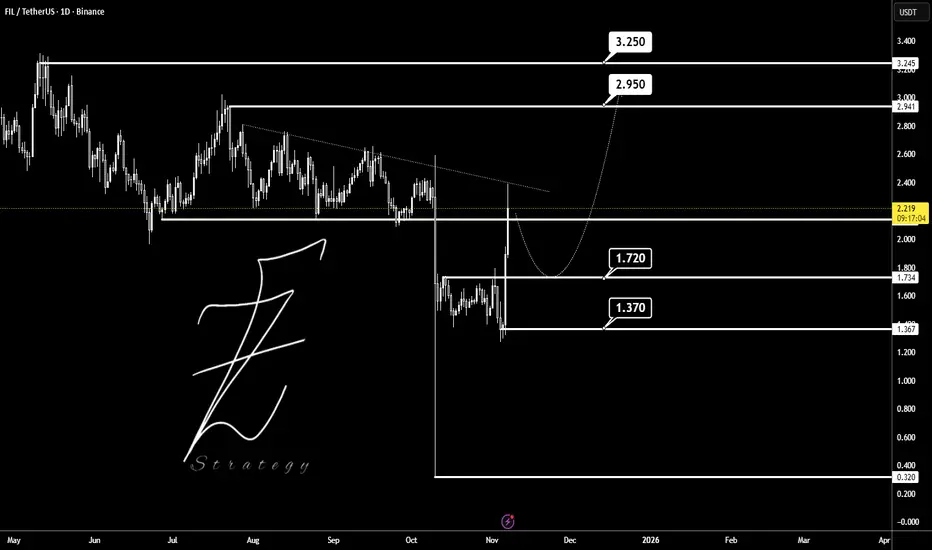
FILUSDTBINANCE:FILUSDT is now for breakout trendline but should pullback to 1.720$ and start up-trend to 3$.
FILUSDT Forming Falling WedgeFILUSDT is forming a clear falling wedge pattern, a classic bullish reversal signal that often indicates an upcoming breakout. The price has been consolidating within a narrowing range around $2.40 USDT, suggesting that selling pressure is weakening while buyers are beginning to regain control. With consistent volume confirming accumulation at lower levels, the setup hints at a potential bullish breakout soon. The projected move could lead to an impressive gain of 90% to 100%+ once the price breaks above the wedge resistance, drawing attention to FILUSDT price prediction in the decentralized storage sector.
This falling wedge pattern is typically seen at the end of downtrends or corrective phases, and it represents a potential shift in market sentiment from bearish to bullish. Traders closely watching FILUSDT are noting the strengthening momentum as it nears a breakout zone near $2.75. The good trading volume adds confidence to this pattern, showing that market participants are positioning early in anticipation of a reversal, especially with recent 67% daily surges signaling renewed interest.
Investors’ growing interest in FILUSDT reflects rising confidence in the project’s long-term fundamentals and current technical strength, particularly its role in powering scalable data storage for AI and DeFi applications. If the breakout confirms with sustained volume, this could mark the start of a fresh bullish leg. Traders might find this a valuable setup for medium-term gains, especially as the wedge pattern completes and buying momentum accelerates in falling wedge breakout crypto opportunities.
✅ Show your support by hitting the like button and ✅ Leaving a comment below! (What is You opinion about this Coin) Your feedback and engagement keep me inspired to share more insightful market analysis with you!

FILUSDTBINANCE:FILUSDT is deep corrections from latest bull-trend.
Bets support's in 1.90 to 2.150 $ and resistance's 2.50 and 2.80 $.
Please control risk management.


Spot signalHello friends
As the price reaches the specified support level and buyers enter, you can see that higher ceilings have formed and you can take advantage of this opportunity and now buy with capital and risk management and move towards the specified goals.
*Trade safely with us*

FILUSDTFIL is showing signs of a potential trend reversal 📊
Price has formed a higher low and is now approaching the key resistance at 2.485 USDT. A breakout above this level could open the way toward the next major zones around 2.887 and even 3.189 USDT 🚀
However, if rejection occurs, we might see a pullback toward the 2.272 USDT support area 🔁
Currently, momentum is leaning bullish and favoring a move higher, especially if the descending trendline gets broken with strength 💪

FIL bull-pollbakThe Filecoin ( BINANCE:FILUSDT ) chart, after a correction to $2.65, is attempting to pull back to the broken level around $2.77. If it fails to break this resistance, another decline towards support levels at $2.525 and then $2.39 is likely, which could act as a potential starting point for a new upward movement towards targets at $3.02 and $3.30.
🔑 Key Zones on the FIL Chart:
Primary Resistance: $2.77 (Pullback to broken level)
First Support: $2.525
Second Support: $2.39
First Bullish Target: $3.02
Second Bullish Target: $3.30

#FILUSDT - bottomed out!On the weekly timeframe, the downward trendline has been broken and successfully retested.
A strong move upward is just a matter of time…
Notice how it bounces hard every time it touches the support zone marked by the grey rectangle — this has happened three times in a row.
Also, FIL has been in an accumulation phase for around 1,092 days — that’s nearly 3 years.
$28 is a target I'm fully confident in for this coin.
Best Regards Cecilion🎯

#FIL/USDT#FIL
The price is moving within a descending channel on the 1-hour frame and is expected to break and continue upward.
We have a trend to stabilize above the 100 moving average once again.
We have a downtrend on the RSI indicator that supports the upward move with a breakout.
We have a support area at the lower limit of the channel at 2.60, which acts as strong support from which the price can rebound.
Entry price: 2.64
First target: 2.72
Second target: 2.78
Third target: 2.87

#FIL/USDT#FIL
The price is moving within a descending channel on the 1-hour frame, adhering well to it, and is heading towards a strong breakout and retest.
We are seeing a bounce from the lower boundary of the descending channel, which is support at 2.68.
We have a downtrend on the RSI indicator that is about to be broken and retested, which supports the upward trend.
We are looking for stability above the 100 moving average.
Entry price: 2.73
First target: 2.78
Second target: 2.86
Third target: 2.95

FILUSDT - Buy now or regret later!FIL is literally one of the hidden gems in the market.
The probability of a strong rebound is increasing significantly in the coming days. The coin has reached its strongest support level, a key historical reversal point.
Investing in it now is a golden opportunity, with a target of $27.
The bottoms have already formed across many altcoins—now is the best time to buy
Best regards Ceciliones🎯

Filecoin Dips 8% Amidst Proof of Data Possession (PDP) LaunchThe Filecoin ecosystem is at a pivotal moment, balancing technological innovation with market volatility. Amidst a broader downturn in the crypto market, including Bitcoin’s slide, Filecoin ( LSE:FIL ) has experienced an 8% decline. However, beneath the price dip lies a significant fundamental development—the introduction of Proof of Data Possession (PDP), a breakthrough mechanism enhancing data accessibility and storage security.
PDP and Fast Finality (F3) Reshape Filecoin’s Future
The Filecoin ecosystem is making strides with the introduction of Proof of Data Possession (PDP), which complements the existing Proof of Replication (PoRep). PDP enables efficient, periodic verification of stored data without the need for resource-intensive decoding. This advancement is particularly beneficial for hot storage solutions like Storacha and Akave, the first adopters of PDP.
The PDP rollout follows a structured timeline:
- February 2025: Final contract optimizations, Curio-PDP pipeline development, and integration with Storacha.
- March 2025: External audit, PDP explorer launch, and monitoring of storage provider performance.
- End of March 2025: PDP goes live on Filecoin Mainnet, marking a major milestone in decentralized storage security.
Fast Finality (F3) Accelerates with New Activation Mechanism
Filecoin’s Fast Finality (F3) mechanism, originally requiring two network upgrades, now features a delegated authority mechanism for quicker activation. This smart contract-based approach allows the Filecoin implementation teams to set key F3 parameters on-chain, reducing delays while maintaining security and transparency. With faster finalization, Filecoin enhances network usability, making storage transactions more efficient. The F3 contract is live and open for community review.
FIP-00XX: Per-Sector Fee Proposal to Improve Economic Sustainability
A new proposal, FIP-00XX, aims to replace the batch balancer fee with a per-sector fee, optimizing Filecoin’s economic model. This change encourages sector batching and proof aggregation, reducing gas costs for Storage Providers (SPs) while improving scalability. The proposal eliminates outdated gas-limited constraints, allowing the protocol to evolve with fewer bottlenecks.
Technical Outlook: Is a Bullish Reversal in Sight?
As of writing, LSE:FIL is down 7.92%, trading within a bearish pattern. However, the token appears oversold, with the Relative Strength Index (RSI) at 32.54, suggesting an impending trend reversal. Historically, RSI levels below 35 have signaled buying opportunities, hinting at a potential shift in momentum.
Support and Resistance Levels
- Support: The 1-month low pivot is currently acting as a temporary support for $FIL. If the price holds above this level, we could see a rebound; however, a break below could trigger further downside.
- Resistance: The 38.2% Fibonacci retracement level at $4.70 is acting as a strong resistance. A breakout above this point could send LSE:FIL into a bullish phase, with $15 as a long-term target.
Furthermore, LSE:FIL is currently trading below key moving averages (MAs), further reinforcing its oversold nature. A decisive move above the 50-day MA would strengthen the bullish case, attracting traders looking for a reversal.
Conclusion
While LSE:FIL faces short-term bearish pressure, its technical indicators and fundamental developments suggest an optimistic long-term outlook. The launch of PDP and F3 advancements could boost adoption, reinforcing Filecoin’s role in decentralized storage. Traders should watch for a breakout above $4.70, which could pave the way for a strong recovery.
The question remains—will LSE:FIL capitalize on its technological progress and defy market weakness? Only time will tell, but the foundations for a strong comeback are certainly in place.

FIL short-down FILUSDT Signal
🔹 Key Resistance Level: $3.35 – $3.50
🔹 Important Support Levels: $3.148 – $2.940 – $2.738
Analysis:
FIL price has been moving in an uptrend within a rising wedge pattern and has now reached the key resistance zone of $3.35 – $3.50. If this level is broken, followed by confirmation with a pullback, the uptrend is likely to continue. However, failure to break this resistance could lead to a price correction toward the mentioned support levels.
📌 Trading Strategy:
✅ Sell Entry after breaking the uptrend and confirming below $3.148
🎯 Targets: $2.940 – $2.738
🛑 Stop Loss: $3.30
⚠ Important Note: Risk management should not be ignored!

#FIL/USDT#FIL
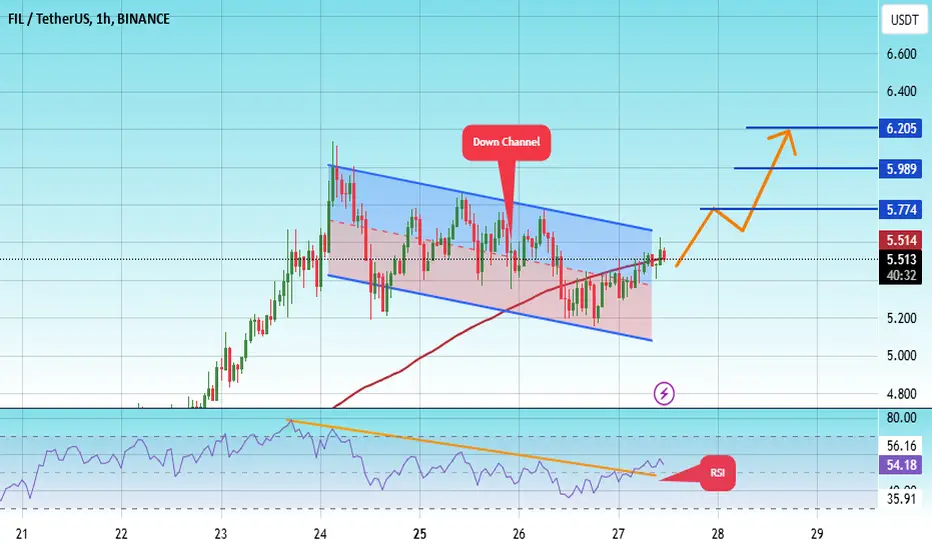
The price is moving in a descending channel on the 1-hour frame and is expected to continue upwards
We have a trend to stabilize above the moving average 100 again
We have a descending trend on the RSI indicator that supports the rise by breaking it upwards
We have a support area at the lower limit of the channel at a price of 5.80
Entry price 6.02
First target 6.15
Second target 6.34
Third target 6.60

#FIL/USDT Ready to go higher#FIL
The price is moving in a descending channel on the 1-hour frame and sticking to it well
We have a bounce from the lower limit of the descending channel, this support is at 4.70
We have a downtrend on the RSI indicator that is about to be broken, which supports the rise
We have a trend to stabilize above the moving average 100
Entry price 4.87
First target 5.22
Second target 5.49
Third target 5.82

#FIL/USDT Ready to go higher#FIL
The price is moving in a descending channel on the 1-hour frame and sticking to it well
We have a bounce from the lower limit of the descending channel, this support is at 5.80
We have a downtrend on the RSI indicator that is about to be broken, which supports the rise
We have a trend to stabilize above the moving average 100
Entry price 6.81
First target 7.20
Second target 7.84
Third target 8.40

#FIL/USDT Ready to take off upwards#FIL
The price is moving in a descending channel on the 1-hour frame and sticking to it well
We have a bounce from the lower limit of the descending channel, this support is at 5.20
We have a downtrend on the RSI indicator that is about to break, which supports the rise
We have a trend to stabilize above the moving average 100
Entry price 5.50
First target 5.55
Second target 5.99
Third target 6.20
Under SupervisionHello friends
This good currency, which has good news on the way, is one of the best in its field.
Now, being in a long-term channel, it has started a significant movement from the bottom of the channel, which we have to see if it can succeed in breaking it.
We have identified its targets for you.
Don't forget capital management, friends.
Be successful and profitable.
