FILE COIN Buy/Long Signal (4H)Considering the bullish CH, the bearish candle being engulfed, and the formation of a CP move at the top of the chart, Filecoin may be preparing for a strong bullish move.
We have identified two entry points on the chart where you should enter the position using DCA.
The targets are marked on the chart, with the main target being the origin of the CP move.
Do not enter the position without capital management and stop setting
Comment if you have any questions
thank you
FILUSD

FIL/USDT Road to $6.50FIL is showing some early bullish signs for a potential reversal setup on the 4H timeframe. Price action suggests we are currently in the accumulation phase of a Cup & Handle formation.
I'm expecting a an exact mirror move where price will move almost identical to the previous swing low. Afterwards, if market momentum is stable enough price can charge upwards to the marked targets.
This trade setup could be had for both Intra-day and Swing traders. Depending on your goals and risk management.
Good Luck!

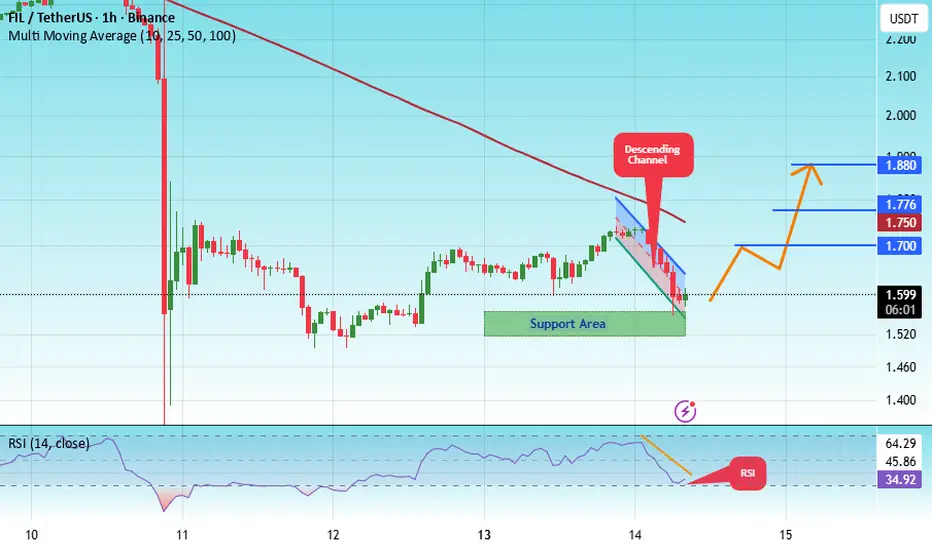
#FIL/USDT Ready for a Breakout? Analysis of a Long Accumulatio#FIL
The price is moving within a descending channel on the 1-hour frame, adhering well to it, and is heading for a strong breakout and retest.
We have a bearish trend on the RSI indicator that is about to be broken and retested, which supports the upward breakout.
There is a major support area in green at 1.54, representing a strong support point.
We are heading for consolidation above the 100 moving average.
Entry price: 1.60
First target: 1.70
Second target: 1.77
Third target: 1.80
Don't forget a simple matter: capital management.
When you reach the first target, save some money and then change your stop-loss order to an entry order.
For inquiries, please leave a comment.
Thank you.
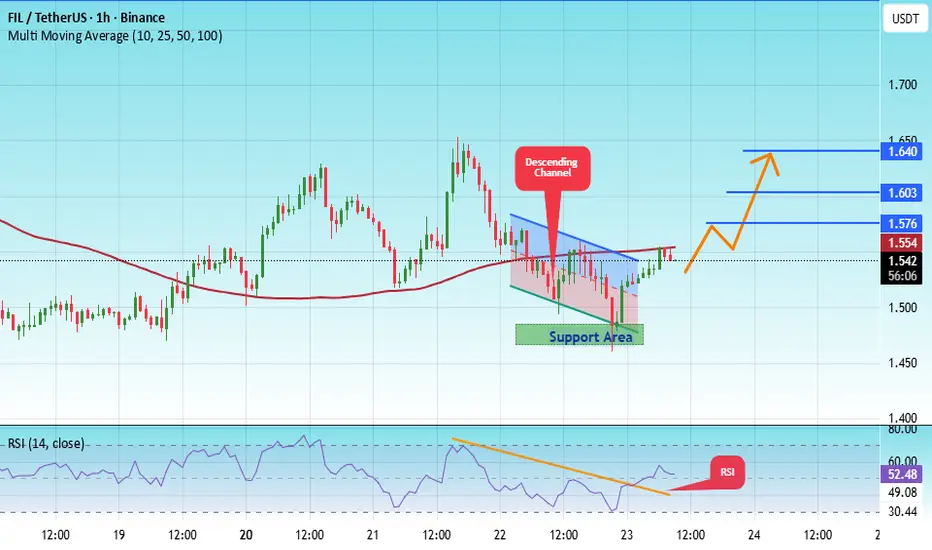
#FIL/USDT Ready for a Breakout? Analysis of a Long Accumulatio#FIL
The price is moving within a descending channel on the 1-hour frame, adhering well to it, and is heading for a strong breakout and retest.
We have a bearish trend on the RSI indicator that is about to be broken and retested, which supports the upward breakout.
There is a major support area in green at 1.47, representing a strong support point.
We are heading for consolidation above the 100 moving average.
Entry price: 1.54.
First target: 1.57.
Second target: 1.60.
Third target: 1.64.
Don't forget a simple matter: capital management.
When you reach the first target, save some money and then change your stop-loss order to an entry order.
For inquiries, please leave a comment.
Thank you.
FILUSDT - Massive bullish patternIt broke the main trendline with a massive daily candle.
A Golden Cross pattern is forming — the 25 EMA is about to cross above the 50 EMA, as you can see.
The coin has been in accumulation for 276 days, initially breaking down to sweep liquidity, and now it’s trading back near that range.
If it breaks upward, it could easily rally 300% or more from here.
Best Regards:
Ceciliones🎯

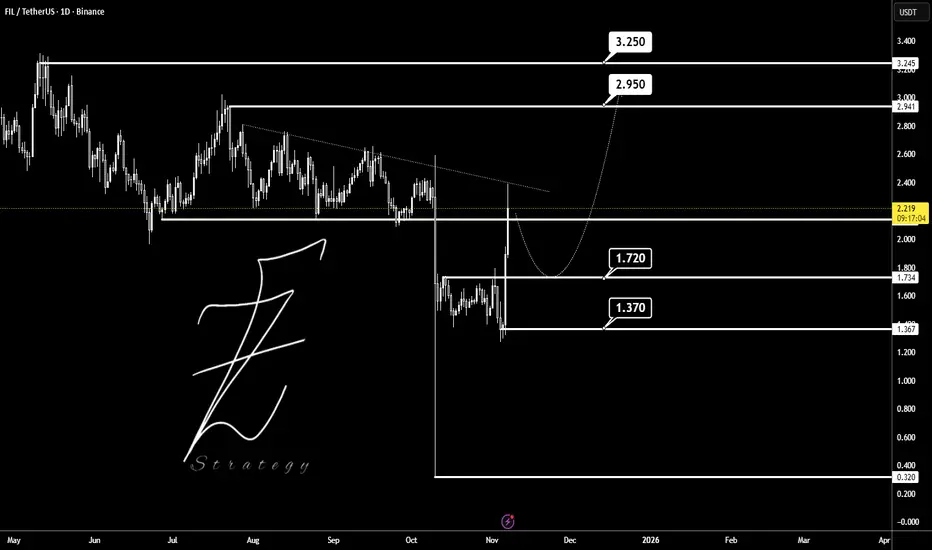
FILUSDTBINANCE:FILUSDT is now for breakout trendline but should pullback to 1.720$ and start up-trend to 3$.
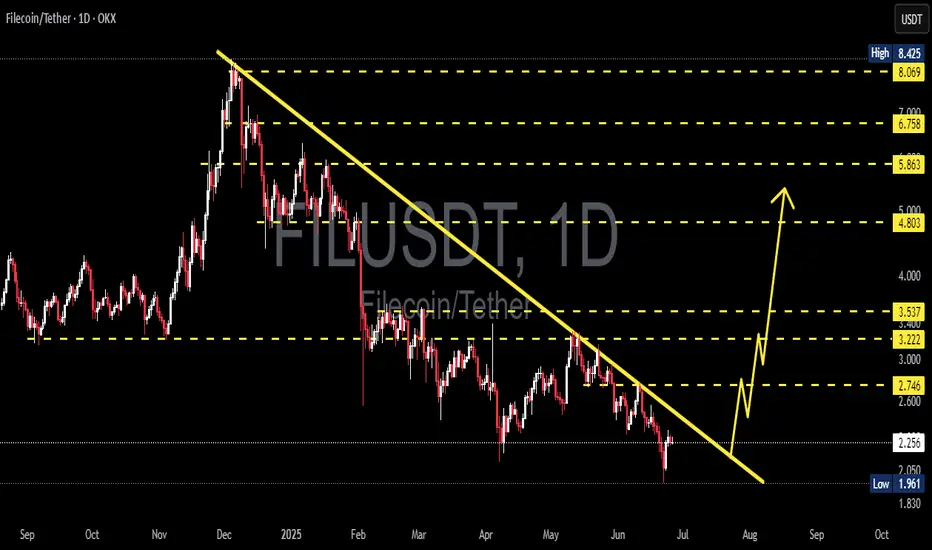
Filecoin: Ready for a Breakout? Analysis of a Long AccumulationFilecoin has been consolidating around its all-time lows for about two years now, marking a very long accumulation period that, in my opinion, will lead to an inevitable upward explosion once the main resistances are broken. At this moment, the first thing the price should do is break the trendline that has been suppressing it since the beginning of the year. Once this is broken and the price consolidates above $3, it should move toward $8, which is the last significant resistance where a reversal occurred. Once that resistance is broken, the bull market for FIL will truly begin. Given the project's fundamentals, I believe it is absolutely the most undervalued coin. Thank you all for your attention.

Filecoin - Still in accumulationHello everyone, as you know if you follow me, one of the coins I’ve been accumulating for years is FIL. From both a technical and fundamental analysis perspective, I believe it’s the bet with the absolute highest potential in the crypto world. Speaking of my analysis, as you can see, we’re still in an accumulation phase for about 2-3 years now, with a range between $2.3 and $7-10. In recent weeks, we’ve seen a retest of the all-time low, and right now it’s testing the lowest monthly close of the previous cycle. That said, I expect a fairly rapid rise toward $7 soon, with the possibility that it finally breaks out of the range and starts running toward the previous ATH at $230. In any case, the risk/reward is truly excellent, probably the best in the entire crypto market. Thanks to everyone for your attention, and I hope the video is helpful for your analyses.

FILECOIN -The accumulation is almost overMy favorite coin right now is FIL, for several reasons, the first is that the risk reward in this case is really exceptional considering the historical support very close and the last important point where the course has been reversed to about a 50X from here, the second fundamental factor is Grayscale which has not one but two funds dedicated to FIL, the first is a single-asset fund and the second has just been created and is called Decentralized AI Fund where Filecoin is the most important holding (more than 30%). That said, we have a coin with incredible potential that is great from both a technical analysis and fundamental analysis perspective

FIL can touch 1$ in the coming weeksFIL / USDT
The price just brokedown the Huge trading range (2022-2025) on weekly chart and price still find difficulty to restore the broken support
Our view for this coin in mid term is bearish and few weeks we can see FIL hits 1$ 📉
This is my macro view for FILUSD as long as price doesn’t reclaim the support with strong volume
Best of wishes

$FIL bull pennant to $3.00?Seeing this bull pennant form. Really would love to see this one run and break out of some HTF resistance zones.
Long time in weekly chart, target 2.88, RR:2.53Following FIL in weekly chart,
I got a long signal from my power indicator which I belive will lead us to next resistance level. Also this resistance level intersects with one of my key level.
I think it's a good time to jump on the wave.
RR: 2.53
TP : 2.88
SL : I'd stop under 2.52 wekkly candles.
Your thoughts?

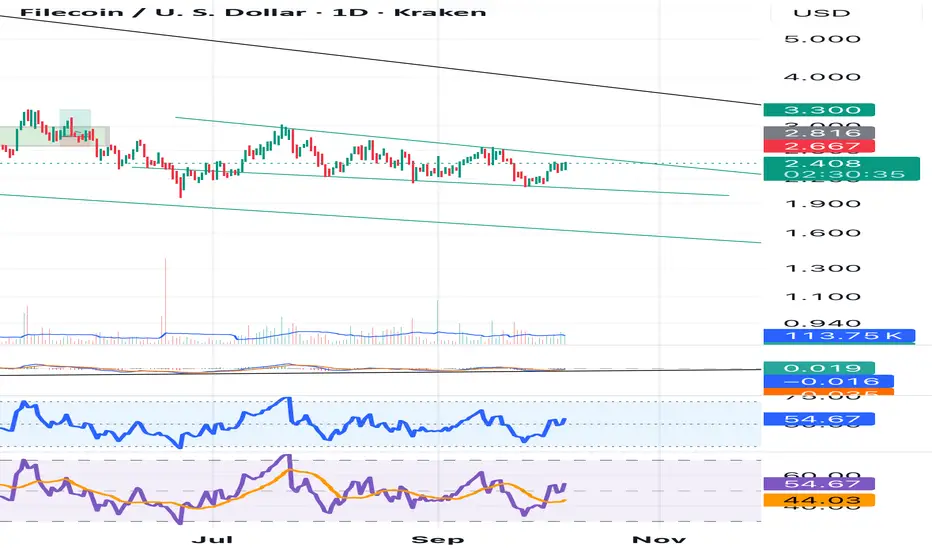
FIL/USDT — Bearish Continuation vs Potential Reversal?Currently, Filecoin (FIL) is trading at a critical decision point on the daily timeframe. The chart shows a clear descending triangle pattern, formed by a downtrend resistance line and a horizontal support zone around $1.96 – $2.28.
This pattern is typically seen as a bearish continuation, but it can also trigger a strong reversal breakout if price breaks above resistance with significant volume. In short, the market is now at a make-or-break zone — either a breakdown to new lows or a bullish breakout that could spark a strong rally.
---
🔎 Pattern Details & Key Levels
Pattern: Descending Triangle (lower highs + flat support)
Major Support Zone: $1.96 – $2.28 (strong demand zone, price has bounced multiple times)
Dynamic Resistance: descending trendline pressing since early 2025
Static Resistance Levels: $2.737 – $3.094 – $3.537 – $4.832
Psychological Levels above: $6.0 – $8.0
Measured Move Targets (triangle height):
Upside breakout = ≈ $3.51
Downside breakdown = ≈ $1.19
---
✅ Bullish Scenario
Trigger: Daily close above the descending trendline + confirmed breakout above $2.737 with strong volume.
Additional confirmation: Successful retest of trendline / $2.737 as new support.
Targets:
Short-term: $3.09
Primary measured move: $3.51
Extended targets: $3.53 – $4.83 (if momentum continues)
Upside potential: From $2.28 → $3.51 = +53.6%
---
❌ Bearish Scenario
Trigger: Daily close below $1.964 with convincing volume.
Additional confirmation: Failed retest of $1.96 as resistance.
Targets:
Primary measured move: ≈ $1.19
Psychological area: $1.00 (potential liquidity zone)
Downside risk: From $2.28 → $1.19 = -47.8%
---
📌 Conclusion
FIL/USDT is at a major crossroad.
Holding the $1.96–$2.28 support + breakout above the trendline opens the door to $3.51 and potentially $4.83.
Losing this support would confirm a bearish breakdown towards $1.19.
Best approach: Wait for daily close + volume confirmation to avoid false breakouts/breakdowns.
⚠️ Disclaimer: This analysis is for educational purposes only, not financial advice. Always apply proper risk management.
---
> FIL/USDT is now testing a decision zone with a descending triangle pattern on the daily chart.
Bullish case: Breakout above $2.737 → targets $3.09 to $3.51
Bearish case: Breakdown below $1.964 → target $1.19
$1.96 – $2.28 remains the critical support — either the last defense before a deeper drop, or the launchpad for the next rally.
🚨 Watch for daily close & volume to confirm the move!
#FIL #FILUSDT #Filecoin #Crypto #TechnicalAnalysis #DescendingTriangle #SupportResistance #Breakout #BearishScenario #BullishScenario #CryptoTrading

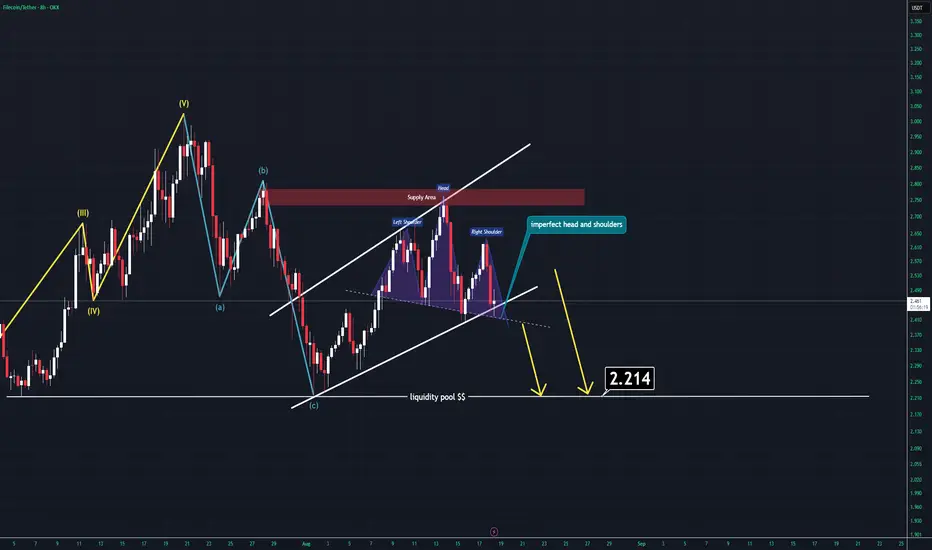
FIL ANALYSIS (8H)After hitting a major supply line, FIL has entered a corrective wave.
Similar to the other setups I shared earlier today, this one is showing very comparable price action. Currently, FIL is trading below all key moving averages (such as the 200 SMA and 50 EMA).
On top of that, an imperfect head and shoulders formation is in play. With the recent breakout, it seems likely that FIL will attempt to grab the lower liquidity pool, which sits around $2.2.
Thanks for reading.
FILUSDTBINANCE:FILUSDT is deep corrections from latest bull-trend.
Bets support's in 1.90 to 2.150 $ and resistance's 2.50 and 2.80 $.
Please control risk management.

FIL Secondary trend. Channel zone. 31 03 2025Logarithm. Time frame 3 days (less is not needed).
Main trend. Time frame 1 week.
Published more than 2 years ago 22 01 2023
FIL/USD Main trend. From the maximum of $237 -99%
In the specified range, a horizontal channel with a large % step (exactly 370%) was formed earlier (2.590 - 7.157/10.7). There have already been 3 pumping waves in this channel. From the pumping highs in the main trend, the price fell by -98.98%
Secondary trend . This horizontal channel with a step of 370% and work with trend reversal formations.
Local trend , zone of formation of a descending wedge, zone of capitulation and trend reversal.
FIL/USDT Local trend. Wedge. Price clamping . 30 06 2024
Working now with the forming descending wedge and trend reversal in case of its breakthrough.


Filecoin FIL price analysis🪙 It would seem that #Filecoin is a “dinosaur” of the crypto market, having survived so many different cycles and “shocks,” whose fundamentals should only increase the annual application of the project, but no... it's not happening...
Looking at the OKX:FILUSDT chart, we see that the accumulation phase in the $2-11.50 range has been going on for over 1150 days, which means that another +/- 30-60 days of correction will not make a significant difference.
What can we say: we wish the holders patience and hope they wait for their moment of glory together with #FIL
🙂 And for those who want to test their luck and try to jump on the “last train” — place a “bucket” at $1.80 (any lower than that would be indecent)
Of course, if you believe that the price of #FILUSD will still be able to grow to at least $4.50 this year, and ideally to $11.50.
_____________________
Did you like our analysis? Leave a comment, like, and follow to get more

FIL/USDT 1W$5.48 is an almost guaranteed target — it has been reached every single time.
What happens next depends entirely on the strength of the trend.
If we break out above the triangle and hold above it, there’s a real shot at $20.
And if that level gets broken and confirmed — then we might even see a retest of previous ATH.
But those are already "moon targets", and by that point, it’ll be smart to secure profits and just let the rest ride — and see what happens. 🚀

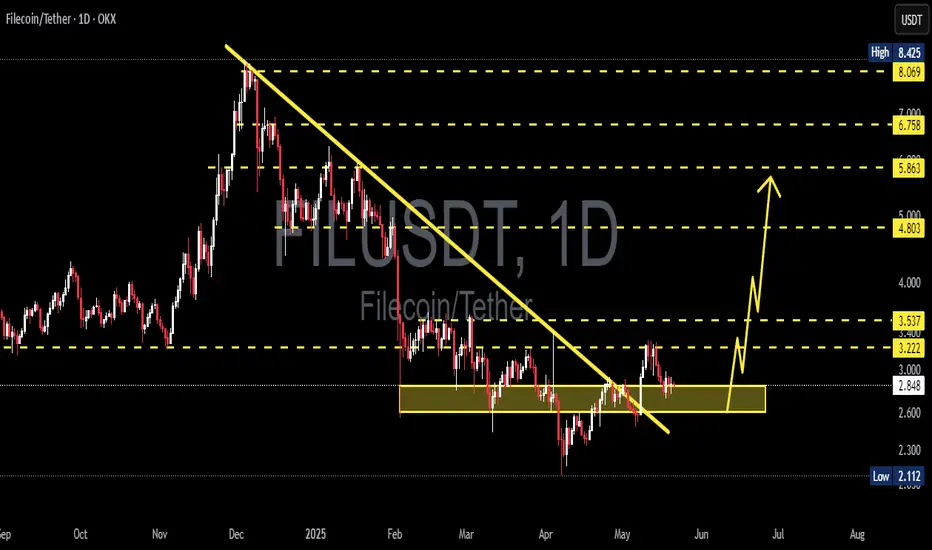
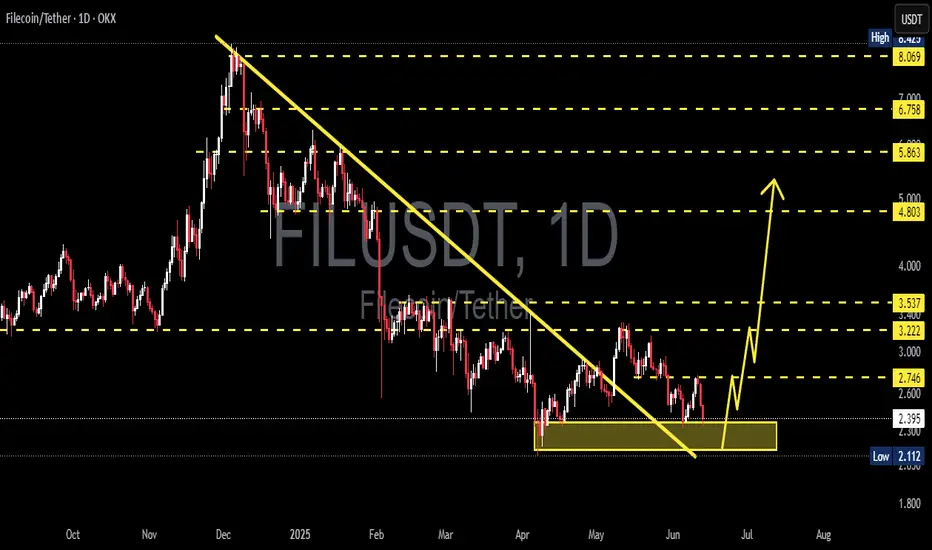
FIL/USDT – Major Trendline Breakout Imminent?The FIL/USDT chart is showcasing a significant descending trendline that has been respected since its peak in late December 2024. Price action has recently approached this trendline again, and a potential breakout scenario is forming. This setup may signal a major shift in trend after months of persistent decline.
🔍 Technical Analysis:
Trendline Resistance:
The long-term descending yellow trendline has capped every bullish rally since early 2025. A breakout above this trendline would be a major bullish technical signal.
Support Level:
Key horizontal support has been held at around $1.96, which has formed a strong base.
Potential Breakout Projection:
Upon breakout, $2.746 is the first resistance to watch.
A successful retest of this level could lead to a stair-step rally targeting:
$3.222
$3.537
$4.803
$5.863
$6.758
And potentially $8.069–$8.425 if momentum continues.
Bullish Pattern:
The projected move shows a potential impulse wave pattern following the breakout, indicating staged profit-taking zones for traders.
🧠 Strategic Consideration:
A daily candle close above the trendline with volume confirmation would be the first sign of trend reversal.
Conservative traders may wait for a retest of the trendline as support before entering.
Targets can be approached progressively based on price action near each resistance level.
⚠️ Risk Management:
Watch for fakeouts near the trendline.
A break below the key support of $1.96 would invalidate the bullish thesis.
FILUSDT 1D AnalysisFIL ~ 1D Analysis
#FIL This is the lowest support for now. Buy if you still have confidence in this coin with a short term target of at least 20%+ from this support.
Spot signalHello friends
As the price reaches the specified support level and buyers enter, you can see that higher ceilings have formed and you can take advantage of this opportunity and now buy with capital and risk management and move towards the specified goals.
*Trade safely with us*

FILUSDT 1D Analysis FIL ~ 1D Analysis
#FIL Buy gradually from here if you still have confidence in this coin with a short term target of at least 15%+ from here.