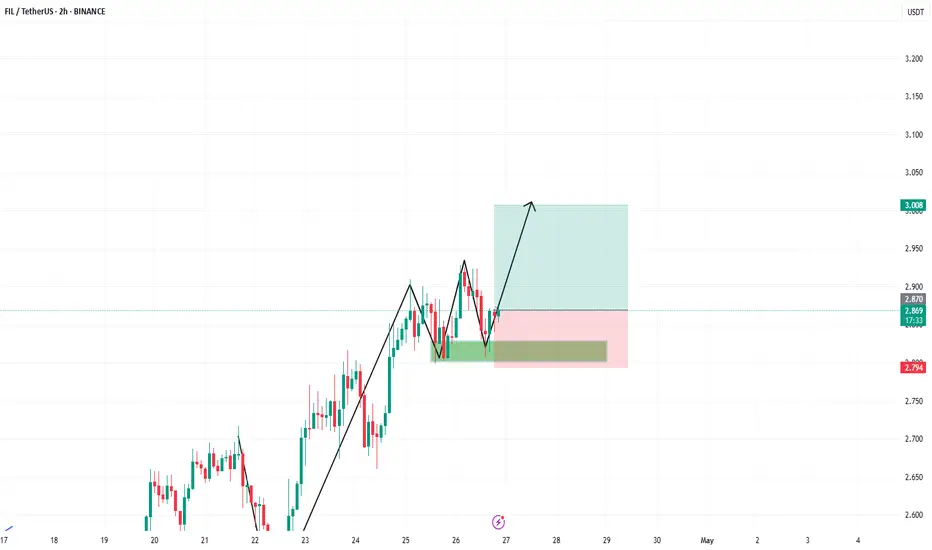
FILUSDT: Bullish Push to 1.700?BINANCE:FILUSDT.P is eyeing a bullish breakout on the 4-hour chart , with price rebounding from the downward trendline and support zone, converging with a potential entry area that could ignite upside momentum if buyers break resistance amid recent consolidation. This setup suggests a reversal opportunity after the downtrend, targeting higher levels with strong risk-reward .🔥
Entry between 1.243–1.287 for a long position. Target at 1.700. Set a stop loss at 1.221, yielding a risk-reward ratio of approximately 1:10 . Monitor for confirmation via a bullish candle close above entry with rising volume, leveraging the pair's momentum post-rebound.🌟
📝 Trade Setup
🎯 Entry (Long):
1.243 – 1.287
🎯 Target:
• 1.700
❌ Stop Loss:
• 1.221
⚖️ Risk-to-Reward:
• ~ 1:6+ (very aggressive)
⚠️ Risk Notes (Very Important)
This setup carries elevated risk due to:
• FIL’s historically high volatility
• Broader altcoin market sensitivity to BTC moves
• Thin liquidity compared to majors
✅ Consider:
• Reduced position size
• Partial profits on the way up
• No over-leverage
• Strict respect of the stop loss
💡 Your view?
Is FILUSDT forming a genuine base for a breakout toward 1.70 — or just another lower-high before continuation down? 👇
Filusdtanalysis

FIL/USDT — Brutal Rejection or the Beginning of Major Reversal?FIL/USDT is entering one of the most critical decision zones of the entire 2025 structure. After spending months inside a clean, well-defined downtrend (yellow trendline), FIL attempted a breakout — only to be met with a violent wick rejection, signaling heavy supply waiting above.
Price has now fallen back into the Golden Retracement zone (0.5–0.618 Fibonacci) — a region that often determines whether a market forms a true reversal or continues its larger downtrend. What happens here is pivotal.
---
🔶 Key Structure & Pattern Insights
1. Long-Term Downtrend Still in Control
Clear formation of lower highs and lower lows visible since early 2025.
The yellow descending trendline has acted as major resistance for almost the entire year.
2. False Breakout (Wick Rejection)
FIL broke above the trendline but failed to close above it.
This usually indicates upside liquidity grab, not a confirmed reversal.
3. Price Returns to the Critical Fibonacci Zone
0.5 = 2.155
0.618 = 1.968
A textbook retest region where major directional decisions often occur.
4. Layered Resistance Levels Above
If FIL stabilizes, these become the upside checkpoints:
2.65 → key confirmation level
3.27 → first major resistance
4.875 / 6.07 / 7.88 → structural targets if a full reversal unfolds
---
🟢 Bullish Scenario (True Reversal Potential)
Bullish bias becomes valid ONLY if:
✔ Price holds above 2.15–1.97 and forms a higher low
✔ A 2D/weekly close occurs above 2.65
If both conditions are met → the trend reversal becomes official.
Bullish targets:
3.27 – first major confirmation
4.875 – upside continuation
6.07 – mid-term target
7.88 – high zone that may trigger market FOMO
Additional Bullish signals:
Volume expansion on the 2.65 breakout
Clean retest of the Fibonacci zone
Strong-bodied candles instead of wick-driven spikes
---
🔴 Bearish Scenario (False Breakout Confirmed)
Bearish continuation strengthens if:
❌ Price breaks & closes below 1.97 (0.618 Fib)
If this happens → the previous breakout is fully confirmed as a false break, and the downtrend resumes.
Downside targets:
1.70–1.50 → major structural support
Breakdown below this region could send FIL to deeper lows
Additional Bearish signals:
Strong rejection near 2.15–2.20
Increasing sell volume
Weak reaction every time price retests the trendline
---
🎯 Key Takeaways
FIL is currently sitting at a major reversal zone or a continuation breakdown point.
📌 2.15–1.97 is the main battlefield
📌 Closing above 2.65 = multi-week bullish potential
📌 Losing 1.97 = downtrend continuation
📌 Watch 2D and weekly closes very closely
This is a decision zone — not a place for FOMO, but a place for precision and disciplined planning.
---
#FIL #FILUSDT #Filecoin #CryptoAnalysis #TechnicalAnalysis #TrendReversal #Fibonacci #Breakout #Rejection #CryptoTrading

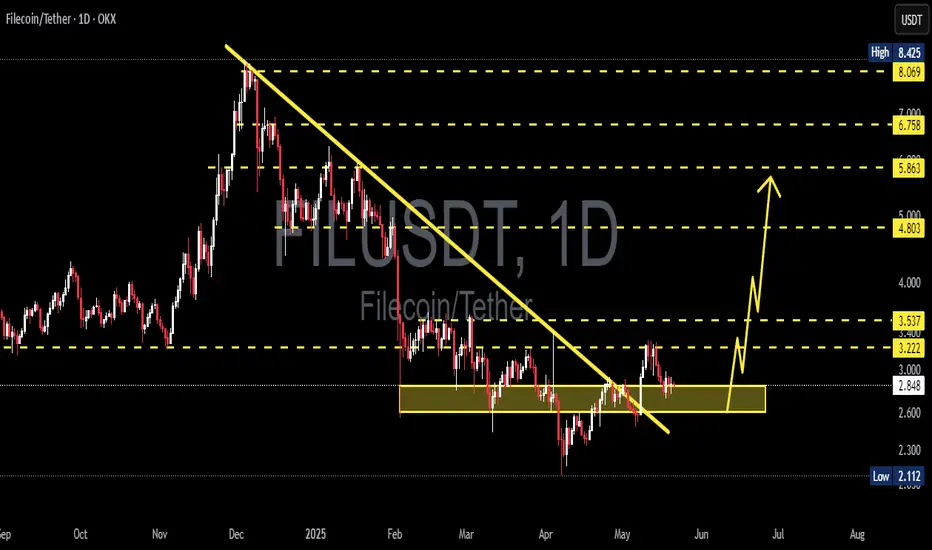
FIL/USDT — The Big Test: Real Breakout or Just Another Trap?After months of being trapped under a strong descending trendline, Filecoin (FIL) is finally showing signs of awakening. A strong bullish candle on the 2D timeframe has pierced through the long-term downtrend line — but the question remains: is this the beginning of a true reversal, or just a fake breakout before another drop?
---
🔹 Overview
Current price around $2.24, testing the descending trendline (yellow).
Key resistance levels: $2.65 → $3.27 → $4.875 → $6.07 → $7.88 (High $8.42).
Major support zones sit at $1.25–$1.50, with psychological support near $1.05.
---
🔸 Technical Pattern Analysis
The chart shows a prolonged accumulation phase beneath a descending trendline — a typical setup before a major directional shift.
The latest breakout candle signals possible momentum change, yet the market hasn’t given full confirmation.
If the next 2D close holds above the trendline and the $2.65 level, that would strongly suggest the end of the long-term downtrend, opening the door for a new bullish expansion phase.
---
🚀 Bullish Scenario
Confirmation Signs:
2D close above $2.65 with strong volume and a clean retest.
RSI and MACD showing momentum shift to the buyers.
Upside Targets:
First target: $3.27 (initial breakout zone).
Next targets: $4.875 → $6.07 → $7.88, if momentum continues.
Strategy:
Conservative entry after retest on trendline / $2.65.
Stop loss below $1.95.
Risk-to-Reward: 2:1 up to 3:1 if breakout holds.
Bullish Narrative:
“If the retest holds, FIL could be entering a new accumulation breakout phase — signaling the end of the long-term downtrend and the start of a mid-term rally toward $4–6.”
---
⚠️ Bearish Scenario
Conditions:
Failure to close above the trendline and fall back below $2.00–$2.20.
Rising sell volume confirming a false breakout or bull trap.
Implications:
Price could revisit the consolidation range $1.50–$1.25,
or even drop to $1.05 if bearish momentum strengthens.
Strategy:
Short entries only on clear rejection candles (strong red 2D + high volume).
Downside targets: $1.50 → $1.25, Stop Loss above $2.65.
Bearish Narrative:
“A failed breakout would indicate the market isn’t ready for a trend reversal — FIL may return to deeper consolidation before any sustainable move up.”
---
🔍 Key Takeaways
Breakout vs Breakdown — the chart is at a critical crossroads.
2D close above $2.65 = bullish confirmation.
Rejection from the trendline = potential for another false rally and continuation of the downtrend.
Momentum suggests something big is approaching — patience and confirmation are key.
---
🧭 Conclusion
The FIL/USDT chart currently represents a classic battle between bulls and bears.
A breakout of a long-term descending trendline doesn’t happen often — and its confirmation will decide the direction for months ahead.
If buyers manage to hold above the breakout level and print a new higher high, FIL could enter a significant recovery phase.
But if momentum fades and sellers regain control, the correction may deepen before any true reversal.
#FIL #FILUSDT #Filecoin #CryptoAnalysis #BreakoutWatch #TrendlineBreak #CryptoTrading #AltcoinAnalysis #TechnicalAnalysis

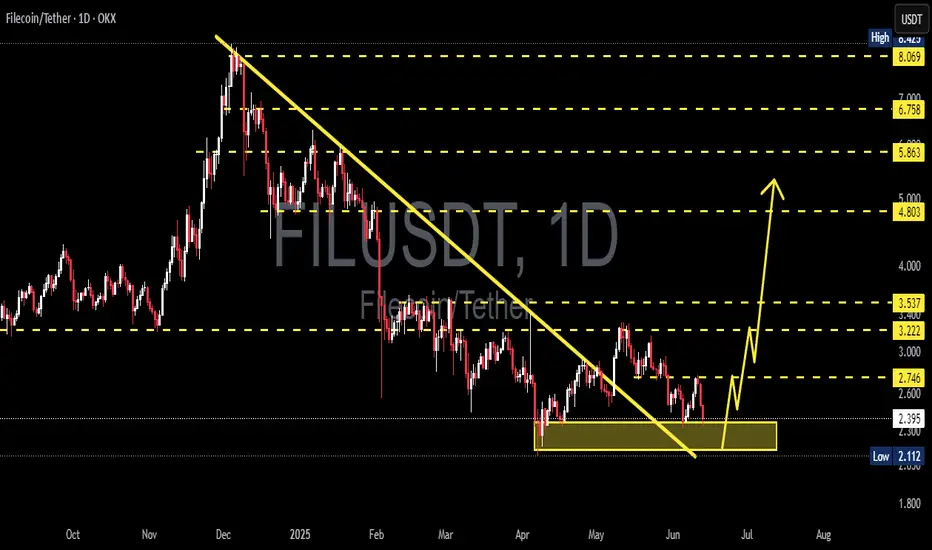
FIL/USDT — Bearish Continuation vs Potential Reversal?Currently, Filecoin (FIL) is trading at a critical decision point on the daily timeframe. The chart shows a clear descending triangle pattern, formed by a downtrend resistance line and a horizontal support zone around $1.96 – $2.28.
This pattern is typically seen as a bearish continuation, but it can also trigger a strong reversal breakout if price breaks above resistance with significant volume. In short, the market is now at a make-or-break zone — either a breakdown to new lows or a bullish breakout that could spark a strong rally.
---
🔎 Pattern Details & Key Levels
Pattern: Descending Triangle (lower highs + flat support)
Major Support Zone: $1.96 – $2.28 (strong demand zone, price has bounced multiple times)
Dynamic Resistance: descending trendline pressing since early 2025
Static Resistance Levels: $2.737 – $3.094 – $3.537 – $4.832
Psychological Levels above: $6.0 – $8.0
Measured Move Targets (triangle height):
Upside breakout = ≈ $3.51
Downside breakdown = ≈ $1.19
---
✅ Bullish Scenario
Trigger: Daily close above the descending trendline + confirmed breakout above $2.737 with strong volume.
Additional confirmation: Successful retest of trendline / $2.737 as new support.
Targets:
Short-term: $3.09
Primary measured move: $3.51
Extended targets: $3.53 – $4.83 (if momentum continues)
Upside potential: From $2.28 → $3.51 = +53.6%
---
❌ Bearish Scenario
Trigger: Daily close below $1.964 with convincing volume.
Additional confirmation: Failed retest of $1.96 as resistance.
Targets:
Primary measured move: ≈ $1.19
Psychological area: $1.00 (potential liquidity zone)
Downside risk: From $2.28 → $1.19 = -47.8%
---
📌 Conclusion
FIL/USDT is at a major crossroad.
Holding the $1.96–$2.28 support + breakout above the trendline opens the door to $3.51 and potentially $4.83.
Losing this support would confirm a bearish breakdown towards $1.19.
Best approach: Wait for daily close + volume confirmation to avoid false breakouts/breakdowns.
⚠️ Disclaimer: This analysis is for educational purposes only, not financial advice. Always apply proper risk management.
---
> FIL/USDT is now testing a decision zone with a descending triangle pattern on the daily chart.
Bullish case: Breakout above $2.737 → targets $3.09 to $3.51
Bearish case: Breakdown below $1.964 → target $1.19
$1.96 – $2.28 remains the critical support — either the last defense before a deeper drop, or the launchpad for the next rally.
🚨 Watch for daily close & volume to confirm the move!
#FIL #FILUSDT #Filecoin #Crypto #TechnicalAnalysis #DescendingTriangle #SupportResistance #Breakout #BearishScenario #BullishScenario #CryptoTrading

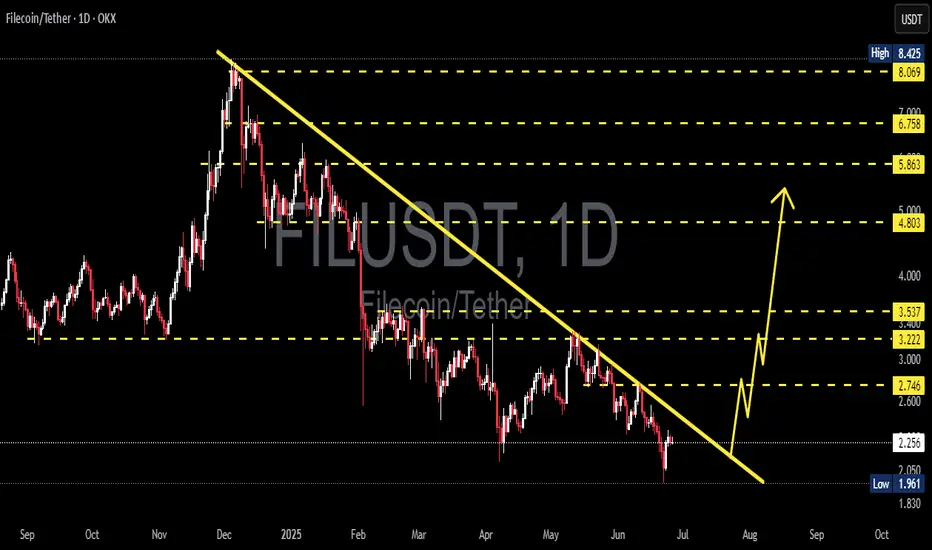
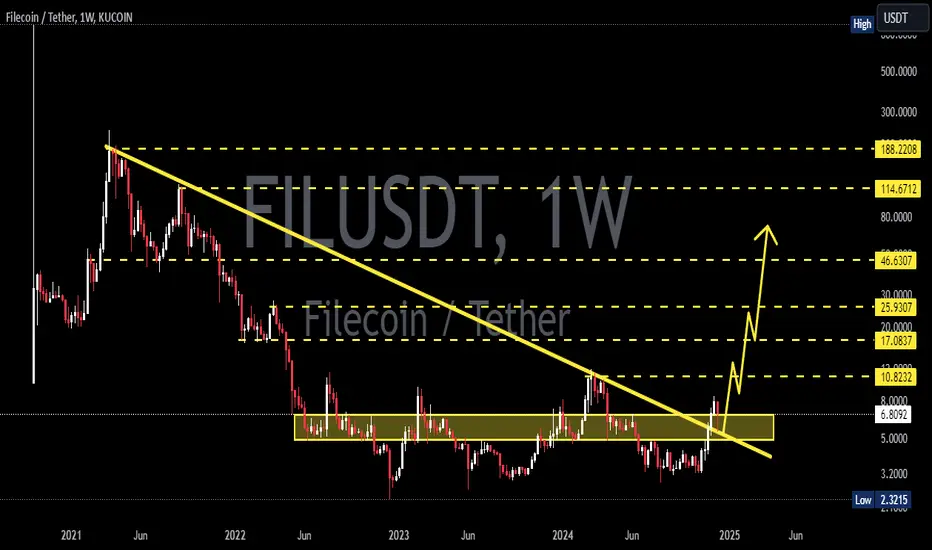
FIL/USDT – Major Trendline Breakout Imminent?The FIL/USDT chart is showcasing a significant descending trendline that has been respected since its peak in late December 2024. Price action has recently approached this trendline again, and a potential breakout scenario is forming. This setup may signal a major shift in trend after months of persistent decline.
🔍 Technical Analysis:
Trendline Resistance:
The long-term descending yellow trendline has capped every bullish rally since early 2025. A breakout above this trendline would be a major bullish technical signal.
Support Level:
Key horizontal support has been held at around $1.96, which has formed a strong base.
Potential Breakout Projection:
Upon breakout, $2.746 is the first resistance to watch.
A successful retest of this level could lead to a stair-step rally targeting:
$3.222
$3.537
$4.803
$5.863
$6.758
And potentially $8.069–$8.425 if momentum continues.
Bullish Pattern:
The projected move shows a potential impulse wave pattern following the breakout, indicating staged profit-taking zones for traders.
🧠 Strategic Consideration:
A daily candle close above the trendline with volume confirmation would be the first sign of trend reversal.
Conservative traders may wait for a retest of the trendline as support before entering.
Targets can be approached progressively based on price action near each resistance level.
⚠️ Risk Management:
Watch for fakeouts near the trendline.
A break below the key support of $1.96 would invalidate the bullish thesis.
FILUSDT 1D AnalysisFIL ~ 1D Analysis
#FIL This is the lowest support for now. Buy if you still have confidence in this coin with a short term target of at least 20%+ from this support.
FILUSDT 1D Analysis FIL ~ 1D Analysis
#FIL Buy gradually from here if you still have confidence in this coin with a short term target of at least 15%+ from here.
FILUSDT 1W AnalysisFIL ~ 1W Analysis
#FIL Buy gradually from here if you still have confidence in this coin with a short term target of at least 20%+ from here.

FILUSDT LONG/SHORTBy utilizing Fibonacci retracement levels, historical patterns, , we can formulate a hypothesis that the market might follow a similar trajectory if bullish sentiment prevails.
FILUSDT 1D AnalysisFIL ~ 1D Analysis
#FIL Buy after successfully penetrating this resistant line with a short -term target of at least 10%+ from here.

#FILUSDT remains under bearish pressure📉 SHORT BYBIT:FILUSDT.P from $2.616
🛡 Stop loss $2.645
🕒 1H Timeframe
⚡️ Overview:
➡️ The POC (Point of Control) BYBIT:FILUSDT.P is located at $2.766, far above the current price — this highlights strong historical selling pressure.
➡️ Price is forming lower highs and lower lows, confirming a bearish trend.
➡️ The breakdown below $2.616 triggered the short setup with further downside potential.
➡️ Volume spikes during red candles indicate continued seller activity.
🎯 TP Targets:
💎 TP 1: $2.605
💎 TP 2: $2.584
💎 TP 3: $2.570
📢 Watch the $2.616 zone — holding below increases downside probability.
📢 If price moves above $2.645, the setup becomes invalid.
BYBIT:FILUSDT.P remains under bearish pressure — short bias stays valid under current structure.

FILECOIN, Will we see 4$ again ?Hello Traders, Hope you are doing great.
After a downward movement that happened yesterday, now price is trying to find support around this level, so for upcoming days I expect an upward correction to specified blue Dashed lines.
Don't forget to use proper risk management .
Tell me What are your thoughts about FILECOIN ? UP or DOWN ? comment your opinion below this post.

FILUSDT 1WFIL ~ 1W Analysis
#FIL This is the lowest support for now.Buy from here if you still have a Conviction on this Coin with a target of 20%+
FILUSDT 1WFIL Update ~ 1W
#FIL still in a bullish trend. If you still have Conviction on this coin,. Buy gradually on this support block. with a minimum target of 20%++

FILUSDT 1WFIL Update ~ 1W
#FIL still in a bullish trend. If you still have Conviction on this coin,. Buy gradually on this support block. with a minimum target of 20%++
FILUSDT 1WFIL Update ~ 1W
#FIL Retesting this resistance line.. If you still have Conviction on the coin,. Buy gradually within this support block,. with a minimum target of 20%+
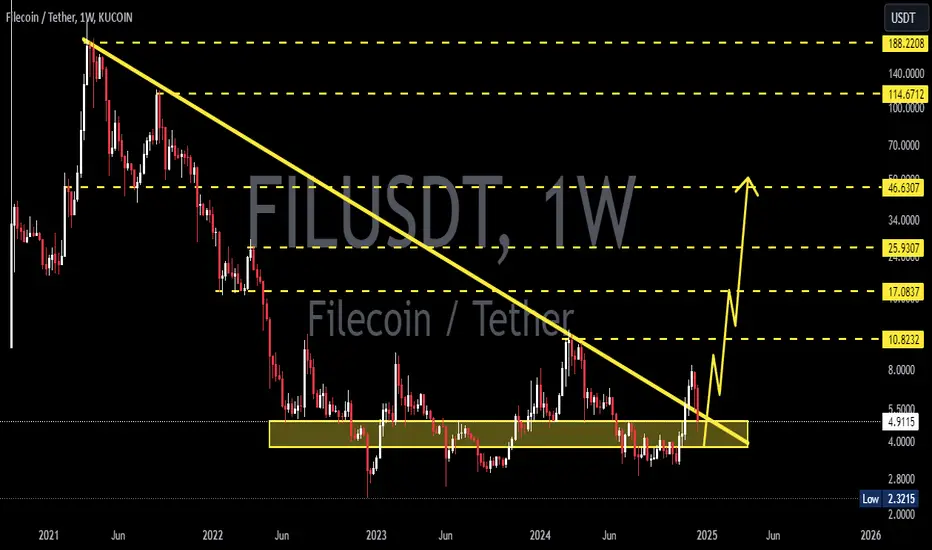
FIL / USDT: Primed for a breakout above trendline resistance FIL/USDT: Primed for a Breakout Above Trendline Resistance
FIL/USDT is setting the stage for a significant move 📈 as it approaches a key trendline resistance zone 📊. The price has been consolidating in a tight range, building momentum for a potential breakout 💥. If the breakout confirms, a bullish rally may unfold 🚀. Keep this pair on your radar and wait for confirmation before taking action.
Key Insights:
1. Trendline Resistance: FIL/USDT is nearing a well-established trendline that has acted as a barrier in the past. A breakout above this level could trigger strong bullish momentum.
2. Volume Surge: A noticeable increase in trading volume during the breakout will confirm buyer dominance 🔥.
3. Bullish Signals: Indicators like RSI and MACD are trending positively ⚡, suggesting growing bullish pressure.
Steps to Confirm the Breakout:
Look for a solid 4H or daily candle close above the trendline 📍.
A spike in volume during the breakout will indicate strong buying activity 📊.
A retest of the broken resistance as a new support zone will add reliability to the move ✅.
Watch out for fake breakouts, such as sudden reversals or long wicks above the trendline ⚠️.
Risk Management Strategies:
Use stop-loss orders to protect your capital 🔒.
Adjust position sizing to align with your risk tolerance and overall strategy 🎯.
This analysis is intended for educational purposes only and is not financial advice. Always conduct your own research (DYOR) 🔍 before making investment decisions.

FILUSDT Long Setup Setting / Setup and SettingsBINANCE:FILUSDT
COINBASE:FILUSD
📈Which side you pick?
Bull or Bear
SL1 ---> Low-risk status: 3x-4x Leverage
SL2 ---> Mid-risk status: 5x-8x Leverage
(If there is just one SL on the chart, I suggest, low risk status🙂
👾Note: The setup is active but expect the uncertain phase as well.
➡️Entry Area:
Yellow zone: 5.56-5.78
⚡️TP:
6.00
6.20
6.40
6.69
🔴SL:
5.33
🧐The Alternate scenario:
If the price stabilize against the direction of the position, below or above the trigger zone, the setup will be canceled.

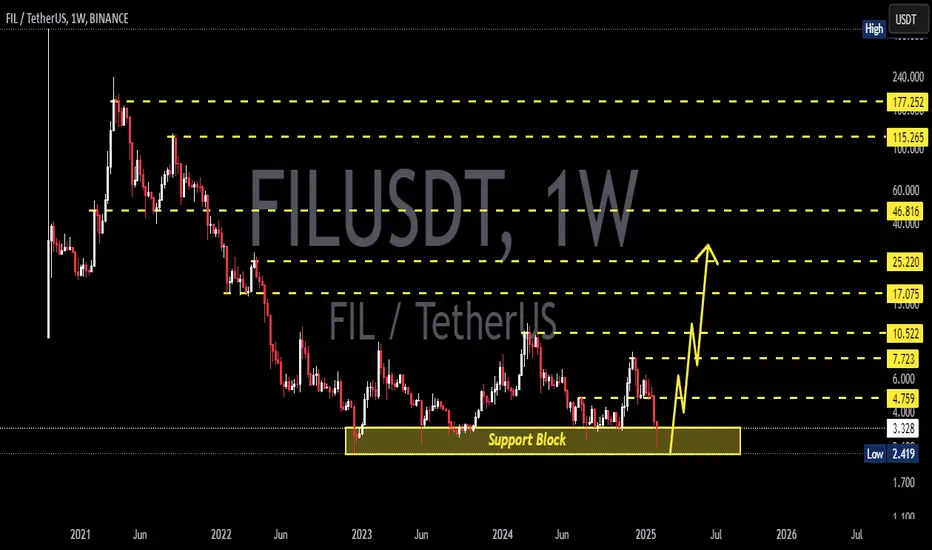
$FILUSDT: Breaking Free After 2-Year Consolidation!!$Filecoin ( BINANCE:FILUSDT ) has finally awakened after a prolonged 2-year consolidation in its key support zone. This decentralized storage coin, with strong fundamentals and promising long-term potential, has now broken out of its local resistance, signaling a potential trend reversal.
Currently, FIL is down 97% from its previous all-time high, offering a compelling risk-to-reward ratio for traders and investors.Trade cautiously and ensure proper risk management as the market regains interest in FIL!
BINANCE:FILUSDT Currently trading at $5.25
Buy level: Above $4.77
Stop loss: Below $3.255
TP1: $8
TP2: $11
TP3: $25
TP4: $40
Max Leverage 3x
Always keep Stop loss
Follow Our Tradingview Account for More Technical Analysis Updates, | Like, Share and Comment Your thoughts

FILUSDTFIL ~ 1W
#FIL If you have Conviction on this NASDAQ:COIN , then this is the right time to start buying, you will get the bottom price for now. at least for 20%+ profits

FILUSDTFIL ~ 1W ✅
#FIL If you have Conviction on this NASDAQ:COIN , then this is the right time to start buying, you will get the bottom price for now. at least for 20%+ profits

FILUSDTFIL ~ 1W ✅
#FIL If you have Conviction on this NASDAQ:COIN , then this is the right time to start buying, you will get the bottom price for now. at least for 20%+ profits

FILUSDTFIL ~ 1W
#FIL If you have Conviction on this NASDAQ:COIN , then this is the right time to start buying, you will get the bottom price for now. at least for 20%+ profits
