$FIO/USDT ANALYSISOn the daily chart, FIO/USDT remains in a broader bearish structure following a strong sell-off from the September highs, but price action has stabilized after forming a base. Since the October low, price is printing higher lows along a rising trendline, indicating gradual accumulation and a slow shift toward recovery. However, upside progress is capped by a clear supply zone around the recent highs, where multiple rejections show sellers remain active. As long as price holds above the rising support, the structure favors consolidation with a mild bullish bias, while failure to maintain this trendline would signal renewed downside pressure within the prevailing range.
Fiousdtsignal

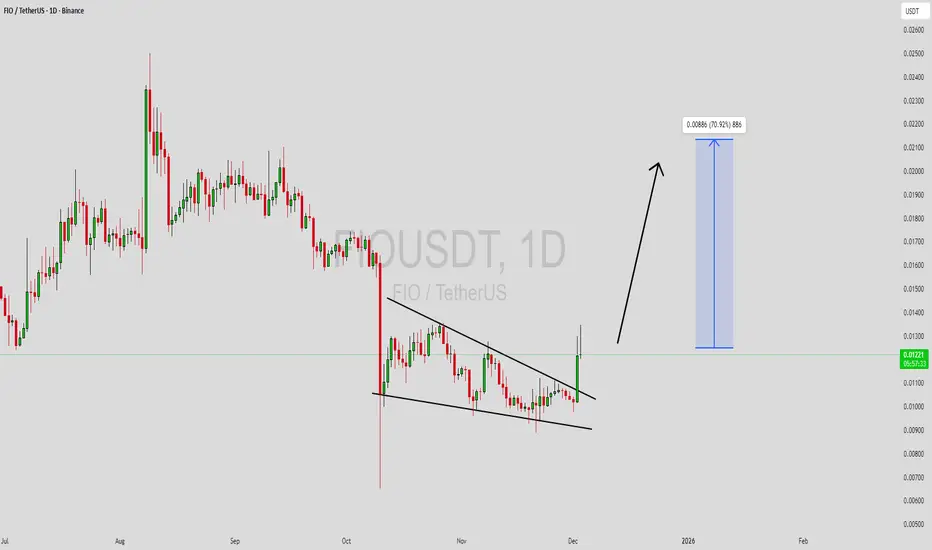
FIOUSDT Forming Falling WedgeFIOUSDT is forming a clear falling wedge pattern, a classic bullish reversal signal that often indicates an upcoming breakout. The price has been consolidating within a narrowing range, suggesting that selling pressure is weakening while buyers are beginning to regain control. With consistent volume confirming accumulation at lower levels, the setup hints at a potential bullish breakout soon. The projected move could lead to an impressive gain of around 60% to 70% once the price breaks above the wedge resistance.
This falling wedge pattern is typically seen at the end of downtrends or corrective phases, and it represents a potential shift in market sentiment from bearish to bullish. Traders closely watching FIOUSDT are noting the strengthening momentum as it nears a breakout zone. The good trading volume adds confidence to this pattern, showing that market participants are positioning early in anticipation of a reversal.
Investors’ growing interest in FIOUSDT reflects rising confidence in the project’s long-term fundamentals and current technical strength. If the breakout confirms with sustained volume, this could mark the start of a fresh bullish leg. Traders might find this a valuable setup for medium-term gains, especially as the wedge pattern completes and buying momentum accelerates.
✅ Show your support by hitting the like button and
✅ Leaving a comment below! (What is your opinion about this Coin?)
Your feedback and engagement keep me inspired to share more insightful market analysis with you!
FIO / USDT : prepping for a Breakout above trendline resistance FIO/USDT: Prepping for a Breakout Above Trendline Resistance
FIO/USDT is holding its middle support zone and looks primed for a potential breakout 📈 above its trendline resistance. This setup signals a high-probability move towards bullish territory 💥. Here's why FIO/USDT is worth watching:
Key Insights:
1. Trendline Resistance: FIO is consolidating near a critical resistance level. A break above it could ignite a strong upward trend 🚀.
2. Volume Confirmation: Keep an eye out for a surge in trading volume to validate buyer interest during the breakout 📊.
3. Momentum Indicators: RSI and MACD are showing positive divergence, indicating growing bullish momentum ⚡.
Steps to Confirm the Breakout:
Look for a decisive 4H or daily candle close above the trendline 📍.
Watch for a volume spike during the breakout to confirm strong buying pressure 🔥.
A successful retest of the broken resistance as support will add confidence to the move ✅.
Stay cautious of fake breakouts, characterized by sharp reversals or false wicks ⚠️.
Risk Management Strategies:
Use stop-loss orders to limit potential losses 🔒.
Stick to proper position sizing in line with your trading plan 🎯.
This analysis is for educational purposes only and not financial advice. Always do your own research (DYOR) 🔍 before making investment decisions.

FIOUSDT 1WFIO ~ 1W
#FIO If you have Conviction on the coin,. Buy gradually on this resistance block if you are an aggressive trader.
But if you are a trader who plays it safe, buy gradually when retesting this resistance line. minimum target 20%+

FIOUSDT Weekly timefarme IdeaBINANCE:FIOUSDT
A very Good project with a great chart.
first target is 0.052 and the 2nd target is 0.079
huge potential.
weekly breakout and RSI bullish Divergence spotted.
Not a financial advise.DYOR

FIOUSDT 1D: Possible LONGFIOUSDT 1D: Possible LONG
It is possible for the level of 0.3000 to be reached after breaking through the level of 0.2050.
