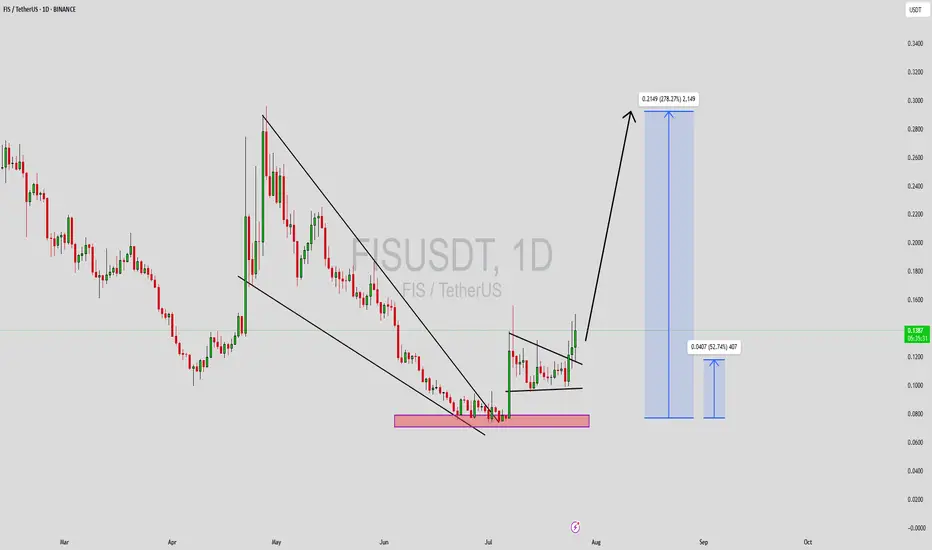
FISUSDT Forming Falling WedgeFISUSDT is forming a textbook falling wedge pattern on the daily timeframe, a well-known bullish reversal signal that often precedes explosive upside breakouts. After an extended corrective phase marked by declining price and compressed volatility, the asset appears to be nearing a breakout zone. The narrowing structure of the wedge, paired with a gradual increase in volume, is a promising setup that signals growing buyer accumulation and a potential shift in market sentiment.
The falling wedge is one of the most reliable bullish continuation and reversal patterns in technical analysis, especially when backed by solid volume, as we’re now observing with FISUSDT. Once the price decisively breaks above the wedge’s resistance line, momentum could accelerate rapidly, triggering a sharp move to the upside. Based on current market conditions and historical price behavior, a target of 240%–250% gain is not out of the question as FIS reclaims previous support levels turned resistance.
Increased investor interest in this project is another key factor to monitor. Social metrics and on-chain activity suggest renewed enthusiasm in the ecosystem, which often precedes strong price performance. Coupled with favorable technicals and a bullish overall structure, FISUSDT offers a compelling opportunity for traders and long-term investors looking for high-risk, high-reward setups.
As always, patience is crucial when trading patterns like the falling wedge. But with technicals aligning and volume confirming accumulation, FISUSDT may soon begin its breakout phase and enter a powerful uptrend.
✅ Show your support by hitting the like button and
✅ Leaving a comment below! (What is You opinion about this Coin)
Your feedback and engagement keep me inspired to share more insightful market analysis with you!
Fisusdtlong
FIS/USDT – Long-Term Outlook (4H Chart)FIS has broken out of a steep downtrend with a strong bullish candle and sharp RSI spike, showing early signs of a potential long-term trend reversal.
Key Observations:
Downtrend resistance broken with volume
RSI exploded above 80, showing strong momentum
Price is currently retracing to the breakout zone for a potential retest
Setup Plan:
Entry: On successful retest of the breakout trendline (~0.105–0.115 zone)
Stop Loss: Below 0.105 (invalidates the breakout)
Targets (Long-Term):
TP1: 0.121 (interim resistance)
TP2: 0.174
TP3: 0.219
TP4: 0.258
If price confirms the breakout and holds above the trendline support, a longer-term uptrend could follow. Patience is key — retest is critical.
DYOR. Not financial advice
#FIS #CryptoTrading #Breakout

FISUSDT: This Key Metric Could Define the Future - Stafi◳◱ On the BINANCE:FISUSDT chart, the Bband Breakout Super-Trend pattern suggests an upcoming trend shift. Traders might observe resistance around 0.4346 | 0.4671 | 0.5427 and support near 0.359 | 0.3159 | 0.2403. Entering trades at 0.5039 could be strategic, aiming for the next resistance level.
◰◲ General Information :
▣ Name: Stafi
▣ Rank: 714
▣ Exchanges: Binance, Huobipro, Gateio, Mexc
▣ Category / Sector: Financial - Derivatives
▣ Overview: None
◰◲ Technical Metrics :
▣ Current Price: 0.5039 ₮
▣ 24H Volume: 1,992,676.241 ₮
▣ 24H Change: 5.463%
▣ Weekly Change: 24.00%%
▣ Monthly Change: 53.27%%
▣ Quarterly Change: 69.61%%
◲◰ Pivot Points :
▣ Resistance Level: 0.4346 | 0.4671 | 0.5427
▣ Support Level: 0.359 | 0.3159 | 0.2403
◱◳ Indicator Recommendations :
▣ Oscillators: BUY
▣ Moving Averages: STRONG_BUY
◰◲ Summary of Technical Indicators : STRONG_BUY
◲◰ Sharpe Ratios :
▣ Last 30 Days: 4.56
▣ Last 90 Days: 2.55
▣ Last Year: 0.73
▣ Last 3 Years: 0.25
◲◰ Volatility Analysis :
▣ Last 30 Days: 1.16
▣ Last 90 Days: 0.88
▣ Last Year: 1.15
▣ Last 3 Years: 1.20
◳◰ Market Sentiment :
▣ News Sentiment: N/A
▣ Twitter Sentiment: N/A
▣ Reddit Sentiment: N/A
▣ In-depth BINANCE:FISUSDT analysis available at TradingView TA Page
▣ Your thoughts matter! What do you think of this analysis? Share your insights in the comments below. Your like, follow, and support are greatly valued and help sustain high-quality content.
◲ Disclaimer : Disclaimer
The content provided is for informational purposes only and does not constitute financial, investment, or trading advice. Always conduct your own research and consult a qualified professional before making any financial decisions. Use of the information is solely at your own risk.
▣ Explore the Power of Charting with TradingView
Unlock a wide range of financial analysis tools, data, and features to elevate your trading experience. Take a tour and see the possibilities. If you decide to upgrade your plan, you can receive up to $30 back. Discover more here - affiliate link -
