SAND LONG FINISHING PATTERNSand bounced off of a support 3 times, and is at the end of a flag pattern, after break out we should see retracement to the 50% fib zone.
Aroon: On a daily time frame we see orange line crossed a blue one which shows start of a bullish trend.
MACD: We are already seeing light red candles which indicates bullish movement gain.
Bollinger band: We just bounced off of a bottom Bollinger band which indicates bullish trends start.
Entry: 2.97
Invalidation: 1.95
Target: 5.38
FLAG

EU Bullish Voulme next target to 1.090hello friends
we find a good support area at 1.082 good sign of bullish voulme started target 1st 1.087 if we break next 2nd Target will be 1.090
hope you enjoy that idea
Stay tuned
thanks

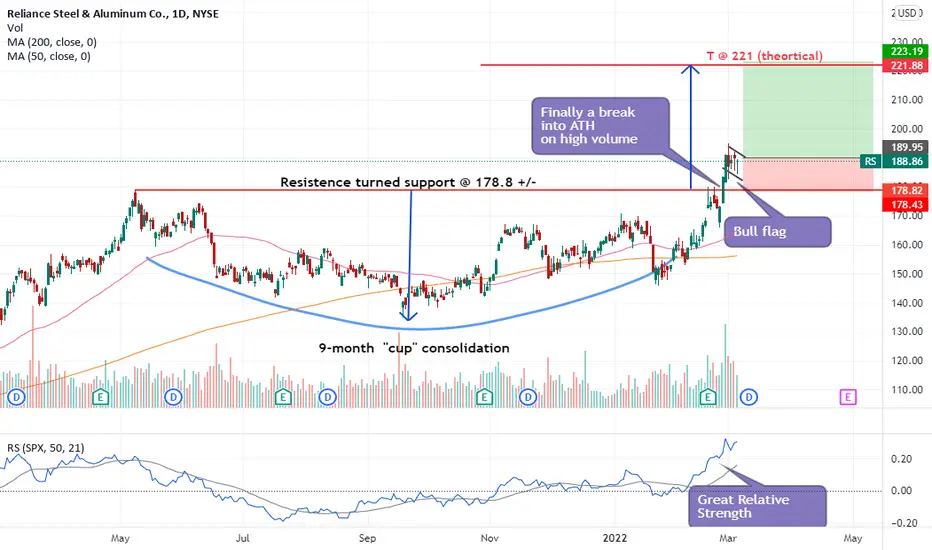
RS - Bull FlagBroke up into ATH (All-time-high) on 28 Feb on strong volume. Have been forming a bull flag since. Buy the next break up of this bull flag as the momentum remains strong.
p/s I may also attempt to buy if it retest the resistence turned support level around 179-179 with a tight stop loss slightly below the support.
Theoretical "cup" target is around $221. Let's see if it is able to reach there.
Protect with trailing stops or scale out along the way.
Disclaimer: TA is about improving our odds of a successful trade (not a guarantee). This is just my own analysis and opinion for discussion and is NOT a trade advice. Please your own due diligence and trade according to your own risk tolerance and don't forget that money management is important! Thank you.
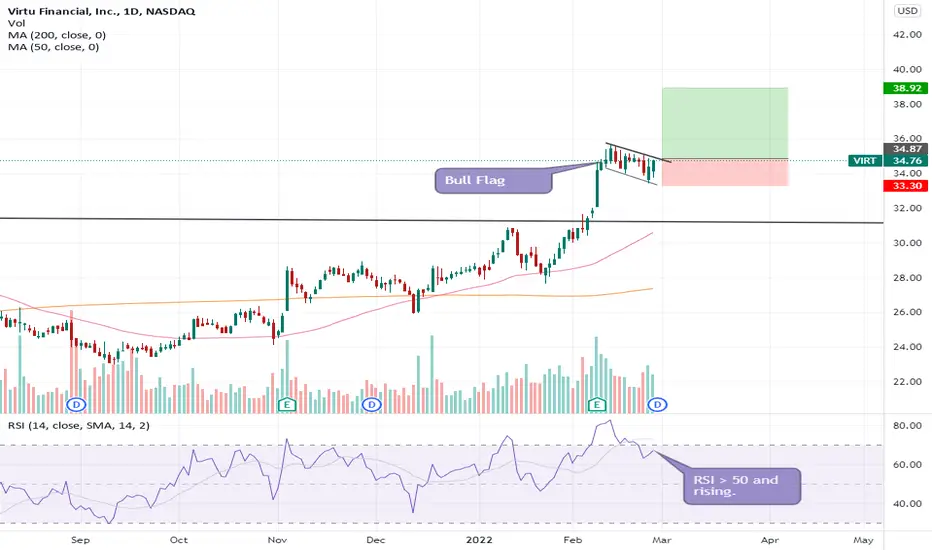
VIRT - Bull FlagWith RSI is strong @ 67 and rising, I am looking to buy the breakup of this bull flag between 34.85 to 35, with initial stop loss just below the low of the last 2 candles.
Let's see if it works out.
Disclaimer: TA is about improving our odds of a successful trade (not a guarantee). This is just my own analysis and opinion for discussion and is NOT a trade advice. Please your own due diligence and trade according to your own risk tolerance and don't forget that money management is important! Thank you.

SHORT IN THE 1HR TFGood short opportunities to take in the 1HR TF, use good risk management and secure early profits

Long EU to 1.138 Bullish Bat PatternHello Friends
well see here Bat pattern
Res level 1.134 if we Break it we can see Bullish PT : 1.138
hope you enjoy your trading lifetime
Thanks

bear flag for intraday price has made bear flag pattern near 50% retracement of previous bearish move
chart pattern will be confirmed on breakout of 1851
entry at 0.50 and 0.618 retracement at 1862, 66 wit SL 1872 (0.786)
tp1 1842

30MIN Long EU 1.13730MIN Chart
EU/US we get bullish A Cypher
Reversal formation
Harmonic pattern
TP: 1.137 as in chart
Have a nice trading Lifetime

GBPJPY - SHORTWe can see a solid bearish flag on our 4H Time frame and a 3 touch confirmation on our Resistance trendline on our higher time frames, with a nice rebound off our 61.8 Fib level and a closing below our 50.0 Fib level on this pair. I will preferably enter at current market price targeting zones around 153

Flag and poll pattern We can go for long after it retest from Fibonacci 0.5 or above 735
Tp1 - 750
Tp2 - 765
I am new to trading and this is my analysis, so don't go with this trade

✅EUR_CAD WAIT FOR BREAKOUT|LONG🚀
✅EUR_CAD is going up now
And the pair has formed
A bullish flag pattern
Which makes me bullish biased
And after the breakout
I believe we will see bullish continuation
LONG🚀
✅Like and subscribe to never miss a new idea!✅


GBPJPY - Going ShortGoing short on GBPJPY, from a technical point of view all indicators point to a sell. Trade wisely with good risk management

NZD-CAD Bearish Bias! Sell!
Hello,Traders!
NZD-CAD is trading in a downtrend
And now the pair broke out of the bear flag pattern
Which means that the bearish continuation is likely
Sell!
Like, comment and subscribe to boost your trading!
See other ideas below too!

$AVAXUSD - Waiting for a breakout hereHello everyone!
AVAX is about to break out from the downtrend channel, it will continue uptrend, and will hit the new highs this year but before that let's set targets at local resistances.
Good luck!

$cmg - this seems a little too obvious going into earningsobvious bear flag with obvious retracement. no position for me. just interesting.

S&P500 - neutral for nowI know there are a lot of fear out there now for a possible bear market this year. We had a severe plunge in the US markets that started on 5th Jan till it hit a near term bottom on 24th Jan, chopped around the low for a few days before making a strong rebound that lasted almost a week.
Since then the markets has started to loose some grounds again. However it looks like a bull flag is forming right now and there is a chance the market could continue to rebound further in the coming days.
Whether we are still in topping process remains to be seen, it could still be 3-6 months of flip flopping and huge volatility before the picture becomes clearer. However, with the 50day moving average still above the 200 day moving average for all 3 indices (ie we don't have a "death cross" yet), I will not be overly bearish just yet and may also look for short term long (or short) opportunities. I would prefer to stay nimble and shorter term for now.
Stay safe.
Disclaimer: TA is about improving our odds of a successful trade (not a guarantee). This is just my own analysis and opinion for discussion and is NOT a trade advice. Kindly do your own due diligence and trade according to your own risk tolerance and don't forget that money management is important! Thank you.

AFRM - Battle of flagsBroke downtrend and rallied hard on news from the lows and got pulled back from the supply, just to come right back today. Constructive volume suggests bullish continuation is likely.
Anything above 51, should be good spot to go long.
As a side note, AFRM in my opinion is pulling in new partners in retail at incredible pace. Even if their bottomline numbers are below target, I expect them to blow away with new clients.

THORChain (RUNE) Buy ZoneTHORChain (RUNE) Buy Zone
--------------------
BIAS
Mid-Term : Bullish
Risk : Medium
On 4 hours timeframe, THORChain is currently forming a lower time frame bull-flag above its second to local high support of $3.9 zone. The buying pressure and the bullish momentum is extreme, which will very likely break to the upside any second.
--------------------
$RUNE/USDT LONG SETUP
Leverage : x3 - x5
Entry Price : 3.8 - 4.1
TP 1 : 4.26
TP 2 : 4.43
TP 3 : 4.67
TP 4 : 4.95
TP 5 : 5.25
TP 6 : 5.52
TP 7 : 5.85
TP 8 : 6.375
Stop Loss : 3.295
*Maximum 3% of Portfolio.
*Unload 12.5% at each TP. Whenever TP 2 hits, Move stop loss to entry.
--------------------

PYPL Breaking Down through Support Today I am discussing Paypal Stock which has been drastically sold off around 40% from highs! I do think this is crazy, and oversold. BUT, I am going to analyze stocks appropriately and without any bias.
PYPL as shown on the Daily Chart has been breaking down through this Range it has been trading in of where I have a Rectangle shape Drawn.
PYPL just closed underneath that rectangle 2 days in a row, and even rejected off that bottom of the Rectangle on Friday. That shows Strong Resistance at that level.
PYPL also broke its Support from its previous breakdown @ the $179.20 area (White Line)
PYPL has 1 wick left from the candle on Jan. 10th and then of course further back supports.
But I think the range it is breaking out of now, is something to note down of not being a small break down. The reason I am saying this is because PYPL has now been in the sideways trading for around 2 and a half months. PYPL is now ready to make a bigger move, but here it seems that bigger move may be to the downside.
Here are EXTRA Reasons why PYPL is a good SHORT idea here.
TTM_SQUEEZE - Squeezing (red dots) indicating big movement of momentum coming. + Momentum Switching to Bearish.
Broke Down and even retested the Rectangle range.
Broke Previous Breakdown support.
GAP to fill at the GREEN Rectangle ($130s) area.
A lot of stocks like to always fill the gaps... and I know its a stretch to say hence it is a long time ago, but with bearish momentum this stock could easily fill that gap.
Some contradicting indicators to this SHORT idea
TTM_SQUEEZE (WEEKLY) - WEEKLY Still showing weakness, but appears to be wearing out, and fading to the bull-side.
WEEKLY moving average cloud.
Still some more key levels to be breaking
I hope you guys enjoyed this idea! Share it if you liked it!
If I do play this I will be looking in to Liquidated March & or April Puts near the $140 strike price.

✅GOLD RISKY SHORT🔥
✅ GOLD has formed a bearish flag pattern
And is retesting a horizontal resistance level
So I am naturally expecting a move down
And a retest of the target below
But we need to wait for the bearish breakout
For the confirmation of our idea
SHORT🔥
✅Like and subscribe to never miss a new idea!✅

