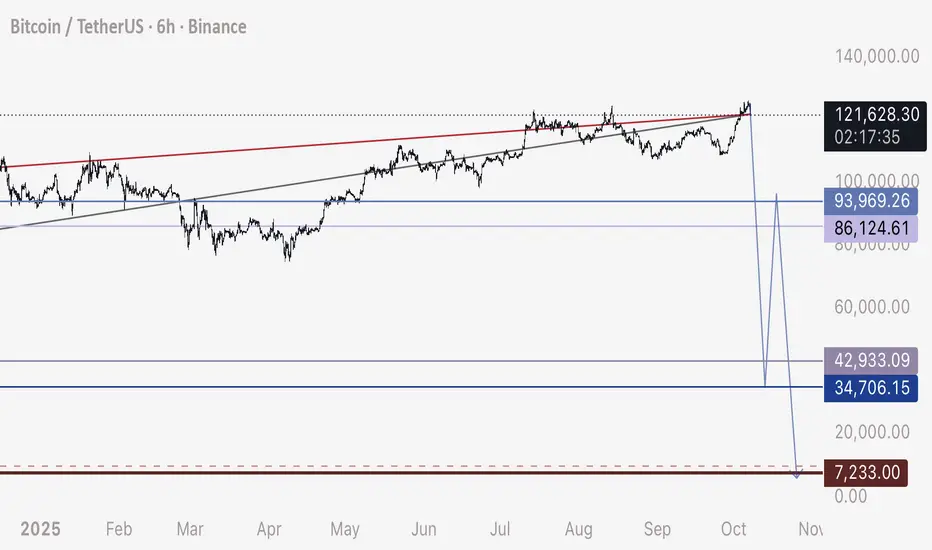
BTC - It’s Coming, Short it Bitcoin has been consolidating underneath this bearish intersection.
It’s just a matter of time before this plays out - don’t be fooled into believing it’s not possible.
The chart below the current price is filled with stacked long stop loss orders - leveraged sell limit orders that are ready to fill one into the next.
DXY has completed a bearish retest of a major monthly breakdown - it’s a high likelihood we can see this drop initiate this weekend period.
Entry - 90,600 to 90,800
Stop Loss - 94,000
Target 1 - 35,000
Target 2 - 8,000
God speed and be safe.
Flashcrash

BTC - How Low Can We Drop? DXY is just about to finish a bearish retest of a breakdown of a major multi-year bearish ascending channel, this indicated a true bull run spanning 3-7 years.
How manipulated is the crypto market? If it is to a large degree, we will likely see a “flash crash” to as low as 7,500
Personally I feel this is coming, as I’ve been indicating in my posts the last months.
Be prepared for this possibility.
- DD

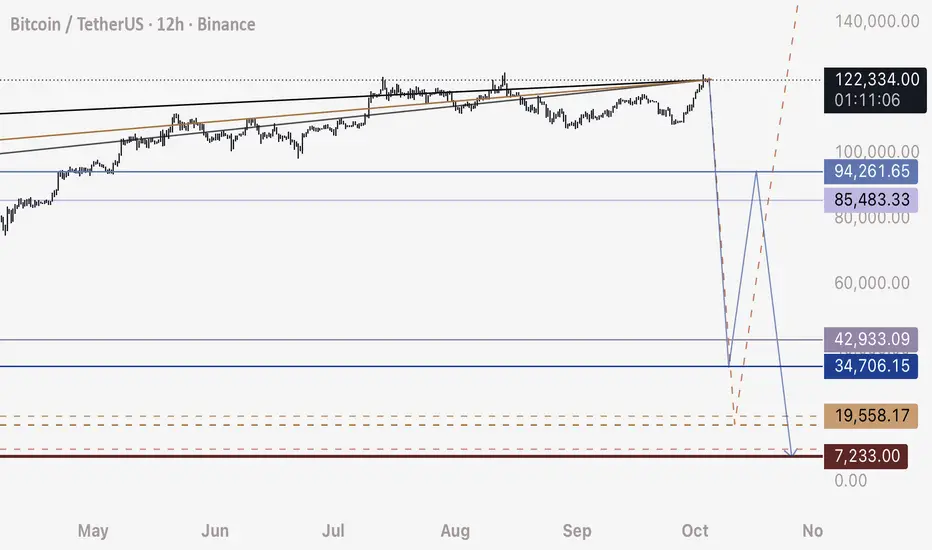
BTC - Another (Drastic) Possibility For those who have been following my bitcoin short ideas, another possibility in this movement that I urge you NOT TO DISCREDIT so easily:
We see a flash crash / wick beginning from 89,000-89,500 region - and we drop straight to sub 10,000
My expected bottom of this wick is precisely 7,250
Now why would this happen, or be possible?
DXY is breaking down a major multi year bearish structure. This means the US dollar will fall in value over the next years, and lead to one of the largest bull markets we’ve ever witnessed on stocks, equities, and securities.
Bitcoin has been steadily rising and collecting not only long position stop loss orders, but liquidation orders for all the leveraged buys (including Microstrategy).
This leaves a massive chain reaction of sell orders ready to trigger off, one into the next, below price.
As price falls, more liquidity is removed and more sell orders are filled - this equals a drop at incredible speed that does not stop until there are no more orders.
So while I have been urging a 3 way corrective drop as such:
89,500 to 34,800
34,800 to 61,000-63,000
61,000 to 8,000
It’s entirely possible we see the following:
89,500 to 8,000
Happy trading,
- DD

BTC, OH BTC...THY ZONES ARE SO UNCHANGING!!!What in the world has been going on with BTC, you ask? Here is a top level view from the weekly and daily. The structure we are seeing is just that ...market structure. There was no "flash crash", "tariff topple", etc. This has been the market being the market and following solid market structure that I've seen play out time after time, regardless of the asset.
What happened:
So...when we reached ATH on BTC near 125K, we had a weekly support zone at 109K - 115K. This zone SHOULD have held price IF we were going to stay bullish, and continue to new highs.
On the week of Oct 13, we had a weekly Break of Structure (BOS) with a close just below this zone. It was a tight close at this level, but it did close below. That was the first sign of a major problem.
Why it Matters:
As I have shown in previous structures, when we see a BOS, the market most likely (80%+) will have a return to the "Source" of that BOS as a FAKEOUT, before making the ultimate move in the direction of the break. We saw this fakeout return up on the weeks of Oct 20th and 27th.
As far as the "flash crash" back on Oct 10, the market had already given us this warning on the Daily Chart. We had a daily Break of Structure from the ATH, and a return to the source. After that return, the big drop came to break the weekly structure. These structure breaks always start on the lower time frames, and then build to higher ones. So, the daily showed it first...then the weekly. If you go back and look at the daily chart, it's fairly clear.
So what Now?:
As for where we are now.... We have already had the Weekly Break of Structure and the return to the source of the break. So, now the market is "hunting" the Weekly Source Zone...It is all but guaranteed to go there. This Weekly Source Zone is big, from ~76,800 - 87,800. To find more accurately where I think we are actually going, I'm going back down to the daily to see the daily source zone within that Weekly Source. That zone is smaller, between 76,800 - 81,000.
Conclusion:
So, in my analysis, we ARE going to between 76,800 and 81K BTC. There's not much of anything that can stop it. There is a Daily Source Zone that we are currently in now, that could slow down this fall, and we could see some kind of "Dead Cat bounce" that pushes prices back up some, but I believe it is purely another fake out move to entice more buyers....it will not likely hold. Maybe a few small Fair Value Gaps get filled up to around 99K, but I don't see it being more than that. Once we see that Daily Source zone break (93,300 - 96,300), it's a fall right down to the Weekly Source, and again, most likely to 76,800 - 81K.

BTC - Two Scenarios Despite all the criticisms I have received on these ideas, it doesn’t change the truth that this is what Bitcoin has been setting up for in its chart.
Scenario 1 - 3 Wave Corrective Drop:
108,500 SHORT to 34,800
34,800 LONG to 80,000
80,000 SHORT to 8,000
Scenario 2 - Straight wick to 8,000
108,500 SHORT to 8,000 to 10,000
Why do I say Bitcoin is inevitably going to see this drop to 8,000?
1. Long Stop Loss orders being accumulated and left in tact all the way down
2. DXY bearish retest translating to a 4-6 year long bull market from here on out
3. Market Makers want their money back
I have a 99% confidence this will happen.
Unfortunately, Bitcoin moves on either side of these major trendlines, and it’s been very difficult to time when it will occur.
Everytime we fall underneath, I feel it’s responsible to inform traders on this platform of this possibility.
- DD

Breakdown or Bounce Incoming? | BTC 4H Analysis D4🥳 Hey everyone! Hope you’re doing great! Welcome to SatoshiFrame channel .
✨ Today we’re diving into the 1-Day BITCOIN analysis. Stay tuned and follow along!
👀 Yesterday I shared Bitcoin’s daily analysis in the channel, and today we’re going to review the 4-hour timeframe, from its recent all-time high up to the present.
🔍 After setting its ATH, Bitcoin entered a descending channel (driven by profit-taking and reactivated whale activity). Each time price reached the top of this channel, it was rejected and moved toward the midline or bottom. The last touch of the channel’s top led to another drop toward the midline, and price failed to break above the channel. The major buy zone (micro buyer area) at the top of the channel was lost and has now turned into a key static resistance, overlapping with the dynamic channel resistance — creating a crucial pivot zone for Bitcoin’s potential trend reversal. The next key support lies below this zone at $105,634; a confirmed break and close below it could extend the downtrend further.
🧮 The RSI oscillator is currently fluctuating between 30 (support) and 50 (resistance). A breakout beyond either side — as highlighted in the chart — could add significant momentum to Bitcoin’s next move. These RSI levels are default static zones, which makes their reliability stronger.
🕯 After the massive flash crash that shook the crypto market, traders have shown a stronger inclination toward selling, keeping Bitcoin within this descending channel. As seen in the volume data, the flash crash was accompanied by extreme selling pressure, and whales broke the micro buyer zone with a large “whale candle.” Continued selling pressure could push Bitcoin toward lower supports, while renewed buying volume and whale re-entry could drive it back toward the channel top to test that resistance once more.
🧠 For those without open positions, here are two key scenarios to consider:
🟢 Long Setup: A breakout above the key static + dynamic resistance zone at $109,222, along with increasing buy volume and RSI crossing above 50, could be a solid long opportunity.
🔴 Short Setup: A confirmed breakdown below the nearest support at $105,634, accompanied by strong selling pressure and RSI falling below 30 into oversold territory, could present a strong short setup.
❤️ Disclaimer : This analysis is purely based on my personal opinion and I only trade if the stated triggers are activated .

IMPENDING FLASHCRASH !Hi everyone,
I didn't wanted to share this before,but i feel like i really want to give a warning of an impending flashcrash which will be the last low for a couple of years.
BUYING OPPORTUNITY! - NO FINANCIAL ADVICE BITSTAMP:BTCUSD
May the fortune favor the bold,
CYANE

13/10/25 Weekly OutlookLast weeks high: $126,237.39
Last weeks low: $102,038.44
Midpoint: $114,137.92
Well that was an interesting week... A small reminder that when Trump talks about tariffs the markets move, and move fast!
From All-Time-High at the beginning of the week to a -19.2% move, a single hourly candle had -10.56% drawdown alone!
What can be learnt from this? Despite all the technical analysis in the world, if the President of the United States makes an announcement it can shift the market greatly causing a leverage unwind via liquidations that cascade aggressively. Although these large scale crashes are rare, they are inevitable in this market and this will not be the last of its kind.
This week will be very interesting because generally we do see a lot of backfilling the wick which would mean revisiting the key S/R level at 0.25 ($108,000). The bulls would not want to see price acceptance under this level or IMO this is the beginning of a bearish shift in HTF structure. This potential shift in structure would also line up with the 4 year cycle theory as October marks the end of the bull market.
On the other hand, the bounce from the low has been strong, although still some way off the origin of the dump a lot of ground has been recovered. In the past these liquidation events have marked local lows in the market and serve as a launchpad for the next leg up. I do think it's too early to tell if that is the case this time around, I am in no rush to position either way until at least Mondays range is established.
The altcoin market took a far worse turn, majors sinking as much as 80% in a single move! This week will be important to learn what projects are truly supported/fundamentally sound by how they recover.
Projects such as: ZEC, TAO, ANYONE and BNB have all closed higher than their original price before the crash, other projects may never recover.
Good luck this week everybody!

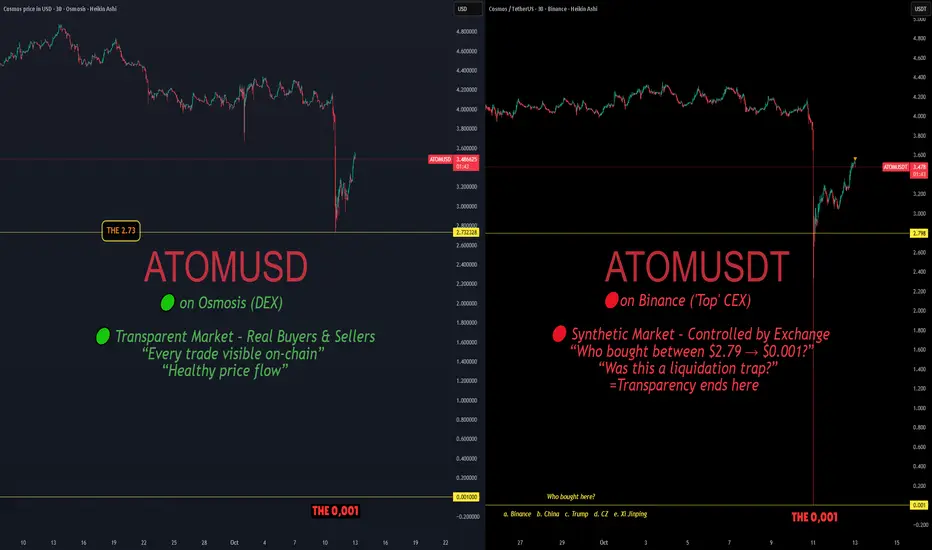
The Problem With Crypto –Part2: The Illusion of Decentralization🧠 The Problem With Crypto – Part 2: The Illusion of Decentralization
Same token.
Same moment.
Two realities.
🟢 ATOM/USD on Osmosis (DEX)
Transparent market — every trade visible on-chain.
Real buyers. Real sellers. Healthy price flow.
🔴 ATOM/USDT on Binance (CEX)
Synthetic market — controlled by the exchange.
Price collapsed to 0.001 USDT.
Who bought there?
Was it a trader, a market maker… or the house itself?
If it was the exchange — we deserve answers.
If it was a “partner” — expose it.
If it was “normal system behavior,” then the system is built to harvest.
On-chain markets move by human action.
Off-chain markets move by design.
And behind that design… there’s the Dragon behind the curtain. 🐉
We’ll dive deeper into that in a next episode.
One Love,
The FXPROFESSOR💙
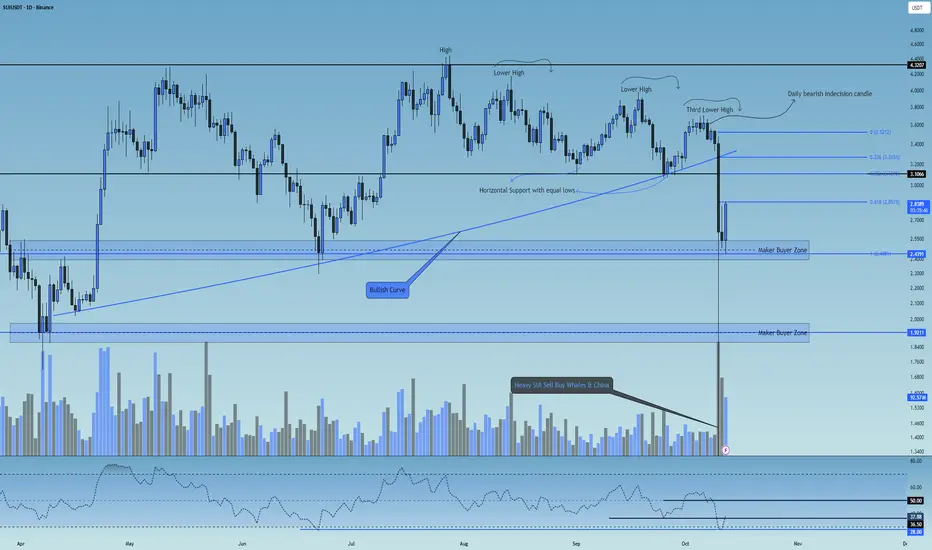
SUI 1D Analysis - Key Triggers Ahead☃️ Welcome to the cryptos winter , I hope you’ve started your day well.
⏰ We’re analyzing SUI on the 1-Day timeframe .
👀 On the daily timeframe of the SUI coin, we can see that SUI was moving along a slightly upward curved line, continuously forming higher highs and higher lows. After creating a top around the $4.3 zone, it faced a strong rejection and dropped toward the $3.3 support area. From there, it started forming lower highs and lower lows, practically entering a descending channel.
At the third and final lower high, SUI formed a strong daily indecision candle, which broke its multi-timeframe support at the $3.5 zone and continued moving downward. During the historic flash crash night of crypto, SUI opened around $3.4, then plunged to $0.5. Following exchange buybacks and market maker interventions, it made a massive upper shadow wick back toward the $2.6 zone, where it finally closed its daily candle.
🧮 Looking at the RSI oscillator, SUI experienced a heavy rejection from the 57 level, dropping below 50 and moving toward its daily oversold zone. The key RSI levels are currently around 36.5 and 50, with the 36.5 zone acting as the nearest crucial pivot level. A bounce from this region would slightly reduce the fear and FOMO of a deeper drop among traders.
🎮 A Fibonacci retracement drawn from $3.5 down to the market maker support zone at $2.43 reveals several important resistance levels. The 0.618 zone serves as a major resistance level—if this level breaks, it could lead to a higher low formation above $2.5, signaling a potential bullish reversal. The next resistance lies around 0.382, which is currently out of buyers’ immediate reach.
🕯 The recent candle sizes and volumes indicate strong selling pressure and rapid price teleportation downward. Signs of this drop could already be seen through the bearish indecision daily candle, but such an extreme dump couldn’t have been predicted purely by technicals. This crash was largely caused by Chinese fund managers selling their holdings, with large wallets entering risk-off mode, unwilling to take further losses. They, along with the Chinese government, sold off their SUI positions to prevent deeper damage—a case of “prevention is better than cure.”
During the recovery phase, exchanges executed significant buybacks, and because the price had fallen to major discounts, many market-making buyers placed strong limit orders at low levels, which helped drive the price back upward.
🪙On the weekly timeframe (SUI/BTC pair), this trading symbol has an extremely critical bottom—losing it could lead to a deep correction that would heavily impact SUI’s core structure. Thanks to buyer support and exchange buybacks, this bottom hasn’t yet been broken in the current weekly candle. There’s also a dynamic resistance trendline pressing down on its relative value; currently, SUI is in the final third of this price compression phase. If this trendline breaks, SUI could gain relative strength against Bitcoin and move upward.
🧠 Currently, SUI sits below its key resistance zone at $2.85. A break and daily close above this level could allow SUI to form a higher low compared to its flash crash bottom, retracing part of the recent drop and providing a better exit opportunity for many holders and traders.
This scenario will be updated with more precision and detail in future analyses.
❤️ Disclaimer : This analysis is purely based on my personal opinion and I only trade if the stated triggers are activated .
BTC 1D Analysis - Key Triggers Ahead | Day 54☃️ Welcome to the cryptos winter , I hope you’ve started your day well.
⏰ We’re analyzing BTC on the 1-Day timeframe .
👀 After the start of the trade war between the United States and China, news was released about a 100% tariff imposed by the United States on China. The crypto market experienced an unbelievable heavy drop (flash crash) last night, which from a technical point of view was completely unexpected and caused the biggest financial loss in the history of crypto.
👍 On the Bitcoin chart and in the daily timeframe, we can see that it is inside a very strong ascending channel, which even with last night’s drop has not closed below its channel body. Currently, Bitcoin is ranging with support at the bottom of the channel, and since it’s the weekend, the market volume has decreased sharply, and we are in a state of uncertainty until the new week’s open.
💡 Note that Bitcoin has not yet entered a trend reversal for the start of its heavy drop. The reversal zone that I specified in the analysis is between $108,960 and $107,521. With a break and confirmation below this zone, Bitcoin can experience a deeper correction and end its long-term primary trend and enter a secondary trend. We can also consider this zone as a distribution area.
Also note that Bitcoin’s return inside the channel has been supported by strong buyers, which has caused this uncertainty. In summary, Bitcoin has a very important resistance in the $114,351 zone, and with a break and confirmation above this area, it can move upward and turn the flash crash into a continuation move. In the continuation of the analysis, we will also use indicators and volume to reach the best conclusion.
🧮 In the RSI oscillator, we can see that after the selling pressure and increase in volatility, it moved downward and easily crossed the 50 zone. We have now defined two key RSI zones:
Zone 50 can be our long trigger area.
Zone 37, where if volatility passes below this level, Bitcoin can move toward the oversold area in its daily timeframe and experience a deeper correction.
🕯 First, let’s talk about volume — the selling pressure was so strong that it pushed the Bitcoin price near $102,000, and then it faced support from buyer makers (those who buy with market-type orders), which brought the price back above $110,000. The size of Bitcoin’s recent candle has been very strong and large, showing the great power of the sellers. With the increase in selling volume and continuation of the tariff war, the market can enter a risk-off state in higher timeframes, and investors may sell their Bitcoins, putting more selling pressure on BTC.
🧠 With the intensification of the tariff war between the U.S. and China, Bitcoin may start its secondary trend after weeks and months of bullish movement, but we still can’t make a definite decision about this issue. So we are waiting for the break of the defined zones in the analysis to make the best decision. Last night’s event was truly painful — a big experience and lesson for all of us that if we can manage our capital, we can have the best results relative to the market. However, last night will be remembered as the biggest financial loss in crypto history.
❤️ Disclaimer : This analysis is purely based on my personal opinion and I only trade if the stated triggers are activated .

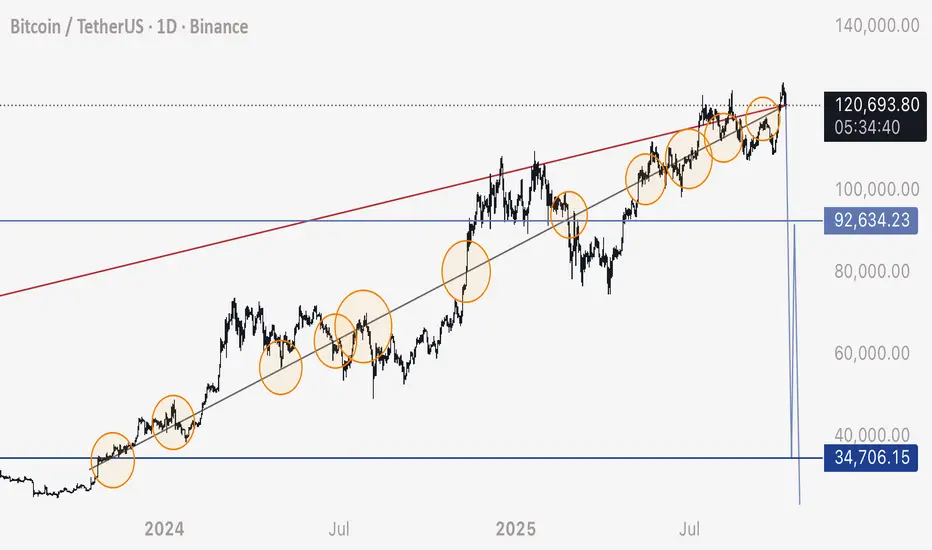
BTC - Explanation of My 35,000 Drop Prediction Here is a broken down explanation of why I’ve been predicting Bitcoin dropping to 35,000
1. We can see this diagonal ascending trendline and how price has been respecting it by looking at the various contact points circled in orange.
2. Bitcoin has been consolidating on either side of this trendline since the beginning of it.
3. Liquidity has been building and building in the form of sell orders / long stop losses all the way down as price has made no substantial recovery of these zones.
4. Eventually Bitcoin will stick it as resistance and as soon as those order blocks are hit, there is enough orders in place (stop losses and liquidations) to drop the price to 35,000 in a very short time period. Essentially, the limit orders are in place like a staircase all the way down, they will fill one after the next and the chart has all the fuel and propellant needed to make a wick to that level.
5. The only reason we would see price consolidate so truly to a bearish line like this is to attract buys and longs as it slowly moves up - this mechanic of the market makes it not only possible but highly likely to happen and we don’t need any sort of black swan or bad news. The orders are ready to set off.
6. This is way more likely than people seem to think. Every long opened has a stop loss order or liquidation order for the entire position size. We can CLEARLY see, just by looking at the chart, these wide open gaps on the chart are filled with these orders. They have been left intact PURPOSELY in order to design a natural, fast wick of a movement.
7. This wick will reclaim all of the market makers and liquidity providers liquidity to them, and de-leverage all open positions.
I truly believe this will happen exactly as I say it will.
- Drop to 35,000
- Very fast drop (2-12 hours for the whole movement - if not, 1 hour)
I’d encourage readers to at least be mindful of the rational behind this analysis and take proper precautions to protect yourselves.
Respectfully,
- DD
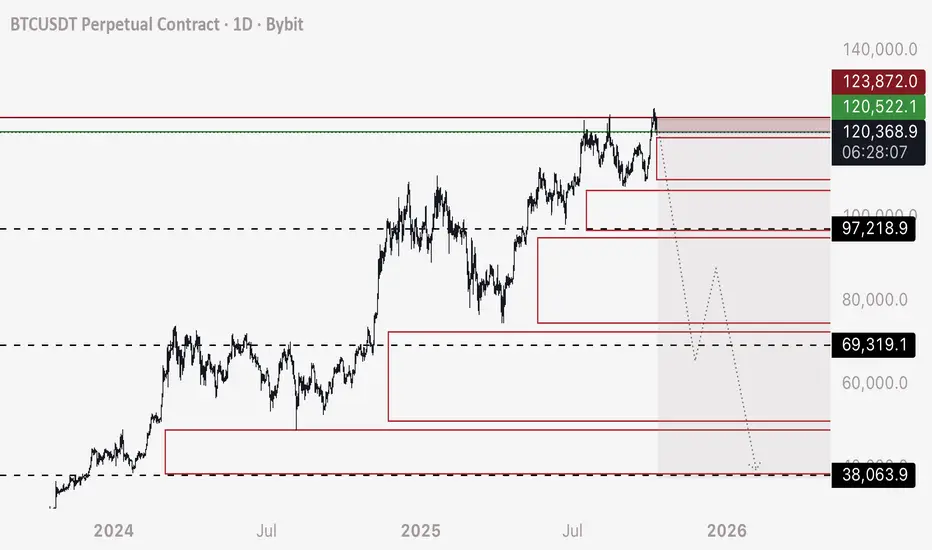
BTC - Short a Stop Hunt and Stay on the Right SideI’m breaking my larger idea down into multiple trades, now that others are opening up to the reality that it’s possible.
These order blocks shown are filled with long position stop losses, leveraged sell orders that only fill when price crosses over - and will set off like a chain reaction.
This will create a very fast drop IE Stop Hunt - and we can take advantage of it.
TRADE 1 - SHORT
Entry - 120,200 to 120,500
Stop Loss - 123,800 (although I don’t see Bitcoin rising back above 121,000 before this trade completes)
Target 1 - 97,250 (Close 25% of trade)
Target 2 - 69,400 (Close 50% of trade)
Target 3 - 38,100 (Close 40-90% of trade as it’s possible we continue to drop and don’t retrace from here to 90,000 appx)
I’ll be logging this trade.
All the best and buckle in.
- DD
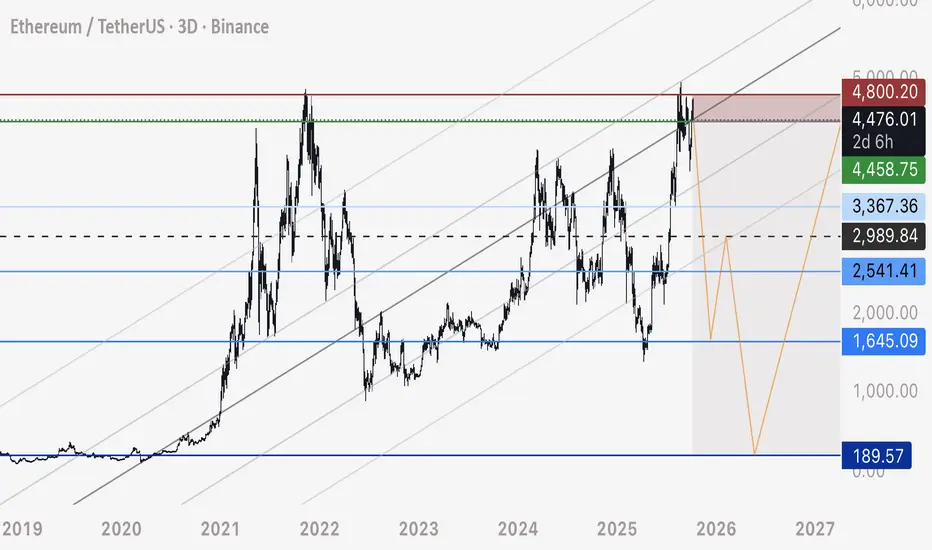
ETH UPDATE - Return to Entry Level, Short Trade InitiatedIn similar fashion to the Bitcoin trade today, here is details on my ETH Short Flash Crash idea.
For detailed information and explanation, please see my linked related posts made today.
Entry / Risk Management:
Entry - 4,460 to 4,480
Stop Loss - 4,800
Take Profits:
1) 3,400 - 20-50% Closure
2) 2,550 - 20% Closure
3) 1,650 - 40-60% Closure
4) 200 - 100% Closure
ETH may create a 3 wave corrective move - and I will be hedging with a long position from 1,600 to 3,000 - timed entry with Bitcoin hitting 35,000
I will buy SPOT ETH only at the range of 200-500
Yours truly,
- DD
Bitcoin Crash Incoming - Watch for this 3 wave Move Here is a close up look at expected corrective path.
This move will be extraordinary fast, the fastest and largest drop we’ve seen in cryptos history.
Please see my linked related posts from today for a detailed overview of this theory, explanation, and helpful insights.
God speed and love to all.
- DD
BTC Will Crash Any MomentThe more times Bitcoin rises in the way it has been, the more long position stop losses (sell orders) are being accumulated and left in tact.
Bitcoin has been repeating this accumulation of long stop losses since the lows of 16,000.
Fast move up, slow sideways down sloping consolidation, fast move up - repeat
Expect a very fast, and drastic drop any moment now.
BTC - Last Attempt to Call the TopBitcoin has been rising the last few days - presumably for a bearish retest.
It doesn’t make sense for the market to continue going up with so much liquidity left to the low zones - and DXY showing support for a 3-5 year bull market on Bitcoin and Equities.
Since I’ve had this wrong many times, I will responsibly resign the idea if this one fails to play out. This will be my last signal for this flash crash idea, which I do still firmly believe will play out.
We are now back to the original entry of upper zone as listed in posts with the similar price level being hit.
The black dashed lines show anticipated 3 wave correction - and the trade plan below details that movement.
Alternately short can be held all the way from Trade 1 into Trade 3 (no hedge long)
Trade 1 - Short
Entry - 119,600
Stop Loss - 123,000
Target 1 - 97,000
Target 2 - 68,000
Target 3 - 44,000
Trade 2 - Long (Hedge with Short still Open)
Entry - 35,500
Stop Loss - 33,000
Target 1 - 44,000
Target 2 - 53,000
Target 3 - 85,000
Trade 3 - Short (DCA long hedge profits or re-entry)
Entry - 88,000 to 90,000
Stop Loss - 95,000
Target 1 - 62,000
Target 2 - 23,000
Target 3 - 10,000
God bless and good luck to everyone.

BTC - Short Initiated from Channel Breakdown Short Update going to plan.
Updated numbers and anticipated 3 wave corrective drop marked on chart.
113,000 to 35,000 (SHORT)
35,000 to 84,000-85,000 (LONG)
84,000 to 8,000 (SHORT)
For my personal trade I will be closing roughly 80% of short at 40,000-45,000
I will then look for a hold and rise from the 35,000 region to validate that we will see this corrective move. I believe there is a high probability of this - reasons I will detail more as the trade progresses. Chart would be too messy if I included all information on future confluences and pivot points.
If I see this rise occur, I will hold the 20% original short - and hedge with a long as well to 80,000 - 35,000 to 80,000
The reason the market is dropping is once again:
1. The significance of DXY breaking down a major multi month bearish channel
2. The fact that this is a bearish retest on BTC HTF - not a bull market or bull pattern
3. There is a mass amount of liquidity held in open longs in Bitcoin - we need to see a severe deleveraging of these low zones to remain bullish
Happy trading - please see related linked ideas.
BTC Short Update - First Entry Point Hit Hi all, we have hit the first entry level on this trade idea again, and I will provide you with updated numbers.
First of all - to those asking “why” this would happen - please see my related idea on DXY as well as Blackrock.
For those asking “how” it’s possible, please see my tutorial on drawing heatmaps and understanding how bitcoin moves.
For those following my ideas, I explain order block analysis, my theory on how Bitcoin moves, and here we have a trading plan compiling it all together.
In theory, these drops should happen very quickly - as I explain the technicals of it in the order block tutorials.
Entry - 116,300 to 116,800
Stop Loss - (Can be lowered to 118,000)
Targets:
1) 90,000
2) 62,000
3) 38,000
After the third target we will likely rise to 86,000-88,000 area - however the short may be held all the way to 8,000.
88,000 is a major bearish trendline - I expect this will break, we will form a 3 wave corrective pattern and rise back up to retest this level.
4) 20,000 (Potential bottom 18,000)
5) 10,000
God speed and happy trading.
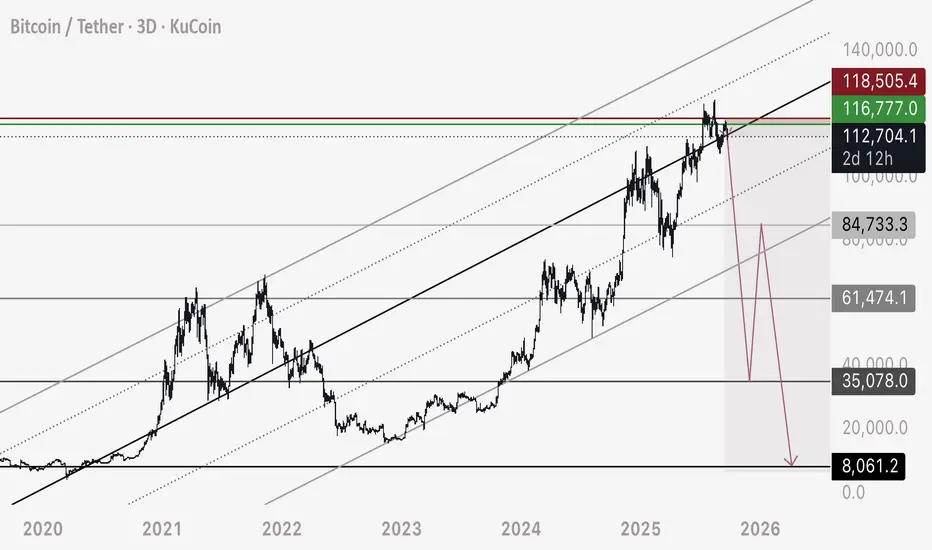
BTC - The largest Trap we have seenThis whole upwards movement since 2023 has been a retest of a bearish breakdown.
The major trendline shown takes Bitcoin to 7,400-8,000 region.
Traders who discredit the possibility of this will certainly be baited and trapped.
Bitcoin will drop aggressively, triggering all of the long stop loss orders one after the next - leveraged sell limit orders that only fill when price passes. This will generate an insanely fast drop to these uber lows.
Traders will take their losses, or their gains - trying to catch the bottom, certain price won’t drop below 100,000 - the 80,000 - then 60,000.
They will not be able to fathom how a drop of such magnitude is possible - or where it’s going to, because they don’t take into consideration the power of stop loss orders and the sheer amount of leveraging in Bitcoins market cap.
Microstrategy - who leverages their assets to produce more of the asset - will likely be challenged with insolvency when the price shows this type of volatility.
The safety of exchange platforms will be called into question - the legalities of leveraging challenged by regulations.
Blackrock will secure their monopoly on Bitcoins buying and selling through their own ETF structure.
Open your eyes. Don’t get trapped or fooled.
This whole move has been a big, intentional set up and my posts explain in detail why, how, what, and when.

BTC - Following Crash PlanBTC has been following my analysis of predicting a potential crash here.
We can use DXY to anticipate when a significant liquidity grab / flash crash will occur.
Since DXY is retesting a major breakdown on the weekly - monthly, it would be wise to watch for volatility today on Bitcoins price, noting these liquidity regions if we are about to enter a bull run ranging out 3-5 years.
Targets and potential corrective patterns marked on this chart.
Happy trading.

BTC - Short Plan UpdateAs per previous warning of the possibility of upwards liquidity grab first, here are updated details and a better entry for this trade.
Entry - 118,500-119,000
Stop Loss - 122,000
Target 1 - 62,000
Target 2 - 35,000
Target 3 - 8,000
- Note that per my plan we would drop to 35,000 and retrace (long) back up to 84,000 to 90,000 to form a 3 wave corrective drop.
- Note that the ultimate bottom could also sit between 17,000 to 19,000, however per my years of work, I believe 7,000 to 8,000 will be hit.
NOTE THIS IS NOT FINANCIAL ADVICE NOR IS IT A SUGGESTION ON HOW TO MANAGE YOUR MONEY. THIS IS MY PERSONAL TRADE ONLY.
Happy Trading.

BTC - Short Trade / Crash Update and DetailsPer my previous post here are the details on my personal trade. Note this is NOT financial advice, and this is my own personal trading plan only. Please use your own judgement.
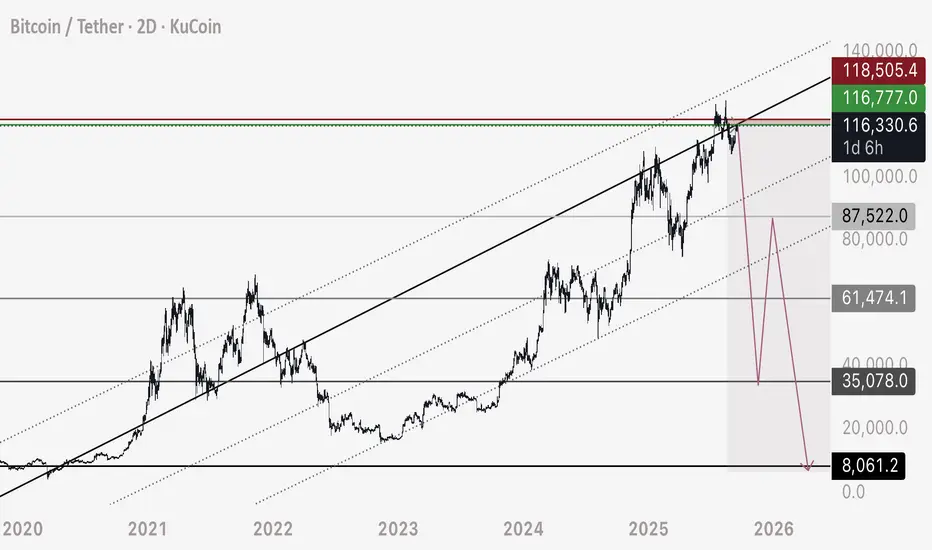
Entry - 116,300 to 116,600
Stop Loss - 121,800
Target 1 - 95,700
Target 2 - 61,500
Target 3 - 35,000
Target 4 - 8,000
Note that Bitcoin should move up from the 35,000 target to 88,000 making a corrective wave on HTF.
At this point I will post an update and advise my own strategy and if I long 35,000 to 88,000.
Happy trading
