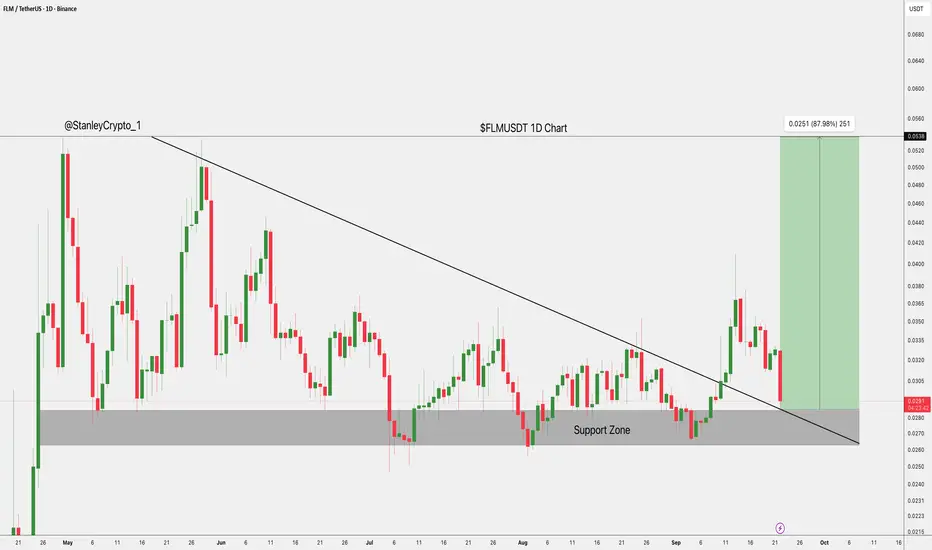
$FLM at Key Support.CSE:FLM is retesting a key support zone around 0.0285, 0.0296. If buyers hold this level, the price could rebound toward 0.0537 for an 87% move. A break below support, though, risks further downside. DYOR, NFA Fby stanleycrypto_1224
FLMUSDT UPDATE#FLM UPDATE FLM Technical Setup Pattern : Bullish Falling Wedge Pattern Current Price: $0.0374 Target Price: $0.0730 Target % Gain: 118.18% Technical Analysis: FLM has broken out of a bullish falling wedge on the daily timeframe with strong bullish momentum. A confirmed breakout above $0.035 signals upside continuation toward $0.073, supported by volume expansion and structure breakout. Time Frame: 1D Risk Management Tip: Always use proper risk management.FLongby CryptoWithJames113
FLMUSDT Forming Bullish MoveFLMUSDT is showing signs of strength with a bullish move pattern forming on the chart. The consistent trading volume indicates strong participation from investors, which often serves as a key driver for sustainable price growth. This accumulation phase suggests that buyers are preparing for a potential breakout that could carry momentum into higher levels. The current market behavior highlights investor confidence in the project, as the price structure aligns with bullish continuation signals. Once the resistance zones are cleared, FLMUSDT could see a significant upside move supported by volume and positive sentiment. With an expected gain of 40% to 50%+, this setup provides an attractive risk-to-reward ratio for traders and investors alike. The growing interest around this pair strengthens the outlook, making it one to watch closely for the next breakout opportunity. ✅ Show your support by hitting the like button and ✅ Leaving a comment below! (What is You opinion about this Coin) Your feedback and engagement keep me inspired to share more insightful market analysis with you! FLongby Alpha-GoldFX3
#FLM/USDT – Bullish Reversal Opportunity | 1H Chart #FLM The price is moving within a descending channel on the 1-hour frame, adhering well to it, and is on its way to breaking it strongly upwards and retesting it. We have a bounce from the lower boundary of the descending channel. This support is at 0.0257. We have a downtrend on the RSI indicator that is about to break and retest, supporting the upside. There is a major support area in green at 0.0248, which represents a strong basis for the upside. Don't forget a simple thing: ease and capital. When you reach the first target, save some money and then change your stop-loss order to an entry order. For inquiries, please leave a comment. We have a trend to hold above the 100 Moving Average. Entry price: 0.0257. First target: 0.0270. Second target: 0.0285. Third target: 0.0301. Don't forget a simple thing: ease and capital. When you reach the first target, save some money and then change your stop-loss order to an entry order. For inquiries, please leave a comment. Thank you.FLongby CryptoAnalystSignal2
#FLM/Usdt Breakout ?#FLM The price is moving within a descending channel on the 1-hour frame and is expected to break and continue upward. We have a trend to stabilize above the 100 moving average once again. We have a downtrend on the RSI indicator that supports the upward break. We have a support area at the lower boundary of the channel at 0.0323, acting as strong support from which the price can rebound. We have a major support area in green that pushed the price upward at 0.0315. Entry price: 0.0327. First target: 0.0342. Second target: 0.0351. Third target: 0.0364. To manage risk, don't forget stop loss and capital management. When you reach the first target, save some profits and then change the stop order to an entry order. For inquiries, please comment. Thank you.FLongby CryptoAnalystSignal4
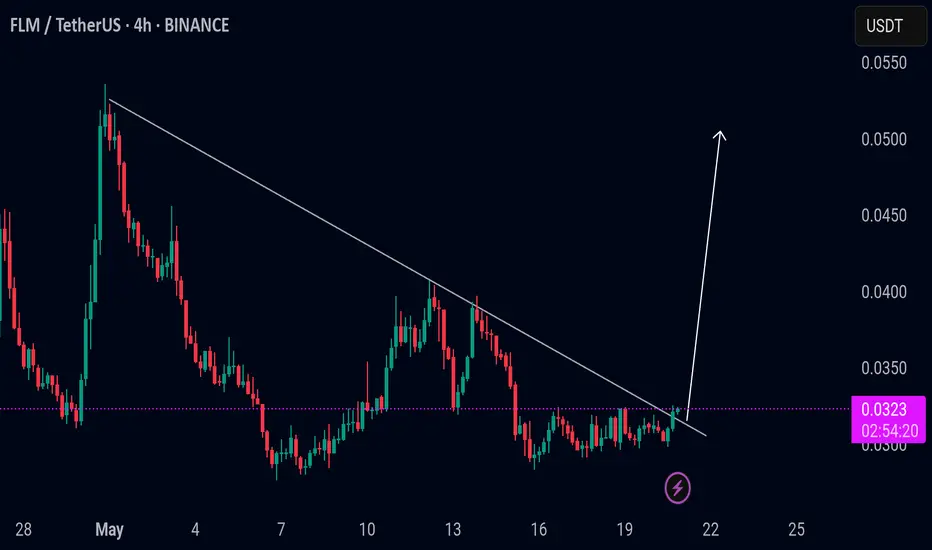
Flm/Usdt BreakoutFLMUSDT: FLM is now trading around $0.0323. FLM already broke out of the trend line on the 4-hour timeframe and looks bullish. So, the possible scenario, according to the pattern, is bullish momentum in FLM, and it could pump up to 20–30%. Otherwise, if it dumps and trades inside the triangle again, the breakout will be considered a fakeout. Keep an eye on it.FLongby Crypto-By--Ghazi1
$FLM/USDT Breakout AlertAfter a strong accumulation phase, CSE:FLM just broke out of a descending trendline with volume confirmation! Entry: 0.0154 SL: 0.0137 Target: 0.0269 Price broke above the trendline + 50ema, signalling a potential trend reversal. Bullish momentum is building; eyes are on the next key level! Are you riding this breakout? 👀 FLongby stanleycrypto_1Updated 6
FLMUSDT 1WFLM ~ 1W #FLM If you still have Conviction on this coin, buy it gradually from here with a minimum target of 20%++FLongby CryptoNuclear7
FLMUSDT: Watching for Buyer Activity in the Blue Box FLMUSDT: Watching for Buyer Activity in the Blue Box 🚨 FLMUSDT is in an interesting spot, folks. Here’s what we know: Active Sellers: Currently, sellers are dominating, but this could change quickly. Stops at 0.039: This level is key for managing risk and planning entries. Blue Box Opportunity: This is where I’m expecting potential buyer activity to pick up. It’s critical to keep an eye on this zone for signs of a reversal. Confirmation Tools: Check CDV (Cumulative Delta Volume) and volume profile as price enters the blue box. These will help identify if buyers are stepping in with strength. My Plan: If we see buyers showing up in the blue box with bullish market structure on lower timeframes (1H or lower), this could present a strong long opportunity. Until then, patience is key! Stay sharp, traders these setups can move fast. Boost, comment, and follow for more actionable insights! 🚀 Let me tell you, this is something special. These insights, these setups—they’re not just good; they’re game-changers. I've spent years refining my approach, and the results speak for themselves. People are always asking, "How do you spot these opportunities?" It’s simple: experience, clarity, and a focus on high-probability moves. Want to know how I use heatmaps, cumulative volume delta, and volume footprint techniques to find demand zones with precision? I’m happy to share—just send me a message. No cost, no catch. I believe in helping people make smarter decisions. Here are some of my recent analyses. Each one highlights key opportunities: 🚀 RENDERUSDT: Strategic Support Zones at the Blue Boxes +%45 Reaction 🎯 PUNDIXUSDT: Huge Opportunity | 250% Volume Spike - %60 Reaction Sniper Entry 🌐 CryptoMarkets TOTAL2: Support Zone 🚀 GMTUSDT: %35 FAST REJECTION FROM THE RED BOX 🎯 ZENUSDT.P: Patience & Profitability | %230 Reaction from the Sniper Entry 🐶 DOGEUSDT.P: Next Move 🎨 RENDERUSDT.P: Opportunity of the Month 💎 ETHUSDT.P: Where to Retrace 🟢 BNBUSDT.P: Potential Surge 📊 BTC Dominance: Reaction Zone 🌊 WAVESUSDT.P: Demand Zone Potential 🟣 UNIUSDT.P: Long-Term Trade 🔵 XRPUSDT.P: Entry Zones 🔗 LINKUSDT.P: Follow The River 📈 BTCUSDT.P: Two Key Demand Zones 🟩 POLUSDT: Bullish Momentum 🌟 PENDLEUSDT.P: Where Opportunity Meets Precision 🔥 BTCUSDT.P: Liquidation of Highly Leveraged Longs 🌊 SOLUSDT.P: SOL's Dip - Your Opportunity 🐸 1000PEPEUSDT.P: Prime Bounce Zone Unlocked 🚀 ETHUSDT.P: Set to Explode - Don't Miss This Game Changer 🤖 IQUSDT: Smart Plan ⚡️ PONDUSDT: A Trade Not Taken Is Better Than a Losing One 💼 STMXUSDT: 2 Buying Areas 🐢 TURBOUSDT: Buy Zones and Buyer Presence 🌍 ICPUSDT.P: Massive Upside Potential | Check the Trade Update For Seeing Results 🟠 IDEXUSDT: Spot Buy Area | %26 Profit if You Trade with MSB 📌 USUALUSDT: Buyers Are Active + %70 Profit in Total 🌟 FORTHUSDT: Sniper Entry +%26 Reaction 🐳 QKCUSDT: Sniper Entry +%57 Reaction 📊 BTC.D: Retest of Key Area Highly Likely This list? It’s just a small piece of what I’ve been working on. There’s so much more. Go check my profile, see the results for yourself. My goal is simple: provide value and help you win. If you’ve got questions, I’ve got answers. Let’s get to work!FLongby UmutTrades1
$FLM pay attentionJust pay attention at FLM it could breakout resistance Price at 200EMA and 61fibo it's a good point but also look at the CRYPTOCAP:BTC becuase it's leader of marketFLongby Alireza_kamali2
FLM breakout: Uptrend outside the parallel channelFLM is coming out of the parallel channel! It is worth paying attention to this project, it looks quite bullish from a technical point of view. Exit from the parallel channel, consolidation above 50 EMA, RSI is also not overloaded. I wouldn't have high hopes, but the 0.382 area looks conservative and logical. Horban Brothers.FLongby horbanbrothers6
FLMUSDTFLM ~ 1W #FLM The pressure/decline on this coin seems to have weakened. If you have Conviction on this coin,. At least a 20%+ increase from here isn't difficult.FLongby CryptoNuclear7
FLMUSDT 1:1 Long Setup SettingBINANCE:FLMUSDT OKX:FLMUSDT SL1 ---> Low-risk status: 3x-4x Leverage SL2 ---> Mid-risk status: 5x-8x Leverage 👾The setup is active but expect the uncertain phase as well. ➡️Entry Area: Yellow zone ⚡️TP: 0.0523 0.0531 0.0540 0.0550 🔴SL: 0.048 🧐The Alternate scenario: If the price stabilizes below the trigger zone, the setup will be cancelled.FLongby UnknownUnicorn18258085Updated 16
#FLM EXIT PUMP..120 % UP#FLM EXIT PUMP..120 % UP.. It could drop a little more, or the current price might hold. This could explode at any moment, and it could be an exit pump for FLM holders.FLongby ShashvataTradingUpdated 5
FLMUSDT.1DHere's a detailed technical analysis of the FLM/USDT daily chart: Price Action and Structure: The chart for FLM/USDT depicts a bearish trend since the high point around mid-March, with the price establishing a descending trendline. However, recent actions show a consolidation pattern forming, indicating a possible accumulation phase. This is a key juncture, as the direction of the breakout could dictate the short-to-medium term trend. Technical Indicators: RSI (Relative Strength Index): The RSI currently reads at 52.08, hovering around the neutral 50 mark, which indicates a balance between buying and selling pressures. This neutrality often precedes potential moves as the market decides on a direction. MACD (Moving Average Convergence Divergence): The MACD is showing a slight bullish crossover, with the MACD line just above the signal line. This could indicate an early sign of growing bullish momentum, although it’s still quite early to confirm a strong uptrend. Support and Resistance: Support (S1 and S2): The chart identifies a crucial support level (S1) at $0.0812. If the price holds above this level, it could stabilize and potentially begin an upward trajectory. A drop below this support could lead to further declines towards the next significant support (S2). Resistance (R1 and R2): Resistance at $0.1133 (R1) is the first barrier the price needs to break through to confirm any bullish bias. The next major resistance at $0.1439 (R2) represents a longer-term target for a bullish scenario. Projection and Strategy: The chart projects a possible bullish move, aiming first for R1, followed by a more ambitious target at R2 if the momentum continues. The strategy should focus on confirming the bullish potential by monitoring the price reaction around the current consolidation and especially at the S1 support level. Entry points could be considered around or slightly above S1, with stop losses just below this level to manage risk. Conclusion: The FLM/USDT pair shows signs of potential bullish activity but requires further confirmation. A sustained move above S1 with supportive volume and additional bullish signals from the RSI and MACD would increase confidence in a possible uptrend. Traders should remain cautious and wait for clear signals before committing to positions, given the recent price volatility and the proximity to significant support and resistance levels.FLongby MarsSignals4
Flm/Usdt Breakout The breakout of the triangle pattern for the FLm/USDT pair has recently been confirmed, and the price is currently undergoing a retest. Based on this technical analysis, I predict that there will be a substantial price increase of at least 50-100% in the coming days. It's important to remember that this analysis is not to be considered as financial advice. Make sure to perform your own due diligence (DYOR) before deciding to make any investment choices.FLongby Crypto-By-Ghazi4
#FLM/USDT LONG#FLM The price has been moving in a bearish flag since July 2022, 3 D and we are about to break that pattern by breaking the downtrend. Supported by oversold on MACD Current price 0.0928 First target 0.1231 Second goal 0.1695 Which represents 180% of the current price This rise is supported by the break of moving average 100, and you must pay attention to the correction points on the chartFLongby CryptoAnalystSignalUpdated 1117
FLM/USDT is need breakout the resistance for confirm to bullish!💎 Paradisers, #FLM has recently shown significant market dynamics. Currently, FLM is encountering resistance. 💎 If FLM successfully breaks out above this resistance, it could signal bullish momentum and lead to further upward movement, possibly reaching the strong resistance area. 💎 However, if FLM fails to break out of the resistance and experiences rejection, there is a possibility of a downward movement towards the support area around $0.11. This could allow FLM to gather momentum for another breakout attempt. 💎 When FLM reaches the support area, it needs to bounce to maintain bullish momentum and attempt to break out of the resistance again. However, if FLM fails to bounce from the support and breaks below it, it could indicate a bearish trend continuation, leading to further downward movement. MyCryptoParadise iFeel the success🌴Fby MyCryptoParadise_Nathan6611
Strong buy#FLM/USDT look like very nice.STRONG BUY. 1st TP 0.2728 #BTC god luck everyoneFLongby MrKhasayev3
FLM IS READY FOR 5X TO 7X IN COMING WEEKSFLM is sleeping giant, can start pump any time, buy and hold in spots for 5x to 7x in near future.FLongby HyBlockCap7
#FLM/USDT#FLM The price is moving in a bearish channel on a 4-hour frame, which the price adheres to and is expected to break to the upside in an upward manner It is expected that the Moving Average 100 test will be retested We have a major support area in green at 0.09700 The RSI indicator has a downtrend that is expected to break higher Entry price is 0.1020 The first target is 0.1138 The second goal is 0.1282 The third goal is 0.1482FLongby CryptoAnalystSignalUpdated 6
FLM ANALYSIS💥💥#FLM Analysis 🚀🚀 #FLM is breaking out of a falling wedge pattern with huge volume on daily timeframe👀 We are expecting more than 100% movement in first run✈️ 💸 👀Current Price: $0.1350 🚀 Target Price: $0.2684 ⚡️What to do ? 👀Keep an eye on #FLM price action and volume. We can trade according to the chart and make some profits⚡️⚡️ #FLM #Cryptocurrency #TechnicalAnalysis #DYORFLongby ZEUS_Market_Alerts4
FLM buy setupWe have a Boolean CH in the main structure that gives us a Boolean view and creates the expectation that the specified demand is not lost. Therefore, in returning to the specified demand side, you can look for buy/long. By maintaining the demand range, it can move towards the supply side Closing a daily candle below the invalidation level will violate the analysis Note that the financial market is risky, so: Do not enter any position without confirmation and trigger. Do not enter a position without setting a stop. Do not enter a position without capital management. When we reach the first TP, save some profit and try to move the stop continuously in the direction of your profit. If you have any comments please post them, comments will help us improve our performance ThanksFby iMoneyTeam2