FLOKI/USDT – Big Rebound or Structural Breakdown?Timeframe: 5 Day
Market Condition: After a strong parabolic rally, FLOKI has entered a macro correction and distribution phase
Price is currently trading at a critical decision zone that will determine whether the macro bullish trend continues or shifts into a bearish structure
---
🟨 Key Support Zone (Yellow Block)
0.0000335 – 0.0000270
This zone represents:
Strong historical demand area
Previous accumulation base before a major impulsive move
High-probability buyer reaction zone
The last line of defense for long-term bullish structure
As long as price holds above this zone, FLOKI remains structurally bullish on a macro scale.
---
📐 Market Structure & Pattern Analysis
🔹 1. Market Structure
Formation of Lower Highs (LH) and Lower Lows (LL) → short-to-mid term downtrend
However, no confirmed major support breakdown yet
This move is still classified as a deep correction within a larger bullish cycle
---
🔹 2. Supply & Resistance Zones (Dashed Yellow Lines)
Key resistance levels:
0.0000730
0.0001125
0.0001380
These zones act as:
Major supply areas
Former support turned resistance
Potential distribution zones if price fails to break above them
---
🔹 3. Price Action Pattern
Current structure suggests:
Descending structure / falling channel
Potential development into:
Double Bottom (Bullish Reversal)
or Bearish Continuation Breakdown
Confirmation depends heavily on price reaction at the key support zone.
---
🟢 Bullish Scenario (Primary Reversal Setup)
Key conditions:
Strong rejection and sustained price action above 0.0000335 – 0.0000270
Presence of bullish candles with long lower wicks or impulsive moves
Bullish progression:
1. Strong rebound from key support
2. Formation of Higher Low (HL)
3. Break of minor structure
4. Upside targets:
🎯 0.0000730
🎯 0.0001125
🎯 0.0001380
📈 Bias: Buy on confirmation and reaction, not blind entries.
---
🔴 Bearish Scenario (Structural Breakdown)
Key conditions:
Strong 5D candle close below 0.0000270
Lack of meaningful buyer rejection
Implications:
Macro bullish structure becomes invalid
Previous support flips into resistance
Potential continuation toward:
0.0000200
Or a full retest of previous macro lows
📉 Bias: Breakdown favors trend continuation to the downside.
---
🧠 Technical Conclusion
FLOKI is currently sitting at a macro decision zone
The yellow support block is the critical level
Price reaction here will define:
🔄 Major bullish reversal
or ⛔ Extended bearish continuation
> “It’s not about predicting direction, it’s about reacting to confirmation at key levels.”
---
⚠️ Risk Management Note
Wait for candle confirmation
Avoid emotional entries
Always apply proper risk management
---
#FLOKI #FLOKIUSDT #CryptoAnalysis
#TechnicalAnalysis #PriceAction
#SupportResistance #Altcoins
#BullishScenario #BearishScenario
#TradingView #CryptoTrading
#MarketStructure #SupplyDemand
FLOKIUSDC

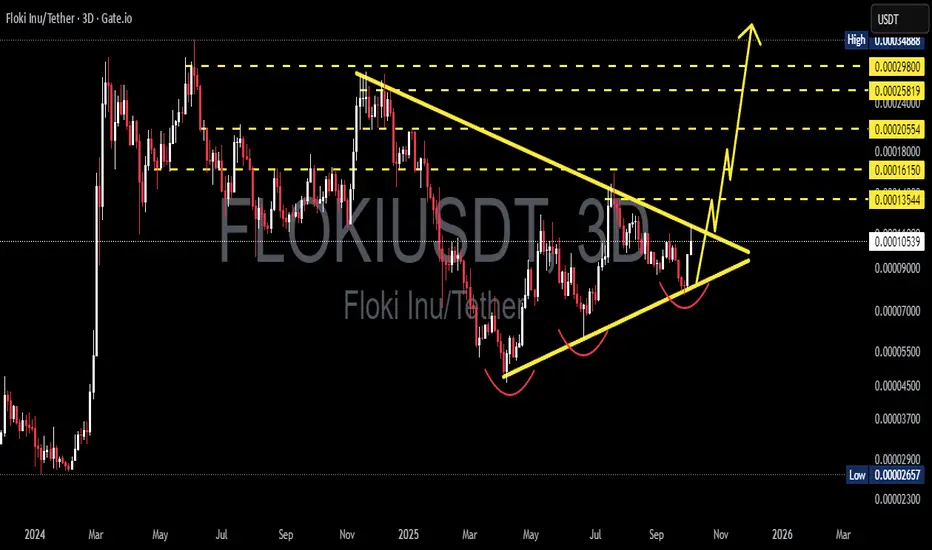
FLOKIUSDT — Symmetrical Triangle: Consolidation Before Big Move?1. Overview
The FLOKI/USDT (3D, Gate.io) chart is forming a large symmetrical triangle, developing since early 2025.
This pattern reflects a prolonged consolidation phase following a significant downtrend, where market participants are balancing between selling pressure and gradual accumulation before the next major directional move.
Interestingly, the lower structure shows several rounded bottoms along the ascending trendline — a strong indication of gradual accumulation by larger buyers, as each dip is being bought higher than the previous one.
---
2. Pattern Analysis
Primary pattern: Symmetrical Triangle — a neutral structure that can break either way, depending on momentum and volume confirmation.
Ascending trendline (support): consistent higher lows indicate rising buying interest and absorption of sell orders.
Descending trendline (resistance): each rally meets selling pressure near this line, forming lower-highs.
Sub-pattern: multiple rounded bottoms (forming a slight triple-bottom structure) that often precede bullish breakouts from consolidation.
Volume behavior: still relatively quiet, but a breakout is often accompanied by a sharp increase in trading volume — a key element to watch.
---
3. Key Technical Levels
Dynamic Support
Ascending trendline: around 0.00009000 – 0.00009200, acting as a strong defensive zone for buyers.
A breakdown below this line would invalidate the bullish structure.
Dynamic Resistance
Descending trendline: currently around 0.00010500 – 0.00011000, serving as the upper boundary of the triangle.
A 3D candle close above this line will be the first bullish breakout confirmation.
Major Resistance Targets (Post-Breakout Levels)
1. 0.00013544 — first breakout target / local resistance.
2. 0.00016150 — secondary resistance zone.
3. 0.00018000 — key resistance from previous high.
4. 0.00020554 — medium-term breakout target.
5. 0.00025819 — strong bullish continuation zone.
6. 0.00029800 — major measured-move target of the triangle.
---
4. Bullish Scenario
Bullish Confirmation:
A 3D candle close above the descending trendline.
Volume expansion during breakout.
Successful retest of the breakout zone turning resistance into new support.
Potential Move: Once confirmed, the breakout projection points to a potential rally toward 0.000258 – 0.000298, implying an upside of roughly +140% to +180% from the current price (0.00010542).
Additional Validation:
3D RSI breaking its descending trendline → momentum confirmation.
Gradual increase in accumulation volume → smart money participation.
---
5. Bearish Scenario
Bearish Confirmation:
3D candle close below the ascending trendline (~0.00009000).
Volume increase during breakdown.
Failed retest (price unable to reclaim the broken support).
Downside Targets: If breakdown occurs, FLOKI could revisit the following areas:
0.00007000 — first support zone.
0.00005000 – 0.00004500 — secondary demand area.
0.00002657 — macro historical low and last defense for long-term holders.
However, as long as higher-lows remain intact, the bullish structure stays dominant, and breakdown probability remains lower.
---
6. Technical Summary
Pattern: Symmetrical Triangle (Neutral, but with bullish bias).
Current Bias: Slightly bullish due to rising higher-lows.
Main Confirmation: 3D close above descending resistance (0.000105–0.000110).
Upside Targets: 0.000135 → 0.000161 → 0.000180 → 0.000205 → 0.000258 → 0.000298.
Key Supports: 0.000090 → 0.000070 → 0.000026.
Timeframe: 3D — ideal for swing and medium-term traders.
Interpretation:
FLOKI is approaching a critical compression point — a make-or-break zone.
A strong breakout with volume could trigger a new major bullish cycle, while a failure to hold the ascending base may lead to a deeper correction before the next accumulation phase.
---
7. Risk & Confirmation Notes
Always wait for 3D close confirmation before acting on breakout/breakdown.
Volume confirmation is crucial for validity.
Watch for fakeouts near the apex — safer entry comes after a retest.
Use proper stop-loss (below trendline or swing low) and position sizing.
---
8. Disclaimer
This analysis is for educational and informational purposes only, not financial advice.
Always do your own research (DYOR) and use strict risk management in every trade.
---
#FLOKI #FLOKIUSDT #FlokiInu #CryptoAnalysis #TechnicalAnalysis #TrianglePattern #SymmetricalTriangle #Breakout #Altcoins #CryptoSwing #ChartAnalysis #CryptoSetup #PriceAction #CryptoMarkets
FLOKI at Key Support – Is a Bounce Coming?The price of FLOKI has dropped back to an important level where it used to face resistance before going up. Now, this same level is acting as support, which could lead to a bounce.
We also see a bullish divergence on the RSI, It often signals that selling is slowing down and a reversal might be coming.
If the price holds above this support zone, we might see a bounce toward the $0.09 to $0.11 area.
If the price breaks below the support, the idea may not work, so it’s important to manage risk.

$FLOKI is again in my buy zone. Refill your bag opportunity..SEED_DONKEYDAN_MARKET_CAP:FLOKI has a history of impulsive pumps, and this green box has proven to be a reliable indicator for identifying entry points.
Another strong move appears to be on the horizon.
Altseason is approaching, with bullish divergence on the RSI and a MACD reset on the daily timeframe. My green line is currently acting as support.
Strategy: Enter as low as possible within the green box and sell at the peak of the next impulsive move.
As always, DYOR (Do Your Own Research).

#Floki price are preparing to surpriseAnother memecoin - #FLOKI It would seem that what can you get out of it? Well, I would like to take 75% of the profit , as in the trade on the chart !)
1️⃣ at night on the market fall and in the previous days, OKX:FLOKIUSDT price was very well “held”
2️⃣ globally, the #FLOKIUSDC price has worked out the desired correction, which was written about in May
What do you think, will this trade give profit 👍 or loss 👎 ?
