FLOKI/USDT – Big Rebound or Structural Breakdown?Timeframe: 5 Day
Market Condition: After a strong parabolic rally, FLOKI has entered a macro correction and distribution phase
Price is currently trading at a critical decision zone that will determine whether the macro bullish trend continues or shifts into a bearish structure
---
🟨 Key Support Zone (Yellow Block)
0.0000335 – 0.0000270
This zone represents:
Strong historical demand area
Previous accumulation base before a major impulsive move
High-probability buyer reaction zone
The last line of defense for long-term bullish structure
As long as price holds above this zone, FLOKI remains structurally bullish on a macro scale.
---
📐 Market Structure & Pattern Analysis
🔹 1. Market Structure
Formation of Lower Highs (LH) and Lower Lows (LL) → short-to-mid term downtrend
However, no confirmed major support breakdown yet
This move is still classified as a deep correction within a larger bullish cycle
---
🔹 2. Supply & Resistance Zones (Dashed Yellow Lines)
Key resistance levels:
0.0000730
0.0001125
0.0001380
These zones act as:
Major supply areas
Former support turned resistance
Potential distribution zones if price fails to break above them
---
🔹 3. Price Action Pattern
Current structure suggests:
Descending structure / falling channel
Potential development into:
Double Bottom (Bullish Reversal)
or Bearish Continuation Breakdown
Confirmation depends heavily on price reaction at the key support zone.
---
🟢 Bullish Scenario (Primary Reversal Setup)
Key conditions:
Strong rejection and sustained price action above 0.0000335 – 0.0000270
Presence of bullish candles with long lower wicks or impulsive moves
Bullish progression:
1. Strong rebound from key support
2. Formation of Higher Low (HL)
3. Break of minor structure
4. Upside targets:
🎯 0.0000730
🎯 0.0001125
🎯 0.0001380
📈 Bias: Buy on confirmation and reaction, not blind entries.
---
🔴 Bearish Scenario (Structural Breakdown)
Key conditions:
Strong 5D candle close below 0.0000270
Lack of meaningful buyer rejection
Implications:
Macro bullish structure becomes invalid
Previous support flips into resistance
Potential continuation toward:
0.0000200
Or a full retest of previous macro lows
📉 Bias: Breakdown favors trend continuation to the downside.
---
🧠 Technical Conclusion
FLOKI is currently sitting at a macro decision zone
The yellow support block is the critical level
Price reaction here will define:
🔄 Major bullish reversal
or ⛔ Extended bearish continuation
> “It’s not about predicting direction, it’s about reacting to confirmation at key levels.”
---
⚠️ Risk Management Note
Wait for candle confirmation
Avoid emotional entries
Always apply proper risk management
---
#FLOKI #FLOKIUSDT #CryptoAnalysis
#TechnicalAnalysis #PriceAction
#SupportResistance #Altcoins
#BullishScenario #BearishScenario
#TradingView #CryptoTrading
#MarketStructure #SupplyDemand
Flokiusdtanalysis

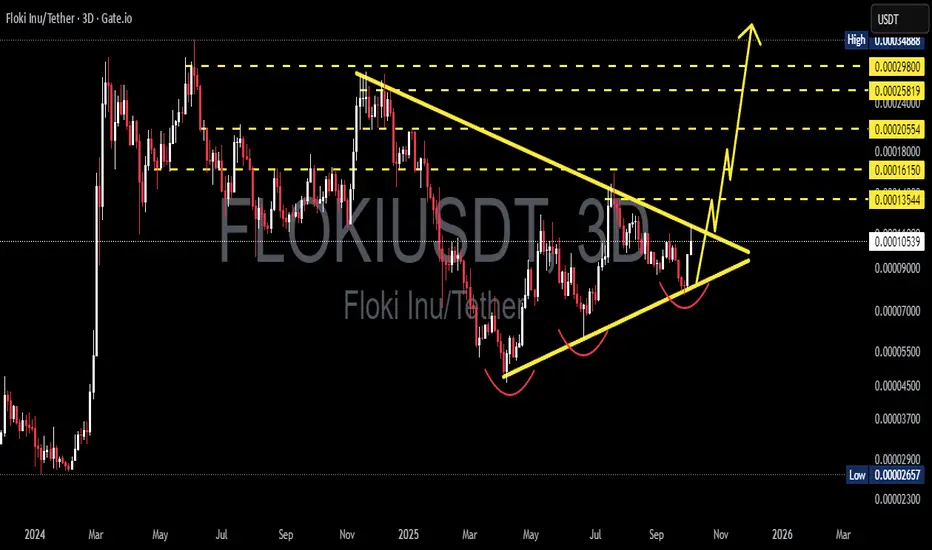
FLOKIUSDT — Symmetrical Triangle: Consolidation Before Big Move?1. Overview
The FLOKI/USDT (3D, Gate.io) chart is forming a large symmetrical triangle, developing since early 2025.
This pattern reflects a prolonged consolidation phase following a significant downtrend, where market participants are balancing between selling pressure and gradual accumulation before the next major directional move.
Interestingly, the lower structure shows several rounded bottoms along the ascending trendline — a strong indication of gradual accumulation by larger buyers, as each dip is being bought higher than the previous one.
---
2. Pattern Analysis
Primary pattern: Symmetrical Triangle — a neutral structure that can break either way, depending on momentum and volume confirmation.
Ascending trendline (support): consistent higher lows indicate rising buying interest and absorption of sell orders.
Descending trendline (resistance): each rally meets selling pressure near this line, forming lower-highs.
Sub-pattern: multiple rounded bottoms (forming a slight triple-bottom structure) that often precede bullish breakouts from consolidation.
Volume behavior: still relatively quiet, but a breakout is often accompanied by a sharp increase in trading volume — a key element to watch.
---
3. Key Technical Levels
Dynamic Support
Ascending trendline: around 0.00009000 – 0.00009200, acting as a strong defensive zone for buyers.
A breakdown below this line would invalidate the bullish structure.
Dynamic Resistance
Descending trendline: currently around 0.00010500 – 0.00011000, serving as the upper boundary of the triangle.
A 3D candle close above this line will be the first bullish breakout confirmation.
Major Resistance Targets (Post-Breakout Levels)
1. 0.00013544 — first breakout target / local resistance.
2. 0.00016150 — secondary resistance zone.
3. 0.00018000 — key resistance from previous high.
4. 0.00020554 — medium-term breakout target.
5. 0.00025819 — strong bullish continuation zone.
6. 0.00029800 — major measured-move target of the triangle.
---
4. Bullish Scenario
Bullish Confirmation:
A 3D candle close above the descending trendline.
Volume expansion during breakout.
Successful retest of the breakout zone turning resistance into new support.
Potential Move: Once confirmed, the breakout projection points to a potential rally toward 0.000258 – 0.000298, implying an upside of roughly +140% to +180% from the current price (0.00010542).
Additional Validation:
3D RSI breaking its descending trendline → momentum confirmation.
Gradual increase in accumulation volume → smart money participation.
---
5. Bearish Scenario
Bearish Confirmation:
3D candle close below the ascending trendline (~0.00009000).
Volume increase during breakdown.
Failed retest (price unable to reclaim the broken support).
Downside Targets: If breakdown occurs, FLOKI could revisit the following areas:
0.00007000 — first support zone.
0.00005000 – 0.00004500 — secondary demand area.
0.00002657 — macro historical low and last defense for long-term holders.
However, as long as higher-lows remain intact, the bullish structure stays dominant, and breakdown probability remains lower.
---
6. Technical Summary
Pattern: Symmetrical Triangle (Neutral, but with bullish bias).
Current Bias: Slightly bullish due to rising higher-lows.
Main Confirmation: 3D close above descending resistance (0.000105–0.000110).
Upside Targets: 0.000135 → 0.000161 → 0.000180 → 0.000205 → 0.000258 → 0.000298.
Key Supports: 0.000090 → 0.000070 → 0.000026.
Timeframe: 3D — ideal for swing and medium-term traders.
Interpretation:
FLOKI is approaching a critical compression point — a make-or-break zone.
A strong breakout with volume could trigger a new major bullish cycle, while a failure to hold the ascending base may lead to a deeper correction before the next accumulation phase.
---
7. Risk & Confirmation Notes
Always wait for 3D close confirmation before acting on breakout/breakdown.
Volume confirmation is crucial for validity.
Watch for fakeouts near the apex — safer entry comes after a retest.
Use proper stop-loss (below trendline or swing low) and position sizing.
---
8. Disclaimer
This analysis is for educational and informational purposes only, not financial advice.
Always do your own research (DYOR) and use strict risk management in every trade.
---
#FLOKI #FLOKIUSDT #FlokiInu #CryptoAnalysis #TechnicalAnalysis #TrianglePattern #SymmetricalTriangle #Breakout #Altcoins #CryptoSwing #ChartAnalysis #CryptoSetup #PriceAction #CryptoMarkets
FLOKIUSDT — Demand Zone Retest: Major Rebound or Breakdown?Full Analysis:
FLOKI is currently facing a make-or-break moment as price revisits the daily demand zone at 0.000085–0.000091 (yellow box on the chart). Historically, this zone has acted as a strong launchpad, pushing FLOKI higher multiple times in the past few months.
However, this time the context is different. Since late July, the structure has been printing lower highs, signaling persistent selling pressure. This descending momentum forms a structure similar to a descending triangle, where repeated support tests often weaken the level. In other words, this demand zone is not just a bounce opportunity, but the ultimate battleground for FLOKI’s next trend.
---
🔹 Bullish Scenario
As long as FLOKI holds above 0.000085–0.000091, the chance for a rebound remains alive.
First bullish trigger: a daily close above 0.0001024 (key S/R flip). This would confirm strength and shift short-term momentum.
If confirmed, upside targets are layered at 0.0001209 → 0.0001534 → 0.0002006, with an extended move potentially reaching 0.0002639.
Invalidation: A daily close below 0.000085 would cancel this setup.
---
🔹 Bearish Scenario
A clear daily close below 0.000085 would confirm breakdown of the demand zone.
In this case, FLOKI could extend lower toward 0.000070 → 0.000052 → 0.0000455 (historical low).
Even weak bounces that get rejected at 0.0001024 or 0.0001209 would reinforce bearish continuation and confirm sellers’ dominance.
---
🔹 Pattern & Structure
FLOKI is showing descending pressure into a flat support — a structure often seen in descending triangles.
Statistically, this pattern leans bearish. But traders must watch closely:
A false breakdown below support, followed by a sharp recovery, could trigger a short squeeze rally.
A clean reclaim of 0.0001024 would strongly shift sentiment back to the bulls.
---
🔹 Strategy & Risk Management
Long idea: Aggressive entries inside the demand zone with a tight stop below 0.000085. Conservative entries wait for confirmation above 0.0001024.
Short idea: Either wait for a confirmed daily close below 0.000085, or look for strong rejections at 0.0001024/0.0001209.
Keep in mind: FLOKI is a high-volatility asset, so position sizing and stop placement are critical.
---
📌 Conclusion
FLOKI is at a critical crossroads. The 0.000085–0.000091 demand zone is the last stronghold that separates a potential major rebound from a deeper breakdown. The market’s reaction here will likely define FLOKI’s mid-term trend for the coming weeks.
#FLOKI #FLOKIUSDT #Altcoin #Crypto #TechnicalAnalysis #PriceAction #SupportResistance #DemandZone #BullishScenario #BearishScenario

FLOKIUSDT Pullback at Fibonacci Resistance – Bounce?📊 Market Overview:
FLOKI has recently posted a remarkable rally, gaining over +200% from the swing low at 0.00004548. This surge broke through multiple resistance levels, forming a strong bullish market structure with clear Higher Highs (HH) and Higher Lows (HL).
However, this bullish momentum has now met a critical resistance at 0.00015339, which aligns with the Fibonacci 0.382 retracement level of the previous macro move. This rejection has triggered a pullback, raising questions: is this a healthy retracement, or the start of a trend reversal?
---
🧠 Technical Breakdown:
✅ Bullish Structure in Play
The recent move appears to be part of a larger impulsive wave, possibly Wave 1 or 3 of an Elliott Wave sequence.
✅ Golden Pocket Zone in Sight
The highlighted yellow box marks the Fibonacci Golden Pocket area between 0.5 (0.00011441) and 0.618 (0.0001104) — historically, this is a high-probability buy zone where bulls often regain control.
✅ Breakout Retest Potential
The current pullback could be a textbook retest of the previous breakout base, setting up for continuation — but only if this key zone holds.
---
🟢 Bullish Scenario:
If the price finds support at the 0.000110–0.000114 zone, and forms a strong bullish reversal candle (e.g., bullish engulfing, hammer), it could ignite a fresh wave upward targeting:
🔼 0.00015339 (breakout level)
🔼 0.00018212
🔼 0.00020366
🔼 0.00022000
🔼 0.00026506
🏁 0.00028898 — the previous major high and full swing target
Such a move would validate the continuation of the macro uptrend and possibly confirm Wave 3 in a larger Elliott Wave structure.
---
🔴 Bearish Scenario:
On the other hand, a daily close below 0.000110 would invalidate the bullish golden pocket thesis and potentially shift momentum in favor of the bears.
Possible downside targets include:
🔻 0.00008500 — minor support and demand zone
🔻 0.00004548 — the macro low and strong historical support
This would form a Lower High (LH) structure, which could signal the beginning of a bearish trend or extended consolidation.
---
🔍 Conclusion:
> FLOKIUSDT is now at a make-or-break level. The 0.000110–0.000114 zone is where bulls and bears will battle for control of the trend.
Hold here — and we may see a strong continuation.
Break below — and caution is warranted.
Wait for clear price action confirmation in the coming sessions before positioning. This zone will likely dictate FLOKI’s next major move.
---
💡 Pro Tips for Traders:
Watch for bullish reversal candlesticks in the golden pocket area.
Monitor volume — rising volume on a bounce increases breakout probability.
RSI divergence may provide early signs of trend reversal or continuation.
#FLOKIUSDT #FLOKI #CryptoAnalysis #AltcoinRally #FibonacciLevels #TechnicalAnalysis #BullishScenario #BearishScenario #PriceAction #CryptoBreakout #GoldenPocket #TrendReversal

FLOKIUSDT Breaks Key Resistance – Bullish Continuation Ahead?BINANCE:FLOKIUSDT is trading inside its longest ascending triangle. The price has respected the triangle's support and bounced back. It has now broken a key resistance zone. As seen in the chart, every time the price breaks a major resistance, a bullish move follows, and we can expect a similar scenario this time.
SEED_DONKEYDAN_MARKET_CAP:FLOKI CRYPTO:FLOKIUSD
Cheers
Hexa🧘♀️

FLOKI/USDT — Major Breakout Incoming? The Calm Before a BullishThe daily chart of FLOKI/USDT reveals a highly compelling technical setup. After a prolonged downtrend that started in late 2024, FLOKI is now testing a key descending trendline — signaling a potential trend reversal and the beginning of a new bullish phase if a breakout is confirmed.
📊 Detailed Technical Analysis:
🔍 Pattern Formation:
Descending Trendline Resistance: Acting as a dynamic resistance since the November 2024 high, capping every major rally attempt.
Consistent Higher Lows: Since March 2025, FLOKI has been forming a series of higher lows — an early bullish sign of accumulation.
Volatility Squeeze: Recent candles are consolidating near the apex of the triangle, suggesting a breakout move is imminent.
Bullish Structure Forming: A successful breakout would complete a bullish reversal pattern on the daily chart.
🟢 Bullish Scenario (Breakout Confirmation):
If the price closes above 0.0001079 on the daily timeframe and confirms a clean breakout above the descending trendline, we can anticipate an extended move to the upside.
🎯 Key upside targets based on historical resistance zones:
1. Target 1: 0.00011535 → Previous minor resistance
2. Target 2: 0.00013414 → March 2025 supply zone
3. Target 3: 0.00016078 → Strong horizontal resistance
4. Target 4: 0.00020000 → Major psychological level
5. Target 5: 0.00028779 → Previous swing high (November 2024)
💥 A full breakout move to the top could offer over 200% potential upside, making it a high-reward setup for well-managed long entries.
🔴 Bearish Scenario (Rejection):
If FLOKI fails to break above the descending trendline:
⚠️ We could see a retracement to lower support levels:
Minor Support: 0.00007500
Key Support: 0.00005700
Last Defense: 0.00004548 → Previous cycle low
A breakdown below these support levels would invalidate the bullish setup and shift momentum back in favor of the bears.
🧠 Pro Tips:
Watch for Volume Confirmation during the breakout — high volume adds credibility.
Focus on Body Closes, not just wicks, when identifying valid breakouts.
Manage Risk Wisely — a stop loss just below the trendline offers solid risk-to-reward.
📅 Conclusion:
FLOKI/USDT is at a critical technical juncture. A confirmed breakout above the descending trendline could spark a strong bullish trend, while a rejection may lead to deeper correction or consolidation.
💡 The next few candles will likely determine the medium-term direction for FLOKI.
#FLOKI #FLOKIUSDT #AltcoinBreakout #CryptoSetup #TechnicalAnalysis #BullishCrypto #BreakoutTrade #TrendReversal #CryptoSignals

1000 Floki swing trade setupwait for the entries, must use SL. Don't go for long at any coin wait for the short entries.

FLOKIUSDT 1D AnalysisFLOKI ~ 1D Analysis
#FLOKI Buy back from here with a short term target of at least 15%+ and a long term target of $0.00028

FLOKIUSDT 1D AnalysisFLOKI ~ 1D Analysis
#FLOKI Buy after successfully penetrating this resistant line with a short -term target of at least 10%+ from here.

FLOKIUSDT 4DFLOKI ~ 4D Analysis
#FLOKI High risk trading. Buy gradually from here if you still have a Conviction on this coin with a short -term target of at least 20%+.

Is FLOKIUSDT About to Explode or Collapse?Yello, Paradisers! Are we on the verge of a breakout for FLOKIUSDT, or is a deeper retracement looming? Let’s break it down with clear action steps to keep you on the right side of the trade.
💎FLOKIUSDT has recently shown a bullish I-CHoCH (Internal Change of Character) and is currently undergoing a healthy retracement. This retracement is a critical moment that could lead to significant price movement depending on what happens next.
💎If FLOKIUSDT bounces from the current price and successfully breaks the resistance trendline, it will significantly increase the probability of a bullish continuation. This would signal the market’s intent to push higher, making it a potential opportunity for well-planned entries.
💎Should the price dip lower to grab inducement before bouncing, keep an eye on the strong support zone. A bounce from this level paired with a bullish I-CHoCH on lower timeframes will increase the odds in your favor, making it a better entry for those looking to go long.
💎If the price breaks and closes a candle below the strong support zone, it will invalidate the bullish setup entirely. In that case, the best strategy would be to wait patiently for clearer price action to form before making any moves.
As always, it’s essential to stay disciplined and follow a high-probability strategy. Trading without confirmation can expose you to unnecessary risks, so be sure to wait for the market to show its hand before committing to a trade.
MyCryptoParadise
iFeel the success🌴

FLOKIUSDT 3DFLOKI ~ 3D
#FLOKI In Time Frame 3D, it still maintains this support block. If you still have Conviction on this coin, buy it from here with a minimum target of 20%++

FLOKIUSDT 1DFLOKI Update ~ 1D
#FLOKI If you still have Conviction on this coin,. This is a great time to start buying back. Minimum target 20%+

FLOKIUSDT 2DFLOKI ~ 2D
#FLOKI Buy gradually on this support block,. With a minimum target of 20%++. It's clearly visible. This is an accumulation area for now.

FLOKIUSDTFLOKI ~ 2D ✅
#FLOKI If you are interested in this meme,. It seems very interesting to buy gradually inside this pattern

FLOKIUSDTFLOKI ~ 2D ✅
#FLOKI We hope that this Demand Zone will be retested to attract buyers. This scenario would be possible Dobble Bottom-up.
However, if this Demand Zone is not strong enough to withstand selling pressure and buyers lose momentum, it will be very clear that the price will fall at the key support that we expect.

FLOKIUSD 1WFLOKI ~ 1W
#FLOKI We are still bullish here. As long as the price maintains this pattern.
buy in stages with a target of at least 15%+ from here.

FLOKIUSDT Elliott Waves AnalysisHello friends.
Please support my work by clicking the LIKE button👍(If you liked). Also i will appreciate for ur activity. Thank you!
Everything on the chart.
Entry: Market and lower
Targets: 0.00022 - 0.00027 - 0.00035 - 0.00045
after first target reached move ur stop to breakeven
Stop: (depending of ur risk).
ALWAYS follow ur RM
risk is justified
Good luck everyone!
Follow me on TRADINGView, if you don't want to miss my next analysis or signals.
It's not financial advice.
DYOR!

FLOKI / FLOKIUSDTLet's see
Good Luck >>
• Warning •
Any deal I share does not mean that I am forcing you to enter into it, you enter in with your full risk, because I'll not gain any profits with you in the end.
The risk management of the position must comply with the stop loss.
(I am not sharing financial or investment advice, you should do your own research for your money.)

FLOKIUSD 1DFLOKI ~ 1D 📈
#FLOKI Forming a Bull Flag Pattern. Make purchases gradually in this pattern, with a minimum target of 15%+ 📈
