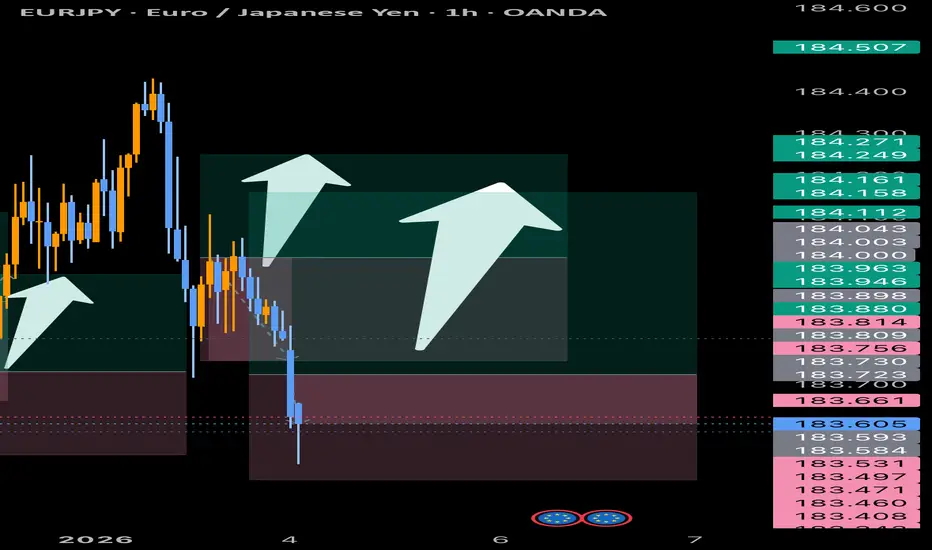
BUY STOP EURJPY Buy reversal towards the upside price
Eurjpy buy @ 183.8+
TP1: 183.888
TP2:183.933
TP3: 183.988
TP4 :184.040
SL - 183.390
Followme

BUT STOP 183.800Buy reversal towards the upside price
Eurjpy buy @ 183.8+
TP1 : 183.888
TP2 : 183.933
TP3 : 183.988
TP4 : 184.040
SL - 183.390
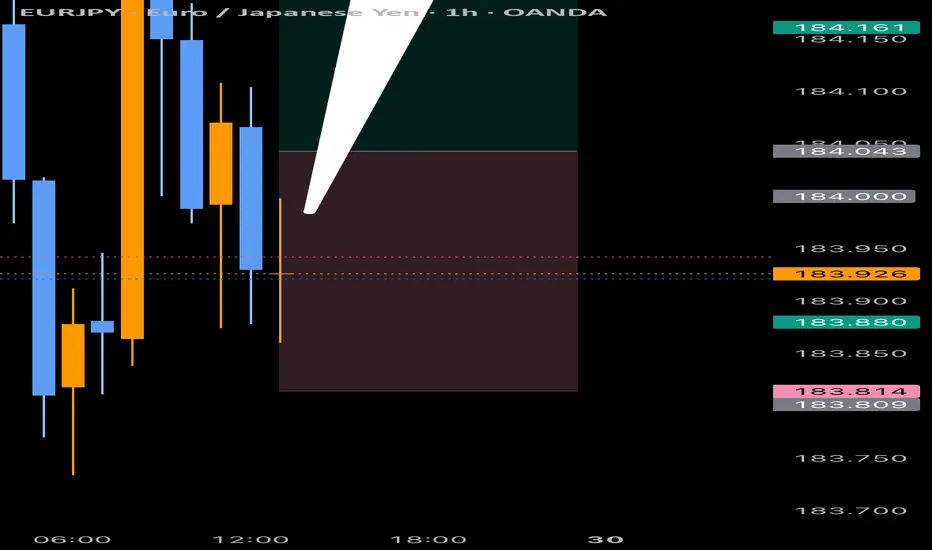
HUGE BLUES & PROFITSEurjpy has absolutely hit (TAKE PROFIT) and performed as expected all targets hit
EXPECTED PRICE EXCEEDED : 184+

BUY EURJPY 183.9+Euroy looking to fill its gap to the upside and break into a new price because of the new year and new price stay tuned for the update when we reach a new price 184.9+
EXPECTED REAL PRICE :185
Fot the year 2026

183.5+ EURJPY BUY Eurjpy Buy @ 183.580
TP1 : 183.660
TP2 : 183.680
TP3 : 183.700
TP4 : 183.900
SL : 183.080
Trading is risky make sure to move (SL) to (Profit) and close partials if you can
Trade requirements - (50/50)+Trial Stop

EURJPY 184+-185+Eurjpy Buy @ 184.100
TP1 : 184.160
TP2 : 184.222
TP3 : 184.300
TP4 : 184.400
SL : 183.710
Move stop loss to entry 50/50 required
Partials
BUY EURJPY REVERSAL Eurjpy has triggered the previous trade and if you closed some profits that good as it it turned back, but now can buy to send it back to its recent highs

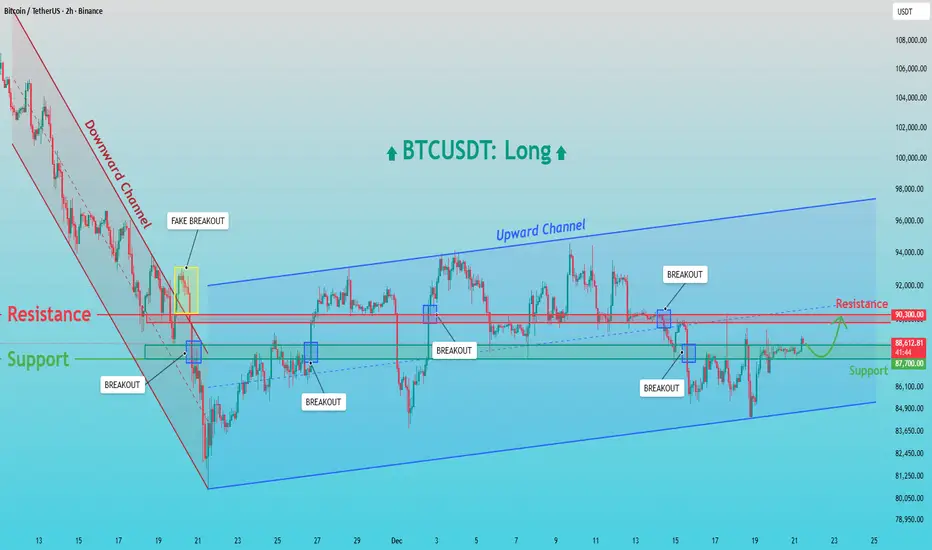
BTCUSDT: Holds Demand - Retest of 90,300 Resistance LikelyHello everyone, here is my breakdown of the current BTCUSDT setup.
Market Analysis
BTCUSDT recently transitioned from a strong downward channel into a broader bullish recovery phase. After a prolonged bearish move, price formed a base near the channel low, where selling pressure weakened. This led to a breakout from the downward channel; however, the first move above resistance resulted in a fake breakout, indicating that sellers were still active at that level. Following this, Bitcoin found strong demand around the 87,000 Support Zone, where buyers stepped in aggressively. From this area, price began to form higher lows and successfully established an ascending (upward) channel, signaling a shift in short-term market structure toward bullish control. Within this upward channel, BTC experienced several clean breakouts above intermediate resistance levels, confirming improving momentum. The key horizontal level around 90,300 acted as a major resistance, where price was rejected multiple times. Despite these rejections, the market did not break down sharply, suggesting absorption of selling pressure rather than distribution.
Currently, BTCUSDT is pulling back toward the 87,000 Support Zone, which aligns with previous resistance turned support and the lower boundary of the upward channel. Price action here remains constructive, with consolidation rather than impulsive selling, indicating that the move lower is corrective.
My Scenario & Strategy
My primary scenario remains bullish as long as BTC holds above the 87,000 support. This zone is a key demand area, and a strong reaction from here could lead to another attempt toward the 90,300 Resistance and a continuation within the upward channel. A confirmed breakout and acceptance above the 90,300 level would open the door for further upside toward higher channel targets.
However, a failure to hold the 87,000 Support Zone would signal weakness and could trigger a deeper correction toward the lower channel boundary. For now, the market structure favors long positions, with support holding and resistance as the next upside objective.
That's the setup I'm tracking. Thank you for your attention, and always manage your risk.
EURUSD: Rejection at Key Resistance - Support Zone at 1.1720Hello everyone, here is my breakdown of the current EURUSD setup.
Market Analysis
EURUSD is trading within a broader bullish structure, but the current price action points to a short-term corrective phase. After establishing an upward channel, price successfully broke above the previous consolidation range, confirming bullish momentum. This breakout pushed the pair higher toward the 1.1770 Resistance Zone, which has historically acted as a strong supply area.
Currently, at this resistance, price has shown hesitation and rejection, indicating that sellers are starting to defend this level. As a result, EURUSD is now pulling back from the highs, moving toward the 1.1720 Support Zone, which aligns with the previous breakout area and the lower boundary of the upward channel. This support zone is critical, as it represents the key demand area sustaining the bullish structure.
My Scenario & Strategy
My scenario is short-term bearish as long as EURUSD remains capped below the 1.1770 Resistance Zone. I expect a controlled pullback toward the 1.1720 Support, where buyers are likely to step in and attempt to defend the trend. A clean breakdown below this support would confirm a deeper correction within the channel.
However, if price holds above the support zone and shows a strong bullish reaction, the broader uptrend remains intact, and another attempt toward the resistance highs may follow. For now, the focus is on the corrective move, with 1.1720 as the key level to watch.
That's the setup I'm tracking. Thank you for your attention, and always manage your risk.

XAUUSD Defends Support – Upside Move Toward 4,380 ExpectedHello traders! Here’s my technical outlook on XAUUSD based on the current market structure. Gold continues to trade within a well-established bullish trend, supported by a clear ascending Trend Line that has been respected after multiple pullbacks. After an earlier rejection from the upper Resistance Level, price experienced a corrective decline but successfully turned around near the trend line, confirming strong buyer interest at lower levels. Following this reaction, XAUUSD broke above the descending Resistance Line, signaling a shift in momentum back in favor of buyers. The market then entered a Range phase, where price consolidated between the Support Level around 4,260 and the Buyer Zone near 4,300, indicating accumulation and balance before the next impulse move. A confirmed breakout from the range occurred to the upside, with buyers aggressively pushing price above the Buyer Zone. Currently, gold is trading firmly above 4,300, showing sustained bullish strength and acceptance above previous resistance. The next key area of interest is the upper Seller Zone / Resistance Level around 4,380, which has acted as a strong reaction zone in the past. As long as price holds above the 4,260 Support Level and continues to respect the ascending trend line, the bullish scenario remains valid. My primary scenario is a continuation toward the 4,380 resistance, where a reaction or short-term rejection may occur. A clean breakout above this Seller Zone could open the door for further upside expansion, while rejection may lead to a healthy pullback toward the Buyer Zone or trend line support. For now, the structure clearly favors buyers, with 4,380 as the main upside target. Please share this idea with your friends and don’t forget to manage your risk 🚀

Airbnb: Proof that even stocks love to traveThe analysis of Airbnb (ABNB) stock reveals an intriguing setup following the breakout and retest of a key resistance level, which previously acted as a trendline on the daily chart. After successfully breaking above this line and confirming it with a retest, the price is now showing potential for further upside — aligning with a bullish scenario that targets the $164 area, which also coincides with the 1.0 Fibonacci level (164.12).
The current structure suggests the beginning of an upward movement after a period of consolidation, with both the 50-day and 200-day moving averages (MA50 and MA200) positioned to support further growth, reinforcing the overall bullish outlook.
Notably, trading volume has increased in line with the breakout and continued price movement, adding confidence to the scenario playing out toward the higher targets. Key Fibonacci resistance levels to watch next include 0.786 (150.37) and 1.272 (181.61), with a long-term extension target at 1.618 (203.85).

XAUUSD: Buying Pressure Aims for the $4,260 ResistanceHello everyone, here is my breakdown of the current Gold (XAUUSD) setup.
Market Analysis
Gold continues to trade within a broader bullish structure, with price action developing inside a well-defined ascending channel. After the previous impulse move higher, the market entered a consolidation phase below the $4,260 Resistance Zone, where sellers repeatedly defended the level. Earlier, XAUUSD produced a breakout from the upward channel structure and formed a temporary base above the mid-support area near $4,200, confirming that buyers still control the broader trend.
Currently, price is holding above the Triangle Support Line, showing that demand remains active on dips. The recent pullback into the $4,200–$4,190 support area looks corrective rather than impulsive, suggesting that bearish pressure remains limited for now. As long as price stays above this triangle support, the bullish market structure remains valid.
My Scenario & Strategy
My scenario is bullish while XAUUSD holds above the $4,200 Support Zone and respects the Triangle Support Line. I expect price to stabilize in this area and attempt a renewed push toward the $4,260 Resistance Zone, which is the key barrier for continuation.
Therefore, a clean breakout above $4,260 would confirm bullish continuation and open the door for further upside expansion toward higher historical levels. However, if price fails to hold the triangle support and breaks below $4,190–$4,180, this would weaken the bullish structure and could trigger a deeper corrective pullback toward the lower channel boundary. For now, the market maintains a long bias, with the main objective being a renewed test and potential breakout of the $4,260 resistance zone.
That’s the setup I’m tracking. Thank you for your attention, and always manage your risk.

E U R J P Y ULTRA BUY Eurjpy today will break out and reach a new expected price of 183.000
EXPECTED PRICE : 183+
REQUIREMENTS = (50/50 + TRIAL STOP)
BUY @ 182.600 | TP1 - 182.740

G O L D + S C A L P Gold structure giving us a nice direction so a buy stop has been put into place , and the pattern will play out as expected
( 50/50 + Trial Stop ) required

B I T C O I N MONEY Btcusd valid scalp setup to was the highs according to structure and price action,
( 50/50 method required + Trial Stop )

BITCOIN MONEY FRIENDS Bitcoin has hit new highs in terms of price and structure it’s been good trading btcusd very easy , all required is patience

BULLS ON EURJPY Eurjpy set buy stops , this pair won’t be dropping anytime soon, it’s perfectly clear and simple to follow
EXPECTED NEW HIGH - 182.500

BUY BTCUSD SIGNAL Bitcoin looking to be buying back, so there’s a buy stop that’s has been placed , in order to capitalise on the move , (50/50 + Trial) required

PROFIT ON EURJPY EUROYEN has hit take profit in a very clear and easy to follow pattern now will wait for more opportunities to make the most out of the trend

G O L D B U Y Gold looking to give some nice clear opportunities to the upside by looking at it’s structure , can capitalise on a nice scalp trade , remember to 50/50 the trades and trial

BTC BUY SIGNALBtcusd buy signal , remember to close
( 50/50 ) when in a trade or quick scalping position to avoid hitting stops loss with no rewards , always trial stop as well

EURJPY SUPER BUY RECAPEurjpy has performed as expected and hit
( TAKE PROFIT ), it’s very simple and clear setup and easy to follow

XAUUSD: Triangle Breakdown Setup Points Toward $4,160 SupportHello everyone, here is my breakdown of the current Gold setup.
Market Analysis
Gold has recently moved out of a strong upward channel, where price previously showed consistent bullish momentum supported by higher lows and clean breakouts. After breaking out of the first channel, XAUUSD formed a consolidation range, signaling temporary equilibrium between buyers and sellers. This range acted as a base for the next impulsive bullish leg, which drove price back into a new upward channel. However, after the strong rally, gold formed a fake breakout near the $4,240 resistance area, which coincides with the upper boundary of the triangle resistance line. This false breakout indicated weakening bullish pressure and exhaustion near the top of the structure. Once price failed to hold above the resistance, it rotated downward and began forming a tightening triangle pattern between the descending resistance line and the rising support line.
Currently, XAUUSD is trading inside this triangle structure, with price gradually compressing. The $4,160 support level remains a key reference point, as it previously acted as a major demand zone during the last correction and is now aligned with the triangle’s lower boundary.
My Scenario & Strategy
My scenario is bearish as long as gold stays below the triangle resistance line and continues to respect the lower highs forming within the pattern. If price maintains this structure and fails to reclaim $4,240, I expect a downward move toward the $4,160 support zone.
Therefore, a clean breakdown below the triangle support line would confirm bearish continuation and could open the door for a deeper correction. On the other hand, if price rejects the support and breaks above the triangle resistance, the bearish setup becomes invalid, and buyers may attempt another retest of the $4,240 level. For now, the structure favors a short bias with the main objective being a move toward the $4,160 support level, which remains the next significant target for sellers.
That's the setup I'm tracking. Thank you for your attention, and always manage your risk.
